Optimization of Acid Hydrolysis of Cassava Rhizome into Fermentable Sugars for Bioethanol Production Using Response Surface Methodology
Department of Chemistry, Faculty of Science, Khon Kaen University, Khon Kaen, 40002, Thailand and National Research University Project of Thailand, Biofuel Cluster, Khon Kaen University, Khon Kaen, 40002, Thailand.
Corresponding Author E-mail: chal_ru@kku.ac.th
DOI : http://dx.doi.org/10.13005/ojc/330545
Download this article as:
![]()
In this work, cellulose from cassava rhizome is a piquant substrate for bioethanol production because of annual renewability, large quantity, and low cost. The two-step pretreatments of cassava rhizome by using co-reagents of sodium chlorite and acetic acid followed with sodium hydroxide were performed in the removal of both lignin and hemicellulose for cellulose preparation. After pretreatment, cellulose content was increased to 70.5%, whereas hemicellulose and lignin were reduced to 11.2% and 9.4%, respectively. In the optimization of acid hydrolysis, a Response Surface Methodology (RSM) was applied to evaluate the relationship of various parameters could give the best experimental results. Additionally, a Central Composite Design (CCD) was utilized to plan the run experiments. Afterward, hydrolysis of pretreated cassava rhizome was conducted under optimal conditions; at 121°C, 15 psi, 90 min of hydrolysis time, 22.56 mL of acid volume per gram of sample, and 0.20 M of acid concentration. This process produced glucose with yield up to 81.25%. On the contrary, low content of inhibitors (5-hydroxymethyl furfural and furfural) were measured. The hydrolyzate was fermented by Saccharomyces cerevisiae TISTR 5339 gave both ethanol concentration and ethanol with yield up to 10.42 g/L and 23.51 g/100 g substrate, respectively. When compared with other agricultural residues, the production of ethanol from cassava rhizome in this work was higher. Therefore, cassava rhizome is a possible new source of feedstock for the production of bioethanol in the ethanol industry.
KEYWORDS:Acid Hydrolysis; Cassava Rhizome; Bioethanol Production; Fermentation; Response Surface Methodology; Two-steps Pretreatment
Introduction
The agricultural residue (corncob, cotton stalk, rice hulls, wheat straw, etc.) is a rich cellulose element, which can be turned into ethanol by either biochemical or thermochemical conversion means. The researchers were studied utilization of agricultural residue for solving the deficient petroleum due to their annual renewability, largeamount, low-price, clean energy, and eco-friendly. Moreover, ethanol from fermented cellulose has the same chemical structure from both fossil sources and either sugar or starch fermentation1, 2.
Cassava rhizome is an agricultural residue from the cassava cultivation. Actually, cassava is one of important corps in Thailand’s export. The export value of cassava products is inferior to rubber and rice3. Residue products from the cultivation of cassava have two types, namely stem and rhizome. Cassava stem is cultivated, whereas cassava rhizome part is discarded by either bake or landfill. The quantity of cassava rhizome is about 8-10 million tons per year, which is a large quantity of non-utilized cellulose4. From the basic element analyses, cassava rhizome is composed of cellulose, hemicellulose, lignin, moisture, and other. Cellulose is main composition of cassava rhizome (~40% w/w)5. Cassava rhizome was utilized in the production of bio-oil by fast pyrolysis, and converted to fuel by gasification technology 5, 6. However, the restriction of mentioned methods such as the requirement of anadvanced operative technology, expensive tools, and various products obtained are the main barriers in ethanol production industry7. In fact, fermentation is properly a suitable technique for bioethanol production since it needs the controllable condition and inexpensive tools. Thus, ethanol production from cassava rhizome by fermentation can be a potential method for ethanol production8.
The impediments such as porosity of lignocellulosic biomass, cellulose crystallinity, and non-cellulose compound of raw materials in ethanol production are key elements that affect the production efficiency9, 10. Therefore, the removal of those impediments by using several pretreatment methods including liquid hot water and steam explosion, dilute acid hydrolysis, ammonia fiber explosion, alkaline extraction, an organic solvent, and combination reagent can improve target product11, 12. Recently, a two-step chemical pretreatment has been presented as the best approach for cellulose preparation. The extraction with acid chlorite de-lignification followed by alkaline solution is widely used for a preparation of cellulose. The acid chlorite pretreatment could both remove and break link-bond relation of lignin. Acetic acid (CH3COOH) and sodium chlorite (NaClO2) are also co-solutions that can exterminate lignin of substrate under moderate temperature (70-80°C)13. Sodium hydroxide (NaOH) could reduce the amount of hemicellulose. After the pretreatment, cellulose is increased up to 45-60%, while hemicellulose and lignin are reduced to the average of 20-30% and 15-25%, respectively14.
The conversion of cellulose to glucose can be achieved by two methods, namely enzyme hydrolysis and acid hydrolysis. In enzyme hydrolysis, a dilute acid was utilized in the preparation of glucose. The main parameters including the ratio of sample per solution, the concentration of dilute acid solvent, hydrolysis time and others, can result in the by-products. The high yield of glucose and low inhibitors content can ideally result from the optimum conditions15. However, the optimization of hydrolysis, by considering the relation of each variable parameter, is a complicated step and can take a long time. Furthermore, the prodigality of reagent is the disadvantages of mentioned method. Recently, response surface methodology or RSM, which is a statistical technique for the delineated relationship of each parameter and predictable best results under an optimum condition, has been used. A central composite design (CCD) based on RSM is used to design the runs of experiment. The merit of RSM involves a reduced step, the reliable result, and time and energy-saving process16, 17.
In this study, cassava rhizome was used as the feedstock for bioethanol production. To prepare cellulose, co-reagents (NaClO2 and CH3COOH) followed with NaOH were used. The optimum conditions of hydrolysis were investigated by using RSM such as variation of acid concentration, acid volume per gram of sample and hydrolysis time. The hydrolyzate from the optimized circumstance was fermented by Saccharomyces cerevisias TISTR 5339.
Materials and Methods
Raw Material
Cassava rhizome (CR) was obtained from cassava field in Khon Kean province, Thailand. It was milled to reduce the particle size in the range of 20-80 mesh and dried at 60°C for 24 h.
Preparation Method
All chemicals were used AR grade. The first step, the milled CR was put into an Erlenmeyer flask and added water (16 mL per gram of the substrate). Next, NaClO2 (1.5 g/ g of the substrate) was filled. CH3COOH (0.05 mL/ g of the substrate) was added and mixed under stirring (100 rpm and heated at 70°C). Next, after hourly of the reaction was repeated the same addition of NaClO2 and CH3COOH for 3 h. After that, the white solid from filtration was improved neutral pH with tap water and removed the moisture at 105°C for 6 h. The second step, the oven-dried of CR from previously step was soaked in 0.25 M of NaOH (20% w/v) for 24 h. Then, the socking substrate was heated at 80°C for 1 h by a water bath. The white solid residue of a filter was rinsed until neutral pH and dried at 105°C for 6 h13.
Hydrolysis Process
Experimental Design
In this study, a RSM is software used to design the experiment of acid hydrolysis and analyses the optimum conditions for the glucose summit. Three independent variables, namely H2SO4 concentration (A), ratio of acid volume to sample (B), and hydrolysis time (C) were investigated at three levels with three repetitions at the central point, employed by CCD. The interested range of each parameter was presented in Table 1. Analysis of variance (ANOVA) was used to calculate the significance of statistical limiting factor. Therefore, the value from R-squared coefficient and the adjusted R-squared coefficient were utilized to consider the validation and the proper of models. The optimum values for the chosen variables were obtained by solving the regression equation using Design-Expert v.8.0.6 (Stat-Ease Inc., Minneapolis, MN)7, 13.
Table 1: Factors and experiment design levels to investigate the hydrolysis of two-stage pretreated CR sample
| Parameters | Unit | Symbol |
Coded levels |
||||
| –a | -1 | 0 | +1 | +a | |||
| H2SO4 concentration | M | A | 0.03 | 0.10 | 0.20 | 0.30 | 0.37 |
| Ratio of acid volume to sample | mL/g | B | 11.59 | 15.00 | 20.00 | 25.00 | 28.41 |
| Hydrolysis time | min | C | 40 | 60 | 90 | 120 | 140 |
Sample Hydrolysis
In each set of the experimental, 10 g of the dried pretreated CR were mixed with dilute H2SO4 solution into a screw cap reagent bottle. The reaction was carried out in an autoclave (All American Pressure Sterilizer, USA) at 121°C, 15 psi. After hydrolysis, the aqueous solution was separated from solid residues by filter paper (15.0 cm, Whatman, England). Then, the hydrolyzate was centrifuged at 5000 rpm for 10 min and collected the supernatant fraction. The final supernatant of the hydrolyzate from the run experiment was contemplated for glucose yield. Finally, the hydrolyzate from hydrolysis under optimum condition was quantitatively analyzed and identification tested for each sugar monomer (glucose and xylose) and inhibitor composite such as furfural, 5-hydroxymethyl furfural (5-HMF) and phenolic compounds).
Fermentation
Inoculation of Saccharomyces Cerevisiae TISTR 5339
The starter culture of S. cerevisiae TISTR 5339 purchased from the Microbiological Resource Center, Thailand Institute of Science and Technological Research (TISTR), Pathum Thani, Thailand, was inoculated into yeast extract-malt extract (YM) medium containing (per L): 3 g yeast extract, 3 g malt extract, 5 g peptone and 10 g glucose. The medium was autoclaved at 121°C for 15 min and cooled at room temperature (±32°C). One inoculation loop of S. cerevisiae TISTR 5339 was passed on the sterile medium and incubated on a rotating shaker at 100 rpm, at 30°C for 24 h17.
Fermentation of the CR Hydrolyzate
In batch fermentation, the obtained hydrolyzate from hydrolysis under optimum condition was adjusted to pH 5.5 by 0.25 M of NaOH and supplemented by the next synthetic nutrients (per L): 1 g of yeast extract, 1 g of MgSO4.7H2O, 2 g of (NH4)2SO4 and 5 g of KH2PO418, which employed as a medium for ethanol fermentation. Then, this medium was transferred in a screw cap reagent bottle (1 L) and disinfected at 121°C for 15 min. When a medium was leaved to cool at room temperature (32°C), S. cerevisiae TISTR 5339 (10% v/v) from the prior step was added to a medium. Next, this medium was incubated in an incubator at 30°C for 96 h. The sampling from the fermented solution was carried out every 24 h for determine of glucose residue, ethanol concentration, and followed up cell growth.
Analytical Methods
Composition assay of CR (cellulose, hemicellulose, lignin) before and after pretreatment were followed methodology using the procedure described by Lima et al.12. Ash content in the samples was analyzed according to the National Renewable Energy Laboratory (NREL)20.
The studied cellulose fractions into the cassava rhizome were identified using an Attenuated Total Reflection – Fourier Transform Infrared Spectrometer (ATR-FTIR, TENSOR27, Bruker, Germany). The dried powder of each samples (<100 mesh) for this analysis, the information was recorded from 4000 to 500 cm-1 at a resolution of 2 cm-1 with an accumulation of 16 scans.
The changeable morphological during the pretreatment was examined by a Desktop Scanning Electron Microscope (MiniSEM, SNE-4500M, SEC, Korea). The air-dried of each sample was coated with gold-palladium in a sputter coater (E-1010, Hitachi, Japan), then, observed with a MiniSEM at acceleration voltages of 15 kV.
Determination of glucose content in the overall hydrolyzate samples and the remaining glucose in ferment step were used a Glucose liquicolor test kit (REF; 10260, Human, Germany). Each hydrolyzate solution of 0.1 mL was added into 2.0 mL of test reagent. Then, these solutions was mixed homogeneously and incubated at 37°C for 5 min. Afterthat, those solutions were measured on absorbance mode at 500 nm by a UV-Visible spectrophotometer 14. The monomer sugars (glucose, xylose and arabinose) capacity and inhibitor compounds (5-HMF and furfural) were measured by a High Performance Liquid Chromotograph (HPLC,Water; Model: 600; USA) linked with Evaporative Light Scattering Detector (ELSD, Water; Model: 2424; USA) and 280 nm UV/visible (SPD-20A; Water; USA), and a Hi-Plex H (300 mm 7.7 mm; Varian) stainless steel analytical column. Operating conditions were as follows: column temperature at 25°C, mobile phase was used mixture solution of acetonitrile and MilliQ water in 0.5 mL/min of flow rate, and analysis time was studied at 40 min and 20 min for sugar and inhibitor contents, respectively.
Cell growth of S. cerevisiae TISTR 5339 ferment process was trailed by the Standard Plate Count method19. Ethanol concentration in ferment solution was determined using a gas chromatograph (Trace GC, Thermo Finnigan, Italy) with a capillary DB-5 column (30 x 0.25 mm i.d.; J & W Scientific; USA) and a flame ionization detector under the study conditions: helium (carried gas), oven temperature at 60°C, injection temperature at 250°C, and detector temperature at 280°C. The n-butanol was used as an internal standard. Sample injection volume was 1 µL13.
Results and Discussion
Characterizations of Cr Samples
The preliminary composition analysis of CR; cellulose, hemicellulose, and lignin (before and after pretreatment) are shown in Table 2. The components of CR were changed through chemical affected of two-steps pretreated process, cellulose contain was increased up to 70.5% from 48.2% of raw material, the content of lignin and hemicellulose are reduced at 11.2% and 9.4% from 23.9% and 20.9% of untreated substrate, respectively.
Table 2: Chemical composition of CR compared with others agricultural residues
| Raw material |
Content (%)c |
References | ||
| Cellulose | Hemicellulose | Lignin | ||
| Cotton stalka |
30.0 |
13.0 |
31.0 |
Binod et al. [15] |
| Rice hullsa |
34.1 |
14.6 |
19.0 |
Dadnino et al. [4] |
| Cassava Stema |
35.2 |
24.3 |
33.8 |
Han et al. [7] |
| Rice strawa |
36.8 |
25.8 |
15.8 |
Jeya et al. [1] |
| Wheat Strawa |
40.9 |
36.9 |
13.5 |
Qi et al. [18] |
| Mission grassa |
47.2 |
27.3 |
18.2 |
Prasertwasu et al. [16] |
| Sugarcane bagassea |
48.4 |
29.9 |
17.1 |
Chen et al. [6] |
| Cassava rhizomea |
48.2 |
23.9 |
20.9 |
This work |
| Cassava rhizomeb |
70.5 |
11.2 |
9.4 |
|
a Untreated
b Pretreated by two-step pretreatment
c< ±1.0, Standard deviation (n = 3)
Cellulose capacity of the untreated CR had less then cellulose content of sugarcane bagasse6. However, the results composition of the untreated CR had higher cellulose element when compared with these among substrate; cotton stalk, rice hulls, cassava stem, rice straw, wheat strew and mission grass4, 6-7, 15-16, 18. The sum of cellulose was an indicated the ability changeable total of glucose in the lignocellulosic materials. Meanwhile, lignin is a structural support for the plant contains no sugars and included in the cellulose molecules. Which, higher lignin capacity makes the hydrolysis step more difficult. Thus, the decreasingly lignin amount using two-step pretreatment was solved the above-mentioned catch and took proper structure of substrate for hydrolysis12.
The ATR-FTIR spectra of CR (before and after pretreatment) were indicated in Fig. 1. The both spectra were liked pattern. The considered absorption bands; 1730 cm-1 , 1509 cm-1 and 1238 cm-1 weredelineated the functional group alterations of hemicellulose, lignin and cellulose, respectively. In Fig. 1b, the intensity of a peculiar hemicellulose band at 1730 cm-1 in the ATR-FTIR spectrum was decreased in the pretreated CR, indicating that hemicellulose were partly removed during the pretreatment process 10.
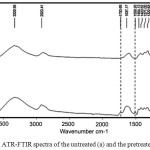 |
Figure 1: ATR-FTIR spectra of the untreated (a) and the pretreated of CR (b) Click here to View figure |
Scanning electron microscope (SEM) images of the untreated and the pretreated of CR are shown in Fig. 2. The raw sample (Fig. 2a) shows compact rigid particle structure. After the pretreatment, the CR is harmed to a certain scope with some materials peel off from the surface. Moreover, some diminutive holes are appeared on the exterior. However, the framework of CR pretreated is even featured by a tubular configuration (Fig. 2b). The morphological changed of CR was ascribed to the organic solvents of two-steps pretreatment resulted in a decreases the crystalline substrate and the degree of polymerization. This, sodium hydroxide, besides converting lignin to its more soluble sodium derivative, removed low molecular weight carbohydrate components from the cell wall structure, thereby causing an enlargement of the pores in the substrate and an improvement in the accessibility to reagents6.
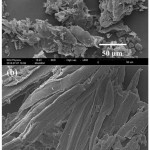 |
Figure 2: SEM images of all CR samples; non-pretreated (a) and CR pretreated (b) Click here to View figure |
RSM Optimization of the Hydrolysis Conditions
Statistical Model Analysis
The experimental reports of the three independent variables; H2SO4 concentration of 0.1-0.3 M, ratio of acid volume to sample of 15-25 mL/ g, and hydrolysis time of 60-90 min, were integrated using by the mode of RSM for optimizing the hydrolysis process as shown in Table 3.
Table 3: Experimental design with three independent variables and the obtained results by hydrolysis of two-steps pretreated CR
|
Std |
Run |
A (M) |
B (mL/g ) |
C (min) |
Measured valuea (g/100 g of substrate) |
Predicted value (g/100 g of substrate) |
% Error |
|
1 |
5 |
0.10 |
15.00 |
60 |
30.93 |
30.09 |
2.79 |
|
2 |
7 |
0.30 |
15.00 |
60 |
35.44 |
37.11 |
-4.50 |
|
3 |
1 |
0.10 |
25.00 |
60 |
65.49 |
68.44 |
-4.31 |
|
4 |
2 |
0.30 |
25.00 |
60 |
55.88 |
56.07 |
-0.34 |
|
5 |
8 |
0.10 |
15.00 |
120 |
20.98 |
23.12 |
-9.26 |
|
6 |
6 |
0.30 |
15.00 |
120 |
40.55 |
39.93 |
1.55 |
|
7 |
4 |
0.10 |
25.00 |
120 |
47.54 |
48.20 |
-1.37 |
|
8 |
15 |
0.30 |
25.00 |
120 |
42.44 |
45.61 |
-6.95 |
|
9 |
3 |
0.03 |
20.00 |
90 |
45.66 |
43.86 |
4.10 |
|
10 |
14 |
0.37 |
20.00 |
90 |
49.07 |
47.58 |
3.13 |
|
11 |
12 |
0.20 |
11.59 |
90 |
29.78 |
29.50 |
0.95 |
|
12 |
9 |
0.20 |
28.41 |
90 |
69.55 |
66.53 |
4.54 |
|
13 |
10 |
0.20 |
20.00 |
40 |
51.42 |
50.18 |
2.47 |
|
14 |
17 |
0.20 |
20.00 |
140 |
37.58 |
35.52 |
5.80 |
|
15 |
16 |
0.20 |
20.00 |
90 |
77.07 |
77.79 |
-0.93 |
|
16 |
13 |
0.20 |
20.00 |
90 |
78.49 |
77.79 |
0.90 |
|
17 |
11 |
0.20 |
20.00 |
90 |
77.24 |
77.79 |
-0.71 |
a Average (n = 3)
The employing multi regression analysis on the experimental data, the predicted response Y for the yield of glucose can be obtained using the following second-order polynomial equation:
Y = – 344.26 + 585.18A + 22.97B + 2.60C – 1133.90A2 – 0.42B2 – 0.01C2 – 9.70AB + 0.82AC – 0.02BC (1)
When Y is the predicted glucose yield (g/100 g of substrate), while A, B and C are the coded values of H2SO4 concentration, ratio of acid volume to sample and hydrolysis time, respectively. The statistical significance of the model equation was evaluated by F-test for analysis of variance (ANOVA) as shown in Table 4, which showed that the regression was statistically significant. The ‘Prob >F’ value for h model was <0.0001, which indicated that the model was statistically significant with a confidence interval of 99.99%. The Model F value (79.37) implied that the model was significant and there was only a 0.01% chance that a ‘Model F value’ could occur because of noise.
Table 4: ANOVA for response surface quadratic model for glucose yield
|
Source |
Sum of Squares |
Degree of freedom |
Mean Square |
F-Value |
Prob>F |
|
||||||||||
|
Model |
5047.35 |
9 |
560.82 |
79.37 |
< 0.0001 |
Significant |
||||||||||
|
A |
16.71 |
1 |
16.71 |
2.36 |
0.1680* |
|||||||||||
|
B |
1654.89 |
1 |
1654.89 |
234.21 |
< 0.0001 |
|||||||||||
|
C |
259.28 |
1 |
259.28 |
36.70 |
0.0005 |
|||||||||||
|
A2 |
1449.47 |
1 |
1449.47 |
205.14 |
< 0.0001 |
|||||||||||
|
B2 |
1249.02 |
1 |
1249.02 |
176.77 |
< 0.0001 |
|||||||||||
|
C2 |
1720.00 |
1 |
1720.00 |
243.43 |
< 0.0001 |
|||||||||||
|
AB |
188.08 |
1 |
188.08 |
26.62 |
0.0013 |
|||||||||||
|
AC |
47.87 |
1 |
47.87 |
6.78 |
0.0353 |
|||||||||||
|
BC |
88.11 |
1 |
88.11 |
12.47 |
0.0096 |
|||||||||||
|
Residual |
49.46 |
7 |
7.07 |
|||||||||||||
|
Lack of fit |
48.26 |
5 |
9.65 |
16.05 |
0.0597* | |||||||||||
|
Pure error |
1.20 |
2 |
0.60 |
|||||||||||||
|
Core total |
5096.81 |
16 |
||||||||||||||
| Standard deviation |
2.66 |
Adjusted R-squared |
0.9778 |
|||||||||||||
| Mean |
50.30 |
Predicted R-squared |
0.9235 |
|||||||||||||
| Coefficient of variation |
5.28 |
Adeq precision | 26.8130 | |||||||||||||
| R-squared |
0.9903 |
|||||||||||||||
*Prob F value more than 0.05 indicates that the model terms are not significant.
The coefficient of determination (R2) of the model was 0.9903, which the future conditions indicated that this model was suitable for adequately representing the real relationships among the selected reaction variable.
Optimization for H2SO4 Hydrolysis of the Pretreated CR
The fitted regression Eq. (1) was described in mode of the 3D surface plots and corresponding 2D contour plots to illustrate the effects of variables and their interactions on glucose yield (Fig.3).
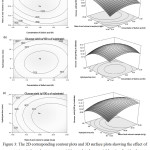 |
Figure 3: The 2D corresponding contour plots and 3D surface plots showing the effect of various independent process variables on the glucose yield: ratio of acid volume to sample and acid concentration (a), acid concentration and hydrolysis time (b), and ratio of acid volume to sample and hydrolysis time (c) Click here to View figure |
Fig. 3a displays the 3D response and contour plots for H2SO4 concentration and acid hydrolysis time on glucose yield. The results displays that glucose yield increases from 66.77% to 73.73% when H2SO4 concentration and hydrolysis time are increased. Then the yield gradually decreases from 73.73% to 52.87% with an increase in acid concentration (from 0.20-0.30 M) and hydrolysis time (from 90-120 min). The trends of decreasing in the glucose yield at too high H2SO4 concentration and long hydrolysis time are due to the occurrence of the decomposition of glucose to furfural (fermentation inhibitors) 13. The maximum glucose yield was obtained at H2SO4 concentration of 0.20 M and hydrolysis time for 90 min. Fig. 3b and 3c illustrates the effect of the interaction between another variable and ratio of acid solution volume to sample. The 3D response and contour plots represent that glucose yield straightly increases as the ratio of acid to sample increases. The maximum glucose yield was achieved using the ratio in the range of 20-25 mL/g with incorporating other variables.
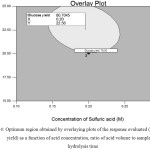 |
Figure 4: Optimum region obtained by overlaying plots of the response evaluated (glucose yield) as a function of acid concentration, ratio of acid volume to sample and hydrolysis time Click here to View figure |
Based on the overlay plots (Fig.4), the optimum hydrolysis variables were found to be at H2SO4 concentration of 0.20 M, ratio of acid volume to sample of 22.56 mL/g and acid hydrolysis time for 90 min. Predict of highest glucose yield was recorded as 80.70 g/100 g of substrate.
All obtained hydrolyzate under optimum conditions at 90 min of hydrolysis time, 0.20 mole per liter of sulfuric acid concentration, and 22.56 milliliter of acid volume per gram of the cassava rhizome pretreated, were studied some components by a HPLC-ELSD/UV detector as presented in Table 5.
Table 5: Components of the hydrolyzate of two-steps pretreated CR obtained under optimum conditions
|
Components |
Concentrations (g/100 g substrate) |
|
Glucose |
80.90 ± 0.011 |
|
Xylose |
19.22 ± 0.026 |
|
Arabinose |
Non-detected |
|
Furfural |
Non-detected |
|
5-Hydroxymethyl furfural (5-HMF) |
0.28 ± 0.004 |
|
Phenolic compounds |
0.07 ± 0.035 |
Table 5 presents the components of the hydrolyzate under optimum conditions. Glucose, xylose, arabinose, furfural and 5-HMF were determined using a HPLC-ELSD. While, total phenolic compounds was analyzed by Folin-Ciocalteu method using a UV-Vis spectrophotometer. The results show that the hydrolysis conditions of hydrolyzate provided with a high concentration of glucose and xylose (80.90 and 19.22 g/100 g substrate, respectively) and low concentration of inhibitor compounds (furfural, 5-HMF, acetic acid and phenolic compounds). Thus, the hydrolyzate under the appropriate conditions is a promising glucose source for bioethanol production by S. cerevisiae TISTR 5339.
Fermentation
The fermentation of all hydrolyzate from optimum conditions by RSM was tested in batch mode. The initial glucose concentration was detected up to 81.62 g of 100 g of substrate. The Fig. 5 exhibits the glucose turned ethanol and described to the growth of yeast cell in the fermented process. Fermentation was followed up for 96 h at 30 oC. The cell population of S. cerevisiae TISTR 5339 was displayed maximum yeast cell during 18 h time (7.15 x 10⁷ cell/mL). At 24 h of incubation, the quantity of ethanol was showed the highest concentration of 10.42 g/L, while, the glucose content was remained of 10.42 g (of 100 g of substrate) in the same period. However, after 12 h, the ethanol concentration was decreased to 3.06 g/L and little changed of ethanol capacity. The occurrence may be caused from the lower glucose could be impact to some of the ethanol production rose oxidized to acetate by microorganism16. Glucose concentration was diminished to near 0 g/L over 72 h of incubation.
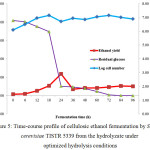 |
Figure 5: Time-course profile of cellulosic ethanol fermentation by S. cerevisiae TISTR 5339 from the hydrolyzate under optimized hydrolysis conditions Click here to View figure |
Moreover, the lignocellulosic substrate type, ethanol yield and productivities calculated from the results in this work and the literature reviews are compared in Table 6. In this study, the hydrolysis of cellulose was performed using dilute H2SO4 further fermented to bioethanol using S. cerevisiae TISTR 5339. It was found that the ethanol yield of 23.50 g/100 g substrate correspond to a theoretical ethanol yield of 64.71 %. When compared with other lignocellulose substrates, the ethanol yield and ethanol productivity in this work was highest than other materials. Therefore, the optimum conditions of H2SO4 hydrolysis derived via RSM were used under low concentration (0.20 M of acid), few inhibitors, low cost and leading to cost reduction for large-scale ethanol production.
Table 6: The composition of ethanol production and productivities evaluated from results in this work with some literature reviews
| Lignocellulosic biomass | Pretreatment method | Hydrolysis process | Fermentation process | EtOH Conc.(g/L) | EtOH yield(g/100 g) | EtOH productivity(g/100g/h) |
Theoretical EtOH yield (%) |
References |
| Rice hulls | H2SO4 dilute solution | Endoglucanases(NS 50013) and Cellobiases(NS 50010) | Batch fermentation byS. cerevisiae |
4.42 |
11.00 |
– |
84.00 |
Dagnino et al.[4] |
| Corncob | NaOH | Cellulase (GC220) | Fed-batch simultaneous saccharification and fermentation by S. cerevisiae |
12.30 |
– |
– |
67.80 |
Zhang et al.[5] |
| Cassava stem | Dilute acid solution | Cellulase complex and b-glucosidase | Batch fermentation byS. cerevisiae CHY 1011 |
7.55 |
7.08 |
0.29 |
89.60 |
Han et al.[7] |
| Cassava stem | Acid-chlorite followed by NaOH | H2SO4 dilute solution | Batch fermentation byS. cerevisiae TISTR 5048 |
13.52 |
22.58 |
0.75 |
84.41 |
Klinpratoomet al.[13] |
| Mission grass | NaOH | Cellulase fromT. reesei ATCC 26921 | Batch fermentation byS. cerevisiae TISTR 5339 |
– |
8.21 |
0.34 |
45.99 |
Prasertwasu et al. [16] |
| Sugarcane leaves | H2SO4 dilute solution | Cellulase(Accellerase TM 1000) | Batch fermentation byS. cerevisiae TISTR 5596 |
4.71 |
8.00 |
0.19 |
94.24 |
Jutakanoke et al. [19] |
| Cassava rhizome | Acid-chlorite followed by NaOH | H2SO4 dilute solution | Batch fermentation byS. cerevisiae TISTR 5339 |
10.42 |
23.50 |
0.97 |
64.71 |
This work |
Conclusions
CR is a potential lignocellulosic biomass for the production of bioethanol. After two-steps pretreatment, cellulose content was increased 70.5% from 48.2% of raw material when analyzed by NREL. Utilization of RSM for study optimum condition of acid hydrolysis could be used reducing step, decreases quality of reagents for testing and short time hydrolysis. In fermentation by S. cerevisiae TISTR 5339 used, the highest ethanol yield of 10.42 g/L was achieved within 24 h. Therefore, CR is a new alternative source of initial substrate for the production of ethanol in bioethanol industry.
Acknowledgements
The authors would like to thank Department of Chemistry, Faculty of Science, Khon Kaen University, Khon Kaen, Thailand, for all supporting facilities. The National Research University Project of Thailand, Biofuel Cluster, Khon Kaen University, Khon Kaen, Thailand, is also gratefully acknowledged for financial support and some chemicals.
References
- Jeya, M.; Zhang, Y. W.; Kim, I. W.; Lee, J. K. Bioresour. Technol., 2015, 100, 5155-5161.
CrossRef - Sornkade, P.; Atong, D.; Sricharoenchaikul, V. Renew. Ener., 2015, 79, 38-44.
CrossRef - Pattiya, A. Bioresour. Technol. 2011, 102, 1959-1967.
CrossRef - Dagnino, E. P.; Chamorro, E. R.; Romano, S. D.; Felissia, F. E.; Area, M. C. Ind. Crop. Prod., 2013, 42, 363-368.
CrossRef - Zhang, M.; Wang, F.; Su, R.; Qi, W.; He, Z. Bioresour. Technol., 2010, 101, 4959-4964.
CrossRef - Chen, W. H.; Ye, S. C.; Sheen, H. K. Appl. Energy, 2012, 93, 237-244.
CrossRef - Han, M.; Kim, Y.; Kim, Y.; Chung, B.; Choi, G. W. Korean J. Chem. Eng., 2011, 28(1), 119-125.
CrossRef - Sornkade, P.; Atong, D.; Sricharoenchaikul, V. Energy Proc., 2013, 34, 273-281.
CrossRef - Szczodrak, J.; Fiedurek, J. Biomass Bioenergy., 1996, 10, 367-375.
CrossRef - Li, M.F.; Fan, Y. M.; Xu, F.; Sun, R. C.; Zhang, X. L. Ind. Crop. Prod., 2010, 32, 551-559.
CrossRef - Liu, H. M.; Feng, B.; Sun, R. C. J. Agric. Food Chem., 2011, 59, 10524-10531.
CrossRef - Lima, C. S.S.; Conceicao, M. M.; Silva, F. L. H.; Lima, E. E.; Conrado, L. S.; Leao, D. A.S. Appl. Energy., 2012, 102, 254-259.
CrossRef - Klinpratoom, B.; Ontanee, A.; Ruangviriyachai, C. Korean J. Chem. Eng., 2015, 32(3), 413-423.
CrossRef - Ziegenhorn, J.; Neumann, U.; Hagen, A.; Bablok, W.; Stinshoff, K. J. Clin. Chem. Clin. Biochem., 1977, 15, 13-19.
- Binod, P.; Kuttiraja, M.; Archana, M.; Jana, K. U.; Sindhu, R.; Sukumaran, R. K.; Pandey, A. Fuel, 2012, 92, 340-345.
CrossRef - Prasertwasu, S.; Khumsupan, D.; Komolwanich, T.; Chaisuwan, T.; Luengnaruemitchai, A.; Wongkasemjit, S. Bioresour. Technol., 2014, 163, 152-159.
CrossRef - Hubbell, C.A.; Ragauskas, A.J. Bioresour. Technol., 2010, 101, 7410-7415.
CrossRef - Qi, B.; Chen, X.; Shen, F.; Su, Y.; Wan, Y. Ind. Eng. Chem. Res., 2009, 48, 7346-7353.
CrossRef - Jutakanoke, R.; Leepipatpiboon, N.; Tolieng, V.; Kitpreechavanich, V.; Srinorakutara, T.; Akaracharnya, A. Biomass Bioenerg., 2012, 39, 283-289.
CrossRef - Sluiter, A.; Hames, B.; Ruiz, R.; Scarlata, C.; Sluiter, J. National Renewable Energy Laboratory Technical Report NREL/TP-510-42622. 2008, 9, 1-6.


![]()


