Liquid Ion Exchange Application for Micro Amount Separation and Determination of Ca(II) and Mg(II) as Anions Species with EDTA
Shawket Kadhim Jawad1, Safa Majeed Hameed1 and Sahar Aqeel Hussain2
1Chemistry Department, Faculty of Education for Women, Kufa University, Al-Najaf-31001, Iraq.
2Pharmaceutical Chemistry department - Faculty of Pharmacy, Al-Najaf-31001, Iraq.
Corresponding Author E-mail: Shawkat.alshakarchi@uokufa.edu.iq
DOI : http://dx.doi.org/10.13005/ojc/330535
Extracted Mg(II) and Ca(II) each one alone after combined with EDTA (H3Y-) as (MgHY-) and (CaHY-) after preparing ion pair complexes according to liquid ion exchange method by using Cinchonine (CK) after changing to liquid ion exchanger HCK+;Cl- in HCl medium, spectrophotometric studies showed that the ion pair magnesium complex HCK+;MgHY- had a wave length for maximum absorbance of λmax=241nm, but the maximum absorbance for calcium HCK+;CaHY- was λmax=278nm to determine the remaining quantity of Mg(II), the Eriochrome black T method was used, but for Ca(II) the crown ether DB18C6 method was used as new spectrophotometric method. Limitations to the study include optimum conditions for extraction ions in this study show a need for 1M HCl for Mg(II) and 0.8M HCl for Ca(II), to be present 100µg for each ion, 0.08M EDTA for Mg(II) and 1.0M EDTA for Ca(II), 1×10⁻⁴M CK, after shaking for 10min. Thermodynamic study shows ΔHex=0.058kJmol-1, ΔGex =-47.28 kJmol-1, ΔSex=158.86J.mol-1. K-1 for Mg(II) and for Ca(II) was ΔHex=0.0892kJmol-1, ΔGex=-54.66 kJmol-1, ΔSex=180.69J.mol-1.K-1.
KEYWORDS:Calcium; Magnesium; EDTA; Cinchonine; Liquid Ion Exchange; Solvent extraction
Download this article as:| Copy the following to cite this article: Jawad S. K, Hameed S. M, Hussain S. A. Liquid Ion Exchange Application for Micro Amount Separation and Determination of Ca(II) and Mg(II) as Anions Species with EDTA. Orient J Chem 2017;33(5). |
| Copy the following to cite this URL: Jawad S. K, Hameed S. M, Hussain S. A. Liquid Ion Exchange Application for Micro Amount Separation and Determination of Ca(II) and Mg(II) as Anions Species with EDTA. Orient J Chem 2017;33(5). Available from: http://www.orientjchem.org/?p=38565 |
Introduction
Cloud point extraction method has been applied for Mg2+ ions extraction. The extracted solvated species have λmax=249nm. The study includes the determination of all optimum conditions for extraction, as well as the determination of Mg2+ ions in different samples[1]. Extraction of 45Ca(II) was performed into toluene solutions of HTTA, HDEHP, HTTA+TBP and HDEHP+ BP. Thermodynamic parameters are used to explain no change in the coordination number of Ca(II)[2]. Cloud point extraction method was used for separation of Mg(II) as anion with oxine. The method involved formation of an ion pair complex between Rhodamin–B and oxine anion complex of magnesium [Mg(OX)з‾] in basic media, in presence of Triton X-100[3]. 1-(2- Pyridyl azo)-4-Benzene naphthol was used as reagent for determination of Mg(II) in different environmental and vital samples, after Mg(II) conversion to anion complex with oxine, as well as micro amount determination of Magnesium(II) in different samples [4]. The extraction of Ca(II) and Mg(II) with N, N-dioctyl-1-octan ammonium chloride from the mixture of elements (Ca and Mg) was prepared in a synthetic manner. The effects of HCl and NaCl, NaI and CH3 COONa concentration in extraction of Ca and Mg from water solutions were studied. All extractions were done from HCl solutions in the presence of NaCl, NaI and CH3COONa salts [5]. The distribution of alkaline earth cations between CCl4 and aqueous sodium perchlorate solutions has been studied by thenoyl trifluoro acetone and adduct forming ligand trioctylphosohlne oxide. The separation of alkaline earth cations is explained by solvent extraction with H+ ion in aqueous solutions. The selectivity in the order is, Mg2+ > Ca2+> Sr2+> Ba2+ [6].
Experimental Methods
Apparatus
The spectrophotometric measurements were carried out by using a double beam UV-Vis. spectrophotometer, (Biochrom Libra S60) (UK), and for shaking the solutions a HY-4 vibrator with AD at just about multiple speed was used (Italy). Electrical balance was used for the weight substance (A & D company, Limited, Dool, CE, HR 200), (Japan). The pH was measured by using a pH-meter, WTW (Germany). For regular temperature, a water bath (galvanothermy thermostatic bath) (Germany) was used.
Materials and Solutions
All chemicals used in experiments came from reliable commercial companies and were used without farther purification, all solutions were prepared by using a suitable volumetric flask with distilled water stock solution of Mg(II) and Ca(II) at concentrations of 1000ppm prepared by dissolving (0.0392g) of MgCl2 (Merck) and (0.0275g) of CaCl2 (Merck) respectively in 10mL distilled water, so that 0.1M EDTA was prepared by dissolving (3.7224g) of Na2EDTA (B.D.H) in 100mL distilled water, Cinchonine ((S)-[(2R,4S,5R)-5-ethenyl-1-azabicyclo[2.2.2]octan-2-yl]-quinolin-4-ylmethanol) (Fluka) solution 1×10⁻² M was prepared by dissolving (0.0294g) in 100mL chloroform. The DB18C6 solution 1×10⁻² M was prepared by dissolving (0.0360g) in 10mL chloroform. Where applicable, all the other working solutions were prepared by dilution with solvents in a suitable volumetric flask.
Fundamental Method
5mL of aqueous solution contained 100µg Mg2+ or Ca2+ each, with 0.08M EDTA at pH=3 and these solutions were shaken for 5min.
5mL of Cinchonine solution was dissolved in chloroform at 1×10⁻⁴M and then shaken for 5minutes with 5mL of 0.5M HCl, afterward the organic solution was separated from the aqueous solution.
Afterward adding organic solution in second step to the aqueous solution at first step and then these two layers were shaken for 15min., and later the organic phase was separated from the aqueous phase, then the absorbance of the organic phase was measured at λmax=241nm for the ion pair complex of Mg2+ and at λmax=278nm for the ion pair complex of Ca2+.
The aqueous solution of extracted Mg2+ was treated according to the Eriochrom black T [7] spectroscopic method for determining the remaining quantity of Mg2+ in the aqueous phase after extraction by returning to a calibration curve in Figure (1), so this quantity was subtracted from the original quantity of Mg2+ ions in the aqueous phase to determine the transfer quantity of metal cation afterward calculate D values for extraction.
For determining the Ca2+ ions in the aqueous solution after extraction, the new method was used as detailed below:
5mL of aqueous solution contains the remaining quantity of Ca2+ ion, which keeps the pH of the solution at pH=9 then 5mL of crown ether, DB18C6, dissolved in chloroform was added to make it1×10-4 M, then the two layers were shaken for 10minutes. Next, the organic phase was separated from the aqueous phase and the absorbance of the organic phase was measured at λmax=283nm against the DB18C6 solution as blank solution. This was limited through spectroscopic study.
Results and Discussion
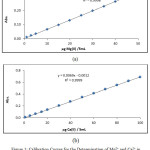 |
Figure 1: Calibration Curves for the Determination of Mg2+ and Ca2+ in the Aqueous Phase a/ According to Eriochrom Black T Methods for Mg2+ b/ DB18C6 Crown Ether Method for Ca2+ Click here to View figure |
Spectroscopic Studies
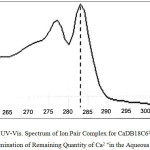 |
Figure 2: UV-Vis. Spectrum of Ion Pair Complex for CaDB18C62+;2Cl– for Determination of Remaining Quantity of Ca2+ in the Aqueous Phase. Click here to View figure |
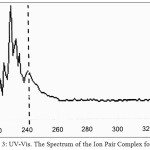 |
Figure 3: UV-Vis. The Spectrum of the Ion Pair Complex for Mg2+ Click here to View figure |
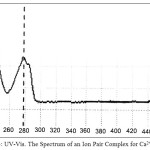 |
Figure 4: UV-Vis. The Spectrum of an Ion Pair Complex for Ca2+ Click here to View figure |
The spectrophotometric study shows wavelength for maximum absorbance was λmax=283nm for spectrophotometric determined of Ca2+ in aqueous solution by DB18C6 method, so that for extracted complexes were λmax=241nm for Mg(II), λmax=278nm for Ca(II).
Effects of HCl Concentration
The Mg2+ and Ca2+ was extracted according to the fundamental method after a 5mL solution of 1×10⁻⁴ M Cinchonine dissolved in chloroform was shaken with 5mL of aqueous solutions of different concentrations of HCl, the results were as in Figures (5 and 6):
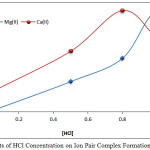 |
Figure 5: Effects of HCl Concentration on Ion Pair Complex Formation and Stability. Click here to View figure |
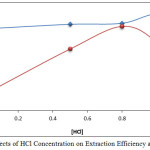 |
Figure 6: Effects of HCl Concentration on Extraction Efficiency and D Values. Click here to View figure |
The results show 1M HCl was the optimum concentration for extraction of Mg2+ ions, but for extraction of Ca2+ ions, 0.8M HCl was necessary at these concentrations to reach a favorable equilibrium to form an ion exchanger that appears more suitable for an equalized ion exchange between Cl– and MHY– to offer maximum concentration and more stable ion pair extraction. Any concentration of HCl less than optimum values prevented the solution from reaching thermodynamic equilibrium and minimized extraction efficiency, so that concentration more than optimum concentration effects was required to increase backward direction and dissociation of the ion exchanger. In addition, increasing the Cl– concentration in the solutions appeared to affect steric to metal ion for preparing complex with EDTA [8].
Effects of Metal Ion Concentration
5mL aqueous solutions contained different quantities of Mg2+ or Ca2+ with 0.08M of EDTA at pH=3 after these solutions were shaken for 5min. Another 5mL of Cinchonine was shaken for 5min. with 5mL of 1M HCl for Mg2+ and 0.8M HCl for Ca2+, then the organic phase containing the ion exchanger was separated, and then the solution of Cinchonine was added to the solutions of metal cation with EDTA which were shaken for 10min, and then completed using the fundamental method, the results are show in Figures 7 and 8:
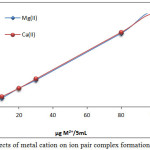 |
Figure 7: Effects of metal cation on ion pair complex formation and stability Click here to View figure |
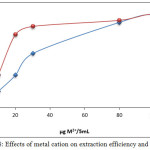 |
Figure 8: Effects of metal cation on extraction efficiency and D values Click here to View figure |
The results show that 100µg Mg2+ and Ca2+ was the optimum concentration of metal cation, allowing higher absorbance and D value, undoubtedly this concentration created the appropriate equilibrium, a concentration less than optimum would not be suitable to reach favorable thermodynamic equilibrium of ion pair formation, so an increase in metal cation causes a reduction in extraction efficiency, because it indicated an increase in backward direction of equilibrium and dissociation according to mass action law [9].
Effects of EDTA Concentration
According to the fundamental method, Mg2+ and Ca2+ were extracted at optimum conditions in the presence of different concentrations of EDTA; the results are shown in Figures 9 and 10:
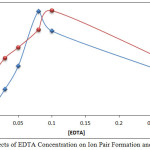 |
Figure 9: Effects of EDTA Concentration on Ion Pair Formation and Absorbance Click here to View figure |
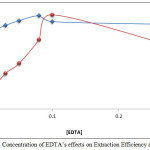 |
Figure 10: Concentration of EDTA’s effects on Extraction Efficiency and D Values Click here to View figure |
From the results, it appears that 0.08M, 0.10M EDTA was the optimum concentration for extraction of Mg2+ and Ca2+ respectively, because at these concentrations, they reached the ideal thermodynamic equilibrium to form anion complex species MgHY– and CaHY–. Any concentration less than optimum is not suitable for forming sufficient concentration and stability of the anion complexes with EDTA, which also minimizes absorbance and D values. Concentrations more than optimum cause a deviation in extraction by increasing backward direction of equilibrium and dissociation according to mass action law [9].
Shaking Time Effect
According to fundamental method, Mg2+ and Ca2+ were extracted at optimum conditions for each ion at different shaking times. The results are shown in Figures 11 and 12:
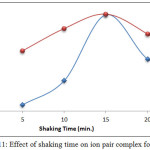 |
Figure 11: Effect of shaking time on ion pair complex formation Click here to View figure |
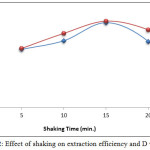 |
Figure 12: Effect of shaking on extraction efficiency and D values Click here to View figure |
The results demonstrate that10min. was the optimum shaking time for both metal cations, as well as being the optimum time for favorable thermodynamic equilibrium for formation and extraction of high concentrations of ion pairs with high stability. Shaking time represents kinetic energy for transitioning the species to the organic phase [9, 10].
Structure of Extracted Species
According to fundamental method, extracted metal cation can be studied by using different concentrations of Cinchonine dissolved in chloroform. The distribution ratio (D) of extraction was calculated. The results are shown in Figure 11:
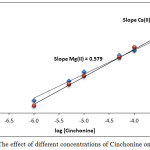 |
Figure 13: The effect of different concentrations of Cinchonine on D values. Click here to View figure |
This procedure, which is known as the slope analysis method, found that the slope value is equal to 0.579 for Mg2+ and 0.663 for Ca2+.
The second procedure for detecting the structure of extracted species was the slope ratio method, which included extracted metal ion under study with different concentrations of Cinchonine, and another procedure for extracting different concentrations of different cations with fixed concentration of Cinchonine; the results are shown in Figures 14-17:
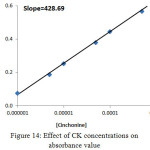 |
Figure 14: Effect of CK concentrations on absorbance value Click here to View figure |
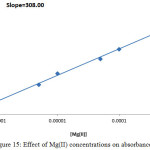 |
Figure 15: Effect of Mg(II) concentrations on absorbance value Click here to View figure |
The slope ratio value for Mg2+ was 1.392
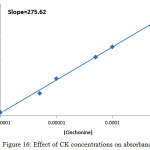 |
Figure 16: Effect of CK concentrations on absorbance value Click here to View figure |
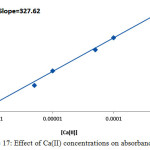 |
Figure 17: Effect of Ca(II) concentrations on absorbance value Click here to View figure |
But for Ca2+ it was 0.841
From the values of slope analysis and slope ratio methods, it was demonstrated that the ion pair association complex extracted was CK+;[Mg(EDTA)]– and CK+;[Ca(EDTA)]– [8,11].
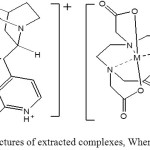 |
Scheme 1: More probable structures of extracted complexes, Where M= Mg2+ or Ca2+ Click here to View scheme |
Percentage of Methanol Effect
Mg2+ and Ca2+ were extracted according to the fundamental method in presence of different percentages of methanol in aqueous solutions; the results are shown in Figures 18 and19:
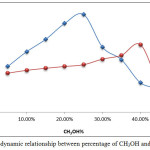 |
Figure 18: Thermodynamic relationship between percentage of CH3OH and ion pair formation Click here to View figure |
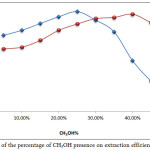 |
Figure 19: Effects of the percentage of CH3OH presence on extraction efficiency and D values. Click here to View figure |
The results show th at 25% CH3OH is suitable for Mg2+ extraction and 40% CH3OH is suitable for Ca2+, as well as the presence of CH3OH enhancing the extraction efficiency. But once the optimum values for absorbance and D values were reached, the presence of CH3OH in aqueous solution caused a decline in dielectric constant and polarity of aqueous solution, which means it destroyed the hydration shell of metal cation and helped to increase binding with EDTA to prepare anion complex, as well as increase the transfer to the organic phase to form the ion pair association complex with higher concentration and stability. Any percentage of CH3OH less than the optimum values appear to cause a decline in extraction efficiency by decreasing the effectiveness. Also when the CH3OH% percentage is higher than the optimum level, it causes a decrease in extraction efficiency also because it leads to a decrease in polarity and dielectric constancy of the aqueous solution, which causes it to transfer some of the Cinchonine (CK) to the aqueous phase so that there is a decrease in the concentration of the ion pair complex extracted to the organic phase [12,13].
Interferences Effects
Metal cations under study were extracted according to the fundamental method at optimum conditions and in the presence of different interferences. The results obtained are shown in Table 1:
Table 1: Interferences effect
|
Interferences |
Mg2+ |
Ca2+ |
||||
|
Abs. at λmax=241nm |
D |
%E |
Abs. at λmax=278nm |
D |
%E |
|
|
Ba2+ |
0.341 |
29.30 |
96.69 |
0.396 |
30.25 |
96.80 |
|
Sr2+ |
0.218 |
16.24 |
94.19 |
0.366 |
25.32 |
96.70 |
|
Zn2+ |
0.233 |
19.83 |
95.19 |
0.345 |
22.26 |
95.70 |
|
Ni2+ |
0.311 |
22.81 |
95.80 |
0.302 |
16.86 |
94.40 |
|
Cd2+ |
0.345 |
25.32 |
96.20 |
0.268 |
10.24 |
91.10 |
The results show that all foreign ions have a range of interferences with metal cation of Mg2+ and Ca2+ through formation of the ion pair complexes with EDTA and Cinchonine. These interferences cause the concentration of H3Y– and Cinchonine to decrease to less than optimum values for extraction of Mg2+ and Ca2+ which appear to cause a decrease in extraction efficiency of the metal cations [14].
Variation of Temperature
Extractions of Mg2+ and Ca2+ were completed from aqueous solutions according to the procedure detailed in the fundamental method; just at different temperatures. The results appear to increase absorbance and D values along with increasing temperatures to the optimum of 25°C for Mg2+ and the optimum of 35°C for Ca2+, as in Figure 20 and 21:
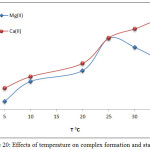 |
Figure 20: Effects of temperature on complex formation and stability. Click here to View figure |
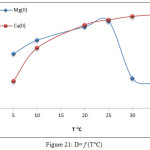 |
Figure 21: D= f (T°C) Click here to View figure |
Then calculations were done for the extraction constant Kex by relation below [8,9]:
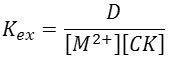
Where M2+= Mg2+ or Ca2+
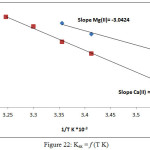 |
Figure 22: Kex = f (T K) Click here to View figure |
Afterward plotted log Kex vis 1/T K giving straight line relation as in Figure (22) from the slope of this straight line and application thermodynamic relations[15] determined thermodynamic data as in Table 2:

Table 2: Thermodynamic data for extraction Mg2+ and Ca2+
|
Metals |
ΔHex (KJmol-1) |
ΔGex (KJmol-1) |
ΔSex (Jmol-1K-1) |
|
Mg2+ |
0.058 |
-47.28 |
158.86 |
|
Ca2+ |
0.0892 |
-54.66 |
180.69 |
The results show a small value of ΔHex for both ions, which reflect the increased approach of ions in ion pair association complexes extracted which add high stability to the complexes, and it is important to note the large value of ΔSex which demonstrated dependence of the extraction method on entropy to formation and extraction ion pair association complex which means the method is entropic in region [8,9].
Organic Solvent Effect
Extraction of Mg2+ and Ca2+ from aqueous solutions was done according to the procedure detailed in the fundamental method by using different organic solvents to dissolve the organic reagent Cinchonine was the extractant. The results are shown in Table 3:
Table 3: Organic solvent effect
|
Organic Solvent |
∈r |
Mg2+ |
|
Ca2+ |
||||||
|
λmax |
Abs. |
D |
%E |
λmax |
Abs. |
D |
%E |
|||
|
Nitrobenzene |
35.74 |
362 |
0.350 |
19.00 |
95.00 |
322 |
0.378 |
28.41 |
96.60 |
|
|
1,2-Dichloro ethane |
10.65 |
310 |
0.215 |
6.14 |
85.99 |
285 |
0.512 |
75.92 |
98.70 |
|
|
Chloroform |
4.806 |
241 |
0.444 |
32.33 |
97.00 |
278 |
0.447 |
39.00 |
97.50 |
|
|
Toluene |
2.438 |
303 |
0.118 |
4.71 |
82.49 |
294 |
0.221 |
16.86 |
94.40 |
|
The results show there is not any linear relationship between dielectric constants of solvents used and D values, which means there is not any effect of polarity of organic solvents on the extraction efficiency, but it demonstrates that there is an effect on the structure of organic solvents in the formation of ion association complexes through the formation contact ion pair or solvent separated ion pairs [16].
Variation of Extractants
By using different extractants with the procedures detailed in the fundamental method for extraction of Mg2+ and Ca2+ in optimum conditions, the results are shown in Table 4:
Table 4: Extractant kind effect
|
Organic reagent |
Mg2+ |
Ca2+ |
||||||
|
λmax |
Abs. |
D |
%E |
λmax |
Abs. |
D |
%E |
|
|
Cinchonine |
241 |
0.444 |
32.33 |
97.00 |
278 |
0.447 |
39.00 |
97.50 |
|
*PAN |
495 |
0.374 |
19.83 |
95.19 |
496 |
0.332 |
22.814 |
95.80 |
|
Brilliant green |
582 |
0.316 |
22.81 |
95.80 |
411 |
0.385 |
27.57 |
96.50 |
*PAN= 1-(2-Pyridyl azo)-2- Naphthol
The results demonstrate differences in the extraction efficiency when different extractants are used; this overshadowed the nature and behavior of the organic reagent to form the ion pair association complex in addition to the conclusion that each organic reagent needs optimum conditions for extraction [17].
Spectrophotometric Determination
In order to determine the Mg2+ and Ca2+ in different samples, prepared calibration curves are created such as in Figures (23 and 24):
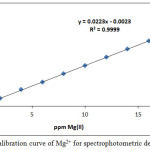 |
Figure 23: Calibration curve of Mg2+ for spectrophotometric determination. Click here to View figure |
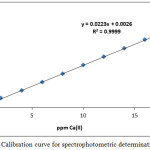 |
Figure 24: Calibration curve for spectrophotometric determination of Ca2+. Click here to View figure |
Table 5: Parameters for the determination of PbCl3– or PbCl4= via liquid ion exchange method.
|
Parameter |
Mg(II) |
Ca(II) |
|
RSD% (n=3) |
0.7207 |
0.7715 |
|
Molar absorptivity (L.mol-1.cm-1) |
785.8746923 |
1378.114133 |
|
Sandell’s sensitivity |
3.0539×10⁻⁸ |
2.9025×10⁻⁸ |
|
Limit of Detection(µgmL-1) |
1.8017×10⁻⁵ |
1.15728×10⁻⁵ |
References
- Jawad, S.K.; Haider, F.H.; J. O. European Chemical Bulletin. 2015, 4(7-9), 360-363.
- Shanbhag, P. M.; Choppin, G. R.; J. O. Journal of Inorganic and Nuclear Chemistry. 1979, 41(7), 1033-1035.
CrossRef - Jawad, S.K.; Azooz, E. A.; J. O. Research in Applied, Natural and Social Sciences. 2015. 1(2), 119-134.
- Jawad, S.K.; AL-Ghurabi, F. A.W.; J. O. Babylon University/Pure and Applied Sciences. 2013, 21(2): 480-490.
- Faiku, F.; Haziri, A.; Haziri, I.; Aliu, S.; Sopa, N.; J. O. American Journal of Applied Sciences. 2012, 9(7): 1145.
- Komatsu, Y.; Fujiki, Y.; Michiue, Y.; Yajima, Y.; Sasaki, T.; J. O. Solvent Extraction and Ion Exchange. 1991, 9(3): 471-479.
CrossRef - Marezenko, Z.; Balcerzak, M.; Separation, Preconcentration and Spectrophotometry in Inorganic Analysis. ELSEVIER SCIENCE B.V. 1st ed, 2000.
- Jawad, S.K.; MSC Thesis. Education Collage Ibn Al-Haitham-Baghdad University. 1989.
- Jawad, S.K.; Ph.D. Thesis, Education Collage Ibn Al-Haitham- Baghdad University. 1996.
- Jalhoom, M. G.; Ph.D. Thesis, Istitute of Nuclear Research Warsaw, Poland. 1976.
- Jawad, S.K.; J. O. Babylon for pure and applied science. 2005, 10(3), 40-49.
- Bagal, M. R.; Shaikh, U. P.; Dhokte, A. O.; Lande, M. K.; Arbad, B. R.; J.O. Archives of Applied Science Research. 2013, 5(5), 131-137.
- Jawad, S.K.; Yassin, M.A.; J. O. BEST: Journal of Humanities, Arts, Medicine and Sciences. 2016, 2(2), 15-26.
- Jawad, S.K.; Abed, A. S.; J. O. Natural Sciences Research. 2015, 5(7), 39-51.
- Atkins, P.; Paula, J. de.; Physical Chemistry. 9th ed. Great Britain: Oxford University Press. 2010.
- Hamza, A. I.; M.Sc. Thesis, College of Education for Girls-Kufa University. 2011.
- Jawad, S.K.; Muslim, J.R.; J. O. Research in Applied, Natural and Social Sciences. 2015, 1(2), 97-110.

This work is licensed under a Creative Commons Attribution 4.0 International License.
![]()
A New Edition of Web of Science
Journal Impact Factor
2022: 0.5
Five Year: 0.8
Journal is Indexed in

Cabells Whitelist
![]()


