Use of Analytical Techniques for the Identification of the Geopolymer Reactions
M. Sivasakthi1, R. Jeyalakshmi1, N. P. Rajamane2 and T. Revathi1
1Department of Chemistry, SRMU, Chennai, Tamil Nadu, India.
2CACR, SRMU, Chennai, Tamil Nadu, India.
Corresponding Author E-mail: sivasakthi.msc09@gmail.com
DOI : http://dx.doi.org/10.13005/ojc/330461
Geopolymers are systems of inorganic binders that can be used as eco-friendly sustainable binder alternate to Portland cement and thereby causing significant reduction of Green house gas emission in construction activities. Geopolymer is often produced by the reaction of alumino-Silicate precursor with alkaline solutions. Geopolymer has shown many excellent properties such as high early strength, good resistance against acid and sulfate attacks, and goo performance in high temperature. The key mechanical strength giving components of geopolymeric binders are chemically complex and of multiphase nature since most of the precursor materials used are also structurally disordered, being either glassy or thermally disrupted layer structure. Hence, geopolymers pose the most significant outstanding problem of micro structural characterization. In the present study, industrial by products such as fly ash and GGBS are used as geopolymeric precursor materials and activated by combined solution ofsodium silicate.The reactivity of fly ash , GGBS, development of strength and structure of Geopolymer under optimized reaction conditions were examined using different techniques such as X-Ray Fluorescence, X-Ray Diffraction, Scanning Electron Microscopy, 29Si and 27Al MAS -NMR spectroscopy and FT-IR Spectroscopy. The thermal stability of Geopolymer formed studied through thermal analysis TGA/DTA. The average mass loss was found to be of 8% after 180 C upto maximum of 1000 C exposure which was significantly lower than Metakaoline based Geopolymer reported in literature.
KEYWORDS:Geopolymer; Fly ash; FT-IR; 29Si and 27Al MAS-NMR; XRD
Download this article as:| Copy the following to cite this article: Sivasakthi M, Jeyalakshmi R, Rajamane N. P, Revathi T. Use of Analytical Techniques for the Identification of the Geopolymer Reactions. Orient J Chem 2017;33(4). |
| Copy the following to cite this URL: Sivasakthi M, Jeyalakshmi R, Rajamane N. P, Revathi T. Use of Analytical Techniques for the Identification of the Geopolymer Reactions. Orient J Chem 2017;33(4). Available from: http://www.orientjchem.org/?p=34666 |
Introduction
Geopolymer is an alumino-silicate inorganic polymer, developed by Prof Davidovits in 1970’s but probably but more appropriately referred as inorganic polymers [1-3]. During the last decade, considerable researches have been directed towards the development of geopolymer due to the wide range of applications for these materials. Geopolymers are formed by alkali activation of solid aluminosilicate materials usually fly ash (FA), or Metakaolin (MK), rice husk, while alkali hydroxides and /or alkali silicate generally used as alkali activators. The main product of the is highly cross – linked 3D polymeric network chain or ring structure consisting of -Si-O-Al-O- (sialate) bonds of Geopolymer and the binding action is in form of Amorphous alumino silicate gel. Several reports can be found in the literature on the synthesis, properties and applications. [4-6].
Since fly ash represents industrial waste, can be found to all over the world and its employment in construction industry is still being a matter of numerous investigations, particularly in the Geopolymer synthesis [7-9]. Despite the fact that research in utilization of secondary source materials such as FA and GGBS in geopolymer research area is intense but FA based geopolymers are still far from practical applications on a large scale. One of the main reasons is the variability of FA composition, which differs from source to source even within the same source. The most important factors which influence in the FA-based Geopolymer performance are characteristics of precursor particle size distribution, content of glassy phase, reactive silicon and aluminium, presence of iron, calcium as well as nature and concentration of activators and reaction conditions [10]. If activation of FA performed by alkali hydroxide, a gel rich in aluminium formed whereas high ordered silicate species in sodium silicate activator resulted the formation silicon rich gel instead aluminiun-rich. Similarly, reaction conditions such as curing temperature in the range 75-95ºC, reaction time (24-48h), relative humidity, amount of soluble reactive component in terms of Si/Al over time are changing the properties of geopolymers. So far there is no simple methodology or analytical tool for assessing precursor reactivity, controlling factor for the phase development to link geopolymersiation reaction and thereby mechanical performance characteristics of Geopolymer.In the present study, chemical, mineralogical and microstructure of FA, GGBS based Geopolymer characteristics using NMR, FTIR, TGA/DTA and microscopic techniques have been investigated and the observations are presented.
Materials and Methods
Class F Fly Ash sample from Thermal Power Plant, Ennore, India , GGBS from Jindal steel plant were used as main aluminium and silicate source for synthesizing geopolymer binder. Alkali activator solution used in the study was the combination of sodium silicate solution (Si/Al 2.2., 15% Na2O, 33% SiO2 and 52% H2O) and lye (50% NaOH). Physical properties of fly ash and GGBS are given in Table1.
Synthesis of Geopolymer
The synthesis of geopolymer mortar was prepared according to the previously optimized procedure using FA and GGBS with liquid/binder ratio 0.45[1] the cylindrical specimens of size 50 mm x100 mm were casted and cured at different temperature. The 3,7 &28 days compressive strength of mortars have been computed.
Characterization of Source Material and Geopolymer
Chemical compositions of FA and GGBS were determined by means of Energy Dispersive X-Ray Fluorescence spectroscopy (EDXRF). (Bruker) showed in Table 1.0. X-Ray diffraction (XRD) [Phillips pW 1710” (Cu Kα = 1.54178. pattern are shown in Fig 1.0. Micro structural characterization carried out by Scanning Electron Microscopy and FT-IR by KBr pellet technique. [Perkin Elmer]. The magic angle spinning MAS-NMR were measured in 300 MHz solid state NMR instrument using a Bruker 7mm probe tuned to 79.46 MHz for silicon and 104 MHz or alumina. The standard used for 29Si NMR is TMS, for 27Al NMR Aluminium Nitrate. The Simultaneous Thermal Analysis (STA) [ NETSCH 2500 Regulus] was used to study the thermal stability in the temperature range 30-1100ºC in floating air/Nitrogen with the heating rate of 10ºC/min.
The glassy phase content of fly ash was determined by dissolving fly ash in HF(1%) acid –Arjunan’s method. 1 gram of FA dissolved in 100 ml of 1% HF with constant stirring for 6 hrs. Dried samples (110ºC) were weighed and the content of glassy phase was determined by weight loss. HF dissolves the glassy phase of fly ash, while crystalline phases (usually qurartz, mullite, haematite and magnetite) remains intact.
Results and Discussion
The X-Ray diffraction pattern analysis of the FA and GGBS precursors as shown in Figure 1a.b indicative the typical crystalline phases of FA such as: quartz (PDF#46-1045), mullite (PDF#85-1460) and hematite (PDF#88-2359)[3] The amorphous phase of GGBS has shown broad spectrum in the range of 2theta 20-40o . In Flyash, total quantity of SiO2 was found to be 48% wherein amorphous content was 35%. The SEM images FA and GGBS are shown in the Figure 2 &3. The majority of the fly ash particles are spherical in nature having different sizes. Although usually hollow still, some of these spheres may contain other particles of smaller size in their interiors. The presence of amorphous phase of GGBS were clearly seen in SEM picture
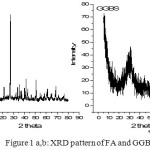 |
Figure 1: XRD pattern of FA and GGBS |
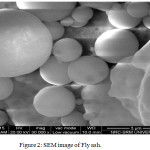 |
Figure 2: SEM image of Fly ash. |
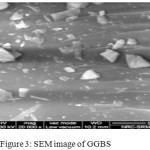 |
Figure 3: SEM image of GGBS Click here to View figure |
Table 1: chemical composition of FA and GGBS
|
Component |
Ennore FA |
GGBS |
|
SiO2 (%) |
47.55 |
21.58 |
|
Al2O3 (%) |
33.45 |
14.88 |
|
Fe2O3 (%) |
10.17 |
1.78 |
|
CaO(%) |
2.099 |
55.25 |
|
K2O(%) |
1.65 |
0.48 |
|
MgO(%) |
0.05 |
2.63 |
|
Na2O(%) |
0.015 |
0.015 |
Mechanical Strength of Geopolymers (GP100 :100% Fly Ash & GP50: 50% Fly Ash & 50% GGBS)
The mechanical strengths at different curing time and temperature for the synthesized geopolymeric mixes FA-GP (GP100) FA-GGBS –GP (GP50) with the mix proportions as Na2O /Al2O3: 0.43, SiO2/Al2O3:05, H2O//Na2O :3.35(Table 3.) Mechanical strength for FA based GP at hot curing conditions showed improved strength at longer age (28 days) whereas room temperature curing of Geopolymer having 50% GGBS resulting 56 MPa. The insoluble residues were found to be low after geopolymersiation process in both the mixes. It implies that amorphous content in precursors are involving in geopolymerisation reactions to form network structure. [14-16]
Table 2: Compressive strength data
|
Mix |
Curing regime |
Compressive Strength(MPa) |
||
|
|
3 D |
14 D |
28 D |
|
|
GP50 |
RT |
26 |
53 |
67 |
|
GP100 |
80ºC, 24 h |
4 |
10 |
18 |
Microstructure of Geopolymers
Ft Ir Analysis
Fig 4 depicts the FT-IR spectrum of precursor and Geopolymer products. Generally, the original Fly ash precursor contain both ‘active’ and ‘inactive’ bonds indicating their reactivity in the alkaline solution. The vibrational frequency assignment of FA precursor as given in Table 3, the active sharp absorption band at around 1093 cm-1 (s) related to asymmetric stretching of (Si, AlIV)-O-Si in glass and partially overlapped by phases of mullite and quartz. The vibrational. frequency at 990 cm-1(m) which corresponds to the asymmetric stretching of (Si, Al IV)-O-Si in amorphous glasses which could be composed of higher Al concentration. The vibrational frequency at 793 cm-1(w)and 555 cm-1(w) was assigned to the symmetric stretching of Si-O-Si in quartz and AlVI, symmetric stretching of Al-O-Si in Mullite or Mullite like structure. These bonds are said to be ‘inactive’. In the present study these inactive bond appears as weak but the active bonds are found to be sharp.
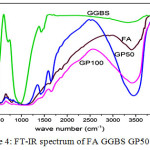 |
Figure 4: FT-IR spectrum of FA GGBS GP50 GP100 Click here to View figure |
Table 3: Vibrational frequency assignment of FA
| Wave No (cm-1) | Assignment | Nature |
| 1093 cm-1(S) | Asymmetric stretching of (Si, Al IV)-O-Si in glass this is due to the partially overlapping of mullite and quartz. | Active |
| 990 cm-1(m) | Asymmetric stretching of (Si, Al IV)-O-Si in amorphous glasses | Active |
| 793 cm-1(w) | Symmetric stretching of Si-O-Si in quartz and AlVI | Inactive |
| 555 cm -1(w) | symmetric stretching of Al-O-Si in mullite or mullite like structure | Inactive |
Broad peak around 1000-1100 cm–1(b) in GP 100 are attributed to T-O asymmetric stretching vibrations and represent the fusion of both Al-O and Si-O symmetric stretching. The lower wave numbers related to a larger extent of aluminium incorporation into the silicate backbone. The broad bands around 3453 cm-1(b) and1643 cm-1(m)corresbonds to stretching vibrational frequency and bending vibrational frequency of adsorbed water for the alaklai activated fly ash. Stretching vibrations of Si-O-Al at 775 cm-1 and Si-O-Al bending vibration at 433 cm-1 indicating the original alumino silicate strucute of fly precursors are depolymerised due to alklai activation. A well outlined band at 1412 cm-1(w) is attributed to C-O bond from alkaline carbonates formed by atmospheric CO2 action. [6&17]
In the case of GP50 observed band around 3451 cm-1 and 1645 cm-1 are attributed to the adsorbed atmospheric water content. During the formation of geopolymer GP50 the Si-O stretching frequency of FA 1069 cm-1 shifted to lower frequency 1028 cm-1 as well shifting of Si-O-Al stretching and bending vibration of FA at 724 cm-1 and 460 cm-1 to lower wavenumber 571 cm-1 and 433 cm-1 respectively. C-O stretching frequency at 1413 cm-1 are also found to present. These shifts are interpreted as a consequence of aluminium incorportation in the Si-O-Si skeleton as observed analogously in zeolites . The more pronounced the shift, the higher the degree of the Al penetration from the glassy parts of fly ashes into the [SiO4]4- network obviously is confirms the condensation of Si-O tedrahedran in geopolymer paste.[18]
SEM Analysis
The SEM Image of GP100 and GP50 is given in figure 5 and 6 respectively. SEM Investigations of the microstructure of Fly ash activated Geopolymer hardened paste using SEM showed distinct changes in the morphology compared with precursors. Gradual dissolution of fly ash particles is evident in GP 100. Amorphous gel formation around fly ash particles are seen clearly along with residues of original unreacted materials of mullite and quartz. The characteristics products of s obtained by activation of 50% fly ash 50% GGBS (GP50) is predominantly hydrated components with relatively less amount of original fly ash particles. The gel formation over the surface of precursors is seen clearly.
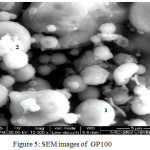 |
Figure 5: SEM images of GP100 |
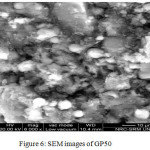 |
Figure 6: SEM images of GP50 |
Solid State Mas-Nmr Analysis
The assignment of NMR components was based on reported literature values obtained in aluminosilicates. 29Si MAS-NMR spectra of FA and geopolymer paste are shown in Fig 7. Spectrum of the initial FA has wide asymmetric signal indicates the heterogeneous distribution of silicon structural units. Resonance range between -80 to -108 ppm is mainly associated with initial glass phase . [Q4(4Al) (-88 ppm), Q4(3Al) (-94 ppm), Q4(2Al) (-101.2 ppm) and Q4(1Al) (-104.9 ppm). The resonances appearing above 108 ppm are assigned to different crystalline phases of silicon Q4 (0Al) (-113 ppm) [18-20].
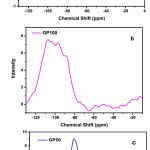 |
Figure 7: 29Si NMR spectrum of a) FA and GGBS b) GP100 and c)GP50 |
NMR peak at -76.4 ppm in GGBS precursor corresponds to Q1 units of silica. In activated pastes, new peaks displaying a wide and asymmetric signal formed by several maxima were detected in comparison to unhydrated precursors of fly ash and GGBS in 29Si NMR spectra. It shows that an important structural rearrangement has been produced. The substitution of Si by Al in the framework of silicate phases resulted in chemical shift of 3 to 5 ppm towards more positive values. It is evident from the observed peaks around Q4(4Al) (-88.7 ppm), Q4(2Al) (-92 ppm), Q4(1Al) (-103.4 ppm), Q4 (0Al) (-107.3 ppm) and Q4(-113 ppm) showed that medium to high amounts of aluminium incorporation resulted more aluminium rich silicate phases.Results obtained from deconvolution of 29Si and 27Al NMR of GSM’s and GP paste is given in Table 4.
Table 4: Results obtained from deconvolution of 29Si and 27Al NMR of GSM’s and GP paste
| FA | GGBS | Assignment | |
|
29Si |
– | -76.4 | Q1 |
| -88.4 | – | Q2 | |
| -94,-101 | – | Q3 | |
| -104.9,-108.2,-113.2 | – | Q4 | |
|
27Al |
0.6 | – | Al (VI) |
| 60.8 | 59.5 | Al(IV) | |
| GP 50 | GP 100 | Assignment | |
|
29Si |
-75.9 | – | Q1 |
| -84.4 | – | Q2 | |
| -91.9 | – | Q4 (3Al) | |
| -103.5 | -103.4 | Q4 (1Al) | |
| -106.5 | -107.3,-113.1 | Q4(0Al) | |
| -113.3 | – | Q4 | |
| – | -97 | Q4(2Al) | |
| – | -88.7 | Q4(4Al) | |
|
27Al |
9.1 | 0.6 | Al(VI) |
| 62 | 59.9 | Al(IV) | |
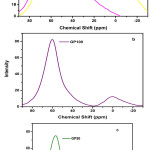 |
Figure 8: 27Al NMR spectrum of a) FA and GGBS b) GP100 and c) GP50 |
27Al MAS-NMR spectra of precursors and geopolymer paste are shown in Fig 8. The precursor FA shows chemical shift at around 60.8 ppm (Broad) which indicates the presence of tetrahedral aluminium Al(IV) and 0 ppm, corresponds to the Al(VI) from mullite. The precursor GGBS show the peak around 59 ppm. In GP100 the shift in the broad peak at 60.8 ppm to 59.9 ppm was observed in the case of geopolymerisation reactions, the rates of amorphous aluminosilicate dissolution and precipitation mostly dependent on factors such as temperature, pH, and concentration of soluble Si/Al ratio. The understanding of importance of aluminium in the formation of geopolymers and the determination of available aluminium in raw materials is critical for successful formulation of Geopolymer mixes.
Thermal Analysis (Sta)
In thermo gravimetric analysis, the mass loss was measured while the specimens were gradually exposed to increasing temperatures. Powdered specimens were used in TGA to ensure the achievement of thermal equillibrium during transient heating. Fig.9 shows the TGA and DTA analysis of fly ash based geopolymer cement. TGA thermogram shows sharp decrease in weight before 250ºC which is attributed to the loss of evapourable water content in the geopolymer paste. After the initial rapid down, the rate of weight loss stabilised between 250ºC to 780ºC . After 780ºC , little change in weight has occurred. After 1300ºC exposure of geopolymer cement the total weight loss was 12% only. The decrease in weight at around 120ºC indicted by the DTA endothermic curve. This minima is due to the dehydration of water molecule.
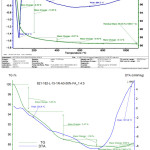 |
Figure 9: TGA and DTA of GP100 TGA and DTA of GP50 |
Conclusion
The challenge of producing consistent Geopolymer products from heterogeneous industrial wastes sources such as fly ash, slag requires a greater degree of characterization than by is provided by an elemental composition analysis alone. The extent of raw material dissolution in alkali activator solution, rate of aluminium release, soluble silicon concentration and water demand are all critical components in formulation of consistent and cost competitive Geopolymer products.
This paper examined the development of mechanical strength and structural characterization of binder by taking fly ash and combination of fly ash & GGBS with complex activator solution. Various tools are used to characterize the precursors, conditions of geopolymersiation reactions and the products formed. FT-IR, NMR techniques enable us for detailed identification of different type of aluminium rich silicate species. A clear trend between reactive component bond in the precursor with that of strength giving micro-structure from FT-IR and NMR results. SEM studies confirmed the compact microstructure of the product. The thermal analysis studies of GP100 &GP50 revealed that the geopolymeric specimens are stable upto 1000ºC
References
- Davidovits, J.; Journal of Thermal Analysis, 1999, 37(8):1633–56.
CrossRef - Fernandez-Jimenez, A.; Palomo, A.; Criado, M.; Cement and Concrete Research, 2005, 35, 120-126.
- Duxson,P.; Fernandez-Jimenez, A.; Provis, J L.; Lukey, G C.; Palomo, A.; Van Deventer,J S J.; Journal of Material Science, 2007, 42, 2917–2933.
CrossRef - Swane poel, J.C.; Strydom, C.A.; Applied Geochemistry, 2003,17,1143-1148
- Van Devender, J S J.; Provis, J L.; Duxson, P.; Lukey, J C.; Journal of Hazardous materials, 2007, 506-513.
CrossRef - Shi, P.; Krivenko, V.; Roy, D M.; Alkali activated cement and concrete,Taylor and Francis,UK,2006
CrossRef - Duxson, P.; Provis, J.L.; Lukey, G.C.; van Deventer, J.S.J.; Cement and Concrete. Research, 2007, 37, 1590–1597
CrossRef - John L.Provis.; Angel palomo.; Cai Jun Shi.; Cement and concrete research, 2015, 78, 110-125
- Hajimohammadi, A.; Provis, J L.; Van devender, J S J, Chemistry materials, 2010, 22, 5199-208.
CrossRef - Hajimohammadi, A.; Provis, J L.; J S J Van devender.; Cement and Concrete Research, 2011, 41, 210-216.
CrossRef - Sreveson, M.; Crenstil, K S.; Journal of Materials Science. 40 (2005) 4247-4259.
CrossRef - Rajamane, N P.; Nataraja, M C.; Jeyalakshmi, R.; The Indian Concrete Journal, 2014, 88, 45-46.
- Oh, J E.; Jun, Y.; Jeong, Y.; Montetro, P J M.; Cement and Concrete Composites, 2015, 57 44-54.
CrossRef - Komijenovic, M.; bascarevic, Z.; Bradic.; Journal Hazardous Materials, 2010, 181, 35-42.
- Violeta Nikolic.; Miroslav Komljenovic.; Zvezdana BascarvicNatasa Marjanavic.;Zoran Miladinovic.; Rada petrovic.; Construction and Building Materials, 2015, 94, 361-370.
- Fernandez-Jimenez, A.; Paloma, A.; fuel, 2003, 82, 2259-2265.
- Criada, M.; Fernandez-Jimenez, A.; Paloma, A.; Sobrados, I.; Sanz, J.; Microporous Mesoporous Material, 2008, 109, 524-534.
- Zhang, Z.; Wang, H.; Provis, J.; sustainable Cement based Materials, 2012, 1, 154-166
- Dali Bondar.; Lynsdale, C J.; Neil, B.; Milestone, N.; Hassani , A.; Ramezanianpour A.; Cement & Concrete Composites, 2011, 33, 251–260

This work is licensed under a Creative Commons Attribution 4.0 International License.
![]()
A New Edition of Web of Science
Journal Impact Factor
2022: 0.5
Five Year: 0.8
Journal is Indexed in

Cabells Whitelist
![]()


