QSAR Modeling, Docking and Insilico ADMET Studies of Lanosterol Synthase Inhibitors
1Department of Chemistry, Bishop Moore College, Mavelikara, Kerala-290110.
2Department of Chemistry, S N College, Kollam, Kerala.
Corresponding Author E-mail: drpushpavl@gmail.com
DOI : http://dx.doi.org/10.13005/ojc/330428
Download this article as:
![]()
Lanosterol Synthase is an attractive target for antihypercholesterolemeic drug design. A set of 26 molecules having lanosterol synthase inhibitory activity was used for pharmacophoric hypothesis and atom based QSAR analysis. Inhibitory concentrations (pIC50) of these compounds were ranged from 7.452 to 8.721. Pharmacophoric hypothesis AAHPR.174 had the best survival score of 3.560. On the basis of the best hypothesis AAHPR.174, atom based 3D-QSAR validation was carried out using PLS factor, with 20 compounds in training set and 6 compounds in test set. From the regression analysis, a highly predictive and statistically significant model was generated having the co-efficient of determination (R2 = 0.9934), cross validated co-efficient (q2 = 0.8083), Pearson correlation co-efficient = 0.9345 and variance ratio (F = 561.9). The QSAR model indicated that hydrogen bond acceptor, aromatic, hydrophobic and positively charged groups play an important role in LSS inhibitor activities. This pharmacophoric hypothesis was used to screen ligands from Asinex database. On the basis of fitness score and docking interactions, novel ligands were selected. InsilicoADME/Toxicity predictions were analyzed to understand the lanosterol synthase inhibitor activity of these compounds and that may help in the future development of drug candidate with fewer side effects.
KEYWORDS:Lanosterol Synthase Inhibitors; Pharmacophore; QSAR; Docking; ADME
Introduction
Cholesterol and lipid triglycerides are essential building blocks in the structure of cells, making hormones and producing energy1. Hypercholesterolemia is the presence of high level of cholesterol in blood. The excess amount of cholesterol can lead to hardening and narrowing of arteries (called atherosclerosis) in the major vascular system2. HMG-CoA reductase Inhibitors (statin drugs) are widely used for the treatment of atherosclerosis. Long term use of statin drugs related with a reduced risk of cancer progression3-4,elevated level of liver enzymes, kidney failure.5 It may negatively associate with the amount of Intermediates required for other biosynthetic pathways (eg: synthesis of Isoprenoids, coenzyme Q10)6-7. Lanosterol Synthase (LSS) enzyme plays a central role in the biosynthesis of cholesterol. In vertebrates the Lanosterol Synthase (LSS) enzyme converts (S)-2, 3-Oxidosqualene to a protosterolcation and then to a lanosterol8-15. Hence there is a special attention in the identification of LSS inhibitors as drugs to lower cholesterol in blood.
Methodology
Ligand Preparation
A group of 26 molecules having lanosterol synthase (LSS) [EC5.4.99.7] (PDB id: 1W6J) Inhibitory activity were collected from literature survey. LSS Inhibitory activities of the molecules were changed to pIC50 values (Table 1, 2, 3 and 4)16. The molecules were minimized by ligprep module with semi-empirical OPLS – 2005 force field. Build and Maestro modules were used to create low energy 3D structures of the ligand.
Quantitativepharmacophore and 3D QSAR Model Generation
Based on the activity threshold values, the entire data set was divided into active and inactive pharmsets for generating common pharmacophore hypothesis. For actives, the activity threshold value was 8.2 and for inactives 7.6. pIC50 activity in the data set ranges from 7.452 to 8.721. Generated pharmacophore based alignment of the 3D structures of the ligand was used to derive a predictive atom based 3D QSAR model.
For generating pharmacophore model, PHASE module of Schrodinger software was used. PHASE provides defaultpharmacophoric features such as H-bond acceptor(A), H-bond donor(D), hydrophobic group(H), negatively charged group(N), positively charged group(P) and aromatic ring(R)17-18. To create 3D QSAR model, the high scored hypothesis was used.
For generating atom based QSAR model, the ligands were divided into 80% with training set (20 compounds) and 20% with test set (6 compounds) using PLS. PHASE has five PLS factors, out of which the fourth factor is found to be dominant. The quality of the generated 3D QSAR model was verified by test set predictions.
Molecular Docking
Molecular docking was carried out for the validation of common pharmacophoric aspects and 3D QSAR model. Docking studies of 26 molecules were performed with the 3D structure of lanosterol synthase enzyme (PDB id: 1W6J)19. Protein preparation wizard panel of Schrodinger suit v9.2 was used for the preparation of protein20. The protein was preprocessed, optimized and minimized with force field of OPLS – 2005 and RMSD of 0.3 A0 by protein preparation wizard21-22. Grid was created using the centroid of workspace ligand R048-8071.
The new ligands were screened from the fitness score in the find match to hypothesis option and docking analysis was carried out. The glide score was obtained from the favourable and unfavourable interactions of new ligands with amino acids at the active site of 1W6J protein. Based on the glide score, the best pose of the docking interaction was selected.
ADME Screening
InsilicoADME/Toxicity predictions were applied to understand the lanosterol synthase Inhibitor activity ofthe reference ligand,training set test set and newly designed molecules. Using Qik prop module, ADME/Toxicity propertiesof new ligands were determined23.
Results and Discussion
To evaluate LSS enzyme – ligand interactions quantitative pharmacophore and 3D QSAR model generation methods were applied. Molecular docking was performed to elucidate the binding interactions between ligands and the lanosterol synthase enzyme. Using Qik prop module,ADME properties of molecules were analyzed.
For the formation of common pharmacophore model, the data set was split into actives (>8.2) and inactives (< 7.6). Five pointed pharmacophore hypothesis were selected and applied to scoring function analysis. The AAHPR.174 hypothesis is the best hypothesis in this analysis characterized by high survival score (3.560). The AAHPR.174 hypothesis is presented in figure 1.
The characteristics represented in this hypothesis aretwo hydrogen bond acceptors, one hydrophobic group, one positively charged group and an aromaticgroup. The best fitness score of 3 was showed by the compound sixteen and the best activity was showed by compound one having fitness score of 2.58 (figure 2a and 2b). The alignments of all active and active or inactive ligands were displayed in figure (3a) and (3b).
The hypothesis score, distance and angle between different sites of AAHPR.174 were presented in Table 5,6 and 7. For atom based QSAR, the best AAHPR.174 hypothesis was selected. For generating 3D QSAR model, 20 ligands were taken as training set and 6 ligands were taken as test set. PLS factor four is found to have good statistics is shown in Table 8.
From the regression analysis, a highly predictive and statistically significant model was generated having the co-efficient of determination (R2 = 0.9934), cross validated co-efficient (q2 = 0.8083), Pearson correlation co-efficient = 0.9345 and variance ratio (F = 561.9), standard deviation of regression (SD = 0.033) and root mean squared error (RMSE = 0.09).
From the QSAR results, 95% variance was represented by the experimentaland PHASE predicted pIC50 activity graph (figure 4a and 4b). The graph shows the fitting points were close to the regression line. The experimental and predicted pIC50 activities were listed in table 9. The structure and predicted pIC50 values of new ligands were presented intable 10. The new ligands showed proper predicted activity in the range of 8.088–8.290.
The reference ligand R048-8071 (Figure 5) has the glide score of -10.309 kcal/mol. The amino acids Trp 387 and Trp 581 are responsible for the cation -∏ interactions and Asp 455 is responsible for charged H- bond with the positive charge at the position of amino N – atom of R048-8071. The fluoro phenyl group of R048-8071 makes ∏-∏ interactions with Phe 696 and His 232. The bromo phenyl group makes ∏-∏ bonding with Trp 192.
Compound 8 (Figure 6) show the highest docking score of -14.308 kcal/mol and have interactions with Trp 581, Asp 455, His 232, Trp, 192 and Gly 380 amino acids. Highest fitness score compound 16 (Figure 7) show docking score of -9.567 kcal/mol makes interactions with Trp 581, Trp 387,Asp 455, His 232, Phe 696, Trp 192 and Trp 230.
High active compound 1 (Figure 8) show docking score of -8.880 kcal/mol and makes interactions with Trp 581, Asp 455, Phe 696, His 232, Trp 192 and Trp 230. The docking results of all the 26 molecules in the active site of lanosterol synthase were shown in Table 11.
All these results shows the presence of aromatic/substituted aromatic groups, charged polar groups, aliphatic cyclic/acyclic groups and aromatic or heteroaromatic groups enhances the activity of these compounds towards lanosterol synthase enzyme. Ligand 16 was selected as the reference structure for the designing of new molecules. The newly designed compounds structure and their feature were listed in table 10. From the results the predicted activities of new ligands were in the range of 8.06-8.29. The docking results of newly designed molecules in the active site of lanosterol synthase were shown in Table 12. These compounds showed significant docking score indicates that they can be used as LSS inhibitors. Qik prop can predict the toxicity and side effect of the ligand. ADMET calculation was performed using Qik prop for the newly designed molecules and the properties were shown in Table 13.
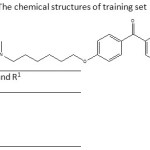 |
Table 1: The chemical structures of training set |
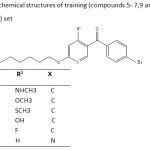 |
Table 2: The chemical structures of training (compounds 5- 7,9 and 10)and test(compound 8) set |
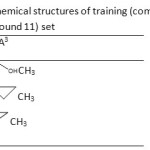 |
Table 3: The chemical structures of training (compounds 12- 14) and test(compound 11) set Click here to View table |
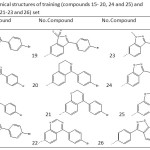 |
Table 4: The chemical structures of training (compounds 15- 20, 24 and 25) and test(compounds 21-23 and 26) set |
Table 5: Best three hypothesis generated.
|
Model |
Survival-Active |
Survival-Inactive |
Site |
Vector |
Volume |
Activity |
Inactive |
|
AAHPR.174 |
3.560 |
1.135 |
0.89 |
0.980 |
0.688 |
8.456 |
2.426 |
|
AAHPR.166 |
3.491 |
1.028 |
0.85 |
0.990 |
0.653 |
8.456 |
2.463 |
|
AAHPR.164 |
3.490 |
0.797 |
0.92 |
0.863 |
0.705 |
8.387 |
2.693 |
Table 6: Distances between different sites of model AAHPR.174
|
Hypothesis |
Site-1 |
Site-2 |
Distance(A0) |
|
AAHPR.174 |
A1 |
A2 |
6.453 |
|
AAHPR.174 |
A1 |
H4 |
9.492 |
|
AAHPR.174 |
A1 |
P5 |
14.467 |
|
AAHPR.174 |
A1 |
R6 |
3.725 |
|
AAHPR.174 |
A2 |
H4 |
3.519 |
|
AAHPR.174 |
A2 |
P5 |
8.790 |
|
AAHPR.174 |
A2 |
R6 |
2.800 |
|
AAHPR.174 |
H4 |
P5 |
5.271 |
|
AAHPR.174 |
H4 |
R6 |
6.140 |
|
AAHPR.174 |
P5 |
R6 |
11.351 |
Table 7: Angle between different sites ofmodel AAHPR.174
|
Model |
Site-1 |
Site-2 |
Site-3 |
Angle(A°) Model |
Site-1 |
Site-2 |
Site-3 |
Angle(A°) |
|
AAHPR.174 |
A2 |
A1 |
H4 |
13.0AAHPR.174 |
A1 |
P5 |
A2 |
15.6 |
|
AAHPR.174 |
A2 |
A1 |
P5 |
21.6AAHPR.174 |
A1 |
P5 |
H4 |
15.5 |
|
AAHPR.174 |
A2 |
A1 |
R6 |
7.4AAHPR.174 |
A1 |
P5 |
R6 |
9.1 |
|
AAHPR.174 |
H4 |
A1 |
P5 |
8.5AAHPR.174 |
A2 |
P5 |
H4 |
0.5 |
|
AAHPR.174 |
H4 |
A1 |
R6 |
20.4AAHPR.174 |
A2 |
P5 |
R6 |
6.5 |
|
AAHPR.174 |
P5 |
A1 |
R6 |
28.9AAHPR.174 |
H4 |
P5 |
R6 |
6.4 |
|
AAHPR.174 |
A1 |
A2 |
H4 |
142.6AAHPR.174 |
A1 |
R6 |
A2 |
162.8 |
|
AAHPR.174 |
A1 |
A2 |
P5 |
142.8AAHPR.174 |
A1 |
R6 |
H4 |
147.4 |
|
AAHPR.174 |
A1 |
A2 |
R6 |
9.8AAHPR.174 |
A1 |
R6 |
P5 |
141.9 |
|
AAHPR.174 |
H4 |
A2 |
P5 |
0.8AAHPR.174 |
A2 |
P5 |
H4 |
0.5 |
|
AAHPR.174 |
H4 |
A2 |
R6 |
152.4AAHPR.174 |
A2 |
P5 |
R6 |
6.5 |
|
AAHPR.174 |
P5 |
A2 |
R6 |
152.6AAHPR.174 |
H4 |
P5 |
R6 |
6.4 |
|
AAHPR.174 |
A1 |
H4 |
A2 |
24.4AAHPR.174 |
A1 |
R6 |
A2 |
162.8 |
|
AAHPR.174 |
A1 |
H4 |
P5 |
156.0AAHPR.174 |
A1 |
R6 |
H4 |
147.4 |
|
AAHPR.174 |
A1 |
H4 |
R6 |
12.2AAHPR.174 |
A1 |
R6 |
P5 |
141.9 |
|
AAHPR.174 |
A2 |
H4 |
P5 |
178.7AAHPR.174 |
A2 |
R6 |
H4 |
15.4 |
|
AAHPR.174 |
A2 |
H4 |
R6 |
12.2AAHPR.174 |
A2 |
R6 |
P5 |
20.8 |
|
AAHPR.174 |
P5 |
H4 |
R6 |
168.2AAHPR.174 |
H4 |
R6 |
P5 |
5.5 |
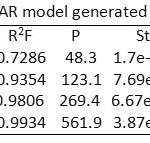 |
Table 8: Statistical values for 3D QSAR model generated by PLS. Click here to View table |
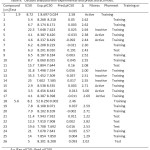 |
Table 9: Dataset analyzed with experimental and predicted activities. |
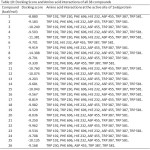 |
Table 10: Docking Score and Amino acid interactions of all 38 compounds |
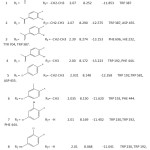 |
Table 11: Predicted activity, docking results and amino acid interactions of new ligands. Click here to View table |
Table 12: Prediction of drug-likeness of pharmacophore hits using qikprop simulation 23 (Range 95% of drugs)
| NewStarsMolecularMolecularPSAC HBdHBe Rotatable ligand weightaVolumebdonorsacceptorsbondsf(g/mol) (A0) | ||||||
| 1 | 0 | 291.433 | 1157.595 | 47.625 | 1 | 4.25012 |
| 2 | 0 | 304.431 | 1142.727 | 45.878 | 0 | 6.7508 |
| 3 | 0 | 338.876 | 1175.044 | 47.353 | 0 | 6.7508 |
| 4 | 0 | 383.327 | 1198.707 | 46.981 | 0 | 6.7508 |
| 5 | 0 | 322.877 | 1173.287 | 17.375 | 0 | 4.7508 |
| 6 | 0 | 324.893 | 1196.676 | 18.133 | 0 | 4.7508 |
| 7 | 1 | 296.839 | 1069.583 | 18.354 | 0 | 4.7507 |
| 8 | 0 | 296.839 | 1073.520 | 17.875 | 0 | 4.7506 |
| 9 | 0 | 347.682 | 1005.227 | 28.123 | 1 | 4.2506 |
| 10 | 0 | 347.682 | 1005.572 | 28.144 | 1 | 4.2506 |
A * indicates violation of the 95% range (0 – 5.)
a – Molecular weight of the molecule(130.0 – 725.0)
b – Total solvent-accessible volume in cubic angstroms using a probe with a 1.4 Å radius(500.0 – 2000.0).
c – Van der Waals surface area of polar nitrogen and oxygen atoms and carbonyl carbon atoms (7.0 – 200.0).
d – Number of hydrogen bond donors (0.0 – 6.0).
e – Number of hydrogen bond acceptors (2.0 – 20.0).
f – Number of rotatable bonds (0 – 15).
Table 13: Calculation of physicochemical properties using qikprop simulation23 (Range 95% of drugs)
|
NewQPlogP(o/w)aQPlogSbQPPCacocQPlogHERGdQPPMDCKe% Humanoral ligand absorptionf |
||||||
| 1 | 3.923 | -3.903 | 581.701 | -6.350 | 304.718 | 100 |
| 2 | 2.172 | -1.506 | 181.319 | -6.914 | 95.626 | 80.086 |
| 3 | 2.559 | -2.145 | 158.887 | -6.836 | 192.934 | 80.323 |
| 4 | 2.756 | -2.463 | 171.455 | -6.952 | 223.567 | 83.070 |
| 5 | 3.975 | -3.194 | 513.098 | -7.092 | 726.558 | 100 |
| 6 | 4.063 | -3.515 | 513.541 | -7.072 | 682.924 | 100 |
| 7 | 3.336 | -2.436 | 554.159 | -6.986 | 789.968 | 95.584 |
| 8 | 3.281 | -2.573 | 513.107 | -6.698 | 726.549 | 90.113 |
| 9 | 3.207 | -2.817 | 300.977 | -6.576 | 1010.670 | 90.083 |
| 10 | 3.211 | -2.834 | 301.270 | -6.590 | 1018.838 | 90.113 |
A * indicates violation of the 95% range.
An M indicates MW is outside training range.
QPlogP (o/w) —– Predicted octanol/water partition coefficient. (–2.0 – 6.5)
QPlogS —– Predicted aqueous solubility, log S. S in moldm–3 is the concentration of the solute in a saturated solution that is in equilibrium with the crystalline solid. (–6.5 – 0.5)
QPPCaco —- Predicted apparent Caco-2 cell permeability in nm/sec. Caco-2 cells are a model for the gut blood barrier. QikProp predictions are for non-active transport. (<25 poor, >500 great)
QPlogHERG — Predicted IC50 value for blockage of HERG K+ channels. (below –5)
QPPMDCK —- Predicted apparent MDCK cell permeability in nm/sec. MDCK cells are considered to be a good mimic for the blood-brain barrier. QikProp predictions are for non-active transport. (<25 poor, >500 great)
Percent Human- Oral Absorption —— Predicted human oral absorption in GI. (>80% is high <25% is poor)
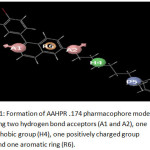 |
Figure 1: Formation of AAHPR .174 pharmacophore model showing two hydrogen bond acceptors (A1 and A2), one hydrophobic group (H4), one positively charged group (P5), and one aromatic ring (R6). Click here to View figure |
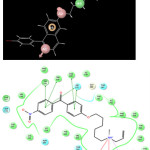 |
Figure 2a: alignment of best fitness score compound 16. 2b) alignment of active Compound 1. Click here to View figure |
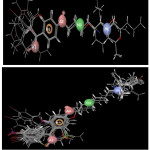 |
Figure 3a: alignment of all active compounds to the pharmacophore.b) alignment of all compounds (active/inactive) to the pharmacophor. Click here to View figure |
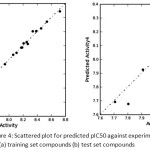 |
Figure 4: Scattered plot for predicted pIC50 against experimental pIC50 for (a)training set compounds (b) test set compounds Click here to View figure |
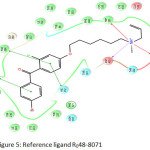 |
Figure 5: Reference ligand R048-8071 Click here to View figure |
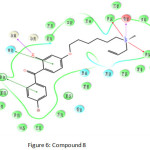 |
Figure 6: Compound 8 Click here to View figure |
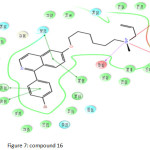 |
Figure 7: compound 16 Click here to View figure |
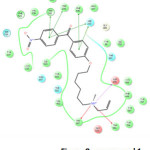 |
Figure 8: compound 1 Click here to View figure |
Conclusion
As per the above results the newly designed compounds showed fitness score higher than 2 and have good predicted IC50 values in the range of 8.068-8.290. The docking score of all these compounds were larger than the reference ligand R048-8071 (docking score of R048-8071 was -10.309 kcal/mol).Insilico ADME/Toxicity analysis of these compounds showed promising results. Hence these ligands were selected for invitro and invivo studies to prove its efficacy as potential drugs in treating hypercholesterolemia.
References
- David, k.; J.Natr.1987, 117, 1330-1334.
- U, Ravnskov.;An Int. J.Med. 2002, 95, 397-409.
- Demierre,M.F.; Higgins, P.D.; Gruber, S.B.; Hawk, E.; Lippman, S.M. Natr. Rev. Cancer. 2005,95,930-942.
CrossRef - Chan,k.k; Oza,A.M.; Siu,L.C. Clin.Cancer Res.2003,9,10-19.
- Kasiske, B.L.; Wanner. C.; O’Neill. W.C.Am. J. Cardiol. 2006, 97 [suppl], 82C-85C.
CrossRef - Pedersen,T.R.; Tobert,J.A. A reappraisal.Drug Saf.1996,14,11-24.
CrossRef - Morand,O.H.; Aebi,J.D.; Dehmlow,H; ji,Y.H.; Gains.N.; et al. J. Lipid Res.1997,38,373-390.
- Bernhard,E.; Ralph,B.; Peter,M.; Roland,M.; Michael,M. J.Lipid Res.1997,38,564-575.
- Michael,M.; Peter,M.; Roland,M.; Bernhard,E. J.Lipid Res.1996,37,148-158.
- George,R.B.; David,M.H.; Elaine,S.E.S.; David,S.C.; et al. J.Med.Chem.1999,42,1306-1311.
CrossRef - Armin,R.; Francis,M.; Brigitte,D.A.; Martine,S.; et al. Biochem.Biophy. Res. Commun. 2004,315,247-254.
CrossRef - Rie,T.; Tanja,S.G.; Brigitte,D.A.; Jorg,B.; et al. Lett.Natr.2004,432,118-122.
CrossRef - Rie,T.; Yuichi,S.; Akito,N.; Masaaki,S.; et al. Bioorg.Med.Chem.Lett. 2005, 15, 159-162.
CrossRef - Hiroshi,T.; Satoshi,O. Pharmacol.Therapt. 2007,115,375-389.
CrossRef - Mark,M.; Muller,P.;Maier,R.; Eisele,B.J. Lipid Res. 1996,37,148-158.
- Henrietta, D.; Johannes,D.A.; Synese,J.; Yu-Hua, Ji.; Elisabeth,M.V.M.; Jacques,H.; Oliver,H.M. J.Med.Chem.2003,46,3354-3370.
CrossRef - Dixon,S.L.; Smondyrev,A.M.; Rao,S.Chem.Biol.Drug.Des.2006,67,370-372.
CrossRef - Teli,M.K.; Rajanikant,G.K. J.Enzyme.Inhib.Med.Chem.2011,26,1-13.
CrossRef - http://www.rcsb.org/pdb
- Schrodinger suit 2009 Protein Preparation Wizard; Epik version 2.0; Impact version 5.5. Schrodinger, LLC, New York.
- Friesner,R.A. et al.J.Med.Chem.2004,47,1739-1749.
CrossRef - Friesner,R.A.; et al.J. Med. Chem.2006,49,6177-6196
CrossRef - Schrodinger suit 2010 Protein Preparation Guide, Site Map 2.4; Glide Version 5.6,Lig Prep 2.4,Qik Propn3.3, Schrodinger, LLC, New York, NY,2010.


![]()


