Incorporation Solvation With Cloud Point Extraction Method for Separation and Spectrophotometric Determination of cerium (III)
Shawket Kadhim Jawad, Mousa Omran Kadhim and Alaa Saleh Alwan
Department Chemistry of Woman for Faculty of Education University Kufa.
Corresponding Author E-mail: Shawkat.alshakarchi@uokufa.edu.iq
DOI : http://dx.doi.org/10.13005/ojc/330445
Through joined two sensitive methods solvation and cloud point extraction separated and determined micro amount of Ce(III) from aqueous solutions by using organic reagent 2,4-Dimethyl pentan-3-one (2,4-DMP) as extractant and non-ionic surfactant 1% TritonX-100 ,the experimental study shows the solvation species of Ce+3 extracted into cloud point layer (CPL) have a wavelength for maximum absorbance was λmax =295nm and the laboratory experiments appear needed as optimum concentration of salting out KNO3 was 0.6 M in the presence 100µg Ce+3/10mL and 1x10⁻⁴ M (2,4-DMP) so that 0.5 mL at % tritonX-100 as well as after heating the solution at 90C° for 15 minutes the study involved effect of different kind and concentration of salting out , and interferences so that effect of different organic reagent as extractants, also stoichiometry study demonstrated the more probable structure of solvation extracted species was 1:1 2,4-DMP:Ce(NO3)3 with spectrophotometric determination.
KEYWORDS:Cerium(III); Solvationmethod; Cloud point extraction method; Preconcentration; Salting out agent
Download this article as:| Copy the following to cite this article: Jawad S. K, Kadhim M. O, Alwan A. S. Incorporation Solvation With Cloud Point Extraction Method for Separation and Spectrophotometric Determination of cerium (III). Orient J Chem 2017;33(4). |
| Copy the following to cite this URL: Jawad S. K, Kadhim M. O, Alwan A. S. Incorporation Solvation With Cloud Point Extraction Method for Separation and Spectrophotometric Determination of cerium (III). Orient J Chem 2017;33(4). Available from: http://www.orientjchem.org/?p=35659 |
Introduction
Extraction experiments for Ce+3 ion from aqueous phase by new laboratory prepared Azo derivation as complexation agent 4- [N-(5-methyl isoxazol-3-yl)benzene sulfonamide azo]-1- Naphthol (AMBN) shows the optimum conditions for this extraction method was (pH= 9) (10 minutes) shaking time and 100μg (1.5×10⁻⁴M) concentration of Ce+3 ion in aqueous phase. Organic solvents effect study. [1].Extraction ability of 8-HQ in thecountenance of DB18C6, DCH18C6, and DB18C6 crown ethers for chosen Ln(III) ions from acidic media to DMSO/chloroform solvent system. The study effect of HNO3 concentrations on theselectivity of extraction, the effects of solvent, pH, Crown ether organic reagent and concentrations of crown ethers.[2].Separation and extraction of Zn(II) and Cd(II) as a neutral compound by used methyl stearate as extractant dissolved in chloroform. Applications of separation and extraction according to solvation method from nitrate aqueous solution by used methyl stearate which is binding coordinately with nitrate salt of metal under study Zn(II) and Cd(II). The extracted species have λmax=263 nm for Zn2+ and λmax=346 nm for Cd2+. The studies about limitation optimum condition for extraction show 0.3 M salting out effect KNO3 for Zn2+ and 0.7 M KNO3 for Cd2+ in present 100 µg Zn2+/5 mL and 50 µg Cd2+/5 mL with optimum shaking time 15 min. for both ions[3].N-n-octylaniline in dissolved xylene was used as complexing agent for the extraction separation of Cerium (IV) from salicylate medium. Ce(IV) was stripped from the organic phase with [2.0M] HCl as well as determined spectrophotometrically by ArsenazoIII. We studied some effect of parameters such as of pH, effect of metal ion, equilibration time, stripping agents and diverse ions on the extraction of Ce(IV). This study stoichiometric of the extracted species was obtained from slope analysis. The method applicable for the determination of Ce(IV) in semiconductor films, synthetic mixture and monazite sand[4].Acetophenone 2’,5’dihydroxy, semicarbazone used for determination of Ce(IV). The complex has been quantitatively extracted into n-Butanol at pH=4.0. Beer’s law is obeyed over the concentration range 1-10ppm. Sandell’s sensitivity=0.02484 µg/cm2 and the ε= 2564.1 L/ molcm. This method is applicable to determine Ce(IV) commercial and synthetic samples[5]. Hydrazinecarboxymide2-[(2-hydroxyphenyl)methylene-1is as organic reagent spectrophotometric determination of cerium(IV). The organic reagent forms light yellow colored complex which has been quantitatively extracted into n-butanol at(pH=9.7). The method obeys Beer’s law of (1 to 10)ppm. The ε = 4.9312×10⁵ L /mol.cm and Sandell’s sensitivity was = 0.02083 µg /cm2. This method applicable to commercial and synthetic samples[6].
Experiment
Biochrom model (80-7000-11) Libra S60 Cambridge CB40FJ spectrophotometer with 1.00cm quartz cell was used for recording the absorbance spectra and absorbance, controlled the temperature of heating so that the necessary time of heating needed to used electrostatic water bath (WNB7-45) (England) was used to maintain the temperature and time.
Materials and Solutions
All chemical received from sedate commercial company and used as received without any furthermore purification stock solution of Ce+3 ion (1000µg/mL) prepared by dissolved 0.309 g of Ce(NO3)3.6H2O in 100mL distilled water contain 1mL of nitric acid HNO3 and other working solutions prepared by dilution with distilled water and in all preparation of solutions used volumetric flask, so that 1% 8-Hydroxy quinolone dissolved in ethanol ,as well 1×10⁻² M 2,4-DMP prepared by dissolved 0.1142 g in 100mL distilled water and other working solution prepared by dilution with distilled water in suitable volumetric flask.
For determination quantity of Ce+3 in theaqueousphase, we have followed 8-HQ Spectrophotometric method[7] and with theperformance of this method preparing calibration curve by making an experiment on many solutions contain rising quantity of Ce+3 the results were as in Figure (1):
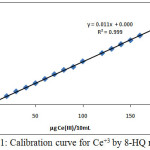 |
Figure 1: Calibration curve for Ce+3 by 8-HQ method
|
Comprehensive Method
Preparing 10 mL aqueous solutions to contain 100µg of Ce+3 ion with anoptimum concentration of salting out KNO3 and 1×10⁻⁴ M from 2,4-DMP and 0.5 mL % tritonX-100, heating this solution at 90°C for 15min. until complete formation cloud point layer (CPL) with smaller volume and higher density, than separated the cloud point layer (CPL) from aqueous solution, afterward dissolved CPL in 5ml ethanol and measure the absorbance of ethanolic solution at λmax of solution species extracted against blank prepared in the same manner without metal ion , but the aqueous solution treated according to 8-HQ spectrophotometric method and after return to the calibration curve determined the reminder quantity of Ce+3 in aqueous phase after extraction . then subtraction the reminder quantity from the original quantity to determine the transferred quantity of Ce+3 to the CPL as solvation species afterward calculate the distribution ratio D according to relative below:
D = [Ce3+]CPL / [Ce3+ ]aq
We are could be determine the quantityof Ce+3transferred to the CPL by stripping method involved shaking ethanolic solution of CPL with two 5ml portion of 1M HNO3 aqueous solution to destroy the solvation species and transferred Ce+3ion into aqueous acid solution and the by application 8-HQ spectrophotometric method to determination Ce+3 ion in acidic aqueous solution but by performed some experimental stripping method fined the transferred quantity of Ce+3 ion. Determined by stripping method was equal to somequantity determined subtraction then we are followed the subtraction method to determine the transferred quantity in all experiments because easier and faster.
Results and Discussion
The spectrophotometric study involved preparing 10 mL aqueous solutionscontain 100µg Ce+3 and 0.5 M KNO3,0.5 mL at % TritonX-100 and 1×10⁻⁴ M (2,4-DMP) heated the solution at 90°C for 15min. until complete appearance cloud point layer (CPL) separated this layer and dissolved in 5mL ethanol and taking the UV-Visible spectrum for it against blank prepared in the same manner in absence Ce+3, the result as in Figure (2):
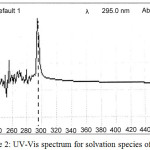 |
Figure 2: UV-Vis spectrum for solvation species of Ce+3 |
The spectrum appearswavelength for maximum absorbance was λmax=295 nm.
Effect of Saltingout Concentration
Preparing 10 mL aqueous solutions each solution contain 100µg Ce+3with rising concentration of salting out KNO3 and 0.5mL of % TritonX-100 in the presence,1×10-4M (2,4-DMP) heating this solution at 90°C for 15min. then complete the waking as in comprehensive method the results were as in Figure (3 and 4):
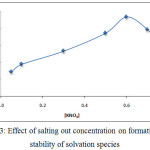 |
Figure 3: Effect of salting out concentration on formation and stability of solvation species |
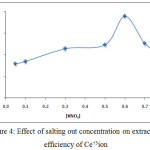 |
Figure 4: Effect of salting out concentration on extraction efficiency of Ce+3ion |
The results shows there was increasing the extraction efficiency of Ce+3 by increasing concentration of salting out KNO3 until reach to the maximum at optimum concentration value 0.6 M KNO3 then decrease extraction efficiency by increasing concentration of KNO3 more than optimum value the results appear the increasing of salting out KNO3 effected to increase the forward direction of thermodynamic equilibrium for formation solvation species and the maximum rate of formation with higher concentration of solvation species obtained at 0.6 M KNO3 of concentration more than optimum value effect to decrease the rate of formation direction with decrease the concentration of solvation species extracted according to mass action law.
Effect of Ce+3 Concentration
Extracted Ce+3ion according to thecomprehensive method from 10mL aqueous solutions contain adifferent quantity of metal ion. the results were as in Figures (5 and 6):
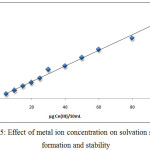 |
Figure 5: Effect of metal ion concentration on solvation species formation and stability |
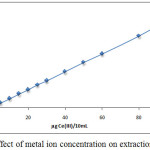 |
Figure 6: Effect of metal ion concentration on extraction efficiency |
The results there is a linear relative for effect of metal ion concentration whereas the concentration of metal ion considers as athermodynamic parameter and the increasing concentration of metal ion to give rise to increasing the rate of forward direction for thermodynamic equilibrium that is amean increase in concentration and stability of solvation species extracted.
Variation 2,4-DMP Concentration
By application the comprehensive method for extraction Ce+3 ion in the presence rising concentration of organic reagent 2,4-DMP the results were as in Figures (7 and 8):
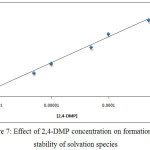 |
Figure 7: Effect of 2,4-DMP concentration on formation and stability of solvation species |
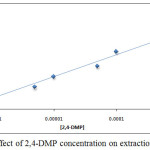 |
Figure 8: Effect of 2,4-DMP concentration on extraction efficiency |
The results appear there is a linear relation between extraction efficiency and molar concentration of organic reagent 2,4-DMP, the increasing of extraction efficiency indicate to behave 2,4-DMP as thermodynamic parameter effect with increasing its concentration to increase the rate of forward thermodynamic direction and increase solvation species concentration and stability
Effect of Variation Surfactant Volume
According to comprehensive method extracted Ce3+ ion from 10mL aqueous solution at optimum conditions by using thedifferent volume of surfactant 1% Triton X-100, the results were as in Figures (9 and 10):
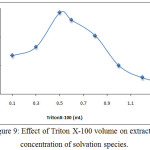 |
Figure 9: Effect of Triton X-100 volume on extracted concentration of solvation species. |
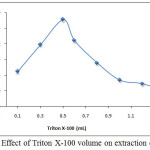 |
Figure 10: Effect of Triton X-100 volume on extraction efficiency. |
The results appear 0.5mL 1%Triton X-100 was optimum volume of surfactant giving higher extraction efficiency because at this volume reached to the critical micelles concentration CMC of the surfactant to obtain best cloud point layer with suitable volume and density to extracted higher concentration of solvation species according to thermodynamic equilibrium any volume less than optimum not allow to reach favorite equilibrium so that volume more than optimum giving decrease in extraction efficiency because effect of increasing diffusion micelles and produce cloud point layer with larger volume and less density.
Thermodynamic Study
By application the procedure detailed in thecomprehensive method at optimum conditions extracted Ce3+ at different temperature of heating in anelectrostatic water bath for 15minutes the results were as in Figures (11 and12):
 |
Figure 11: Effect of temperature on CPL formation and extraction of solvation species. |
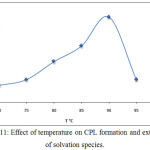 |
Figure 12: Effect of temperature on extraction efficiency and D values. Click here to View figure |
After calculated extraction constant Kex by application the relation below and the diagram between logarithm values of Kex against 1/T K the results demonstrate in Figure (13):
Kex = D / [2, 4 -DMP] [Ce 3+ ]
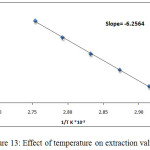 |
Figure 13: Effect of temperature on extraction values.
|
Then from the slope straight line relation in Figure (13) and application relation below determined thermodynamic data[8] as in Table 1:
slope = Δlogkex/1/T
Slope = ΔHex/ 2.302R
∆Gex = – R T ln Kex
∆Gex = ∆Hex – T∆Sex
Table 1: Thermodynamic data for extraction Ce3+
|
Δ Hex kJ.mol |
Δ Gex kJ/mol |
ΔSex J/mol/K |
|
0.1198 |
-67.1 |
184.52 |
The results appear 90°C was the optimum temperature for extraction solvation species of Ce3+, this temperature was the favorite temperature to formation cloud point layer and giving best extraction according to solvation method any temperature more than optimum effect to decrease density and increase volume of cloud point layer by increasing diffusion for micelles, the minimization value of enthalpy ΔHex interpret to approach one another in solvation species extracted so that the large positive value of entropy ΔSexreflect the importance of entropy in extraction method and the method of extraction was entropic in region.
Effect of Heating Time
According to comprehensive method extractedCe3+from 10mL aqueous solution at optimum conditions with different times of heating the results were as in Figures (14 and 15):
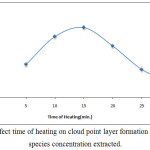 |
Figure 14: Effect time of heating on cloud point layer formation and solvation species concentration extracted. |
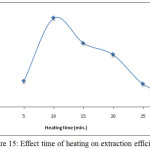 |
Figure 15: Effect time of heating on extraction efficiency. |
The results demonstrate 15minutes was the optimum heating time in extraction method whereas the time of heating represent the kinetic side of extraction method by cloud point method, at this time reached to the maximum kinetic energy help to aggregation the micelles at best state with higher dehydration to form CPL with best properties at less time the kinetic energy was not enough, so that heating time more than optimum giving increase in kinetic energy which effect of increasing diffusion of micelles.
Effect of kinds salting out
Extracted Ce3+ion according to theprocedure detailed in thecomprehensive method by using different kinds of salting out with different concentration for each one the results were as in Figures (16 and 17):
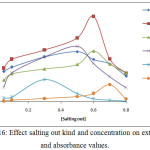 |
Figure 16: Effect salting out kind and concentration on extraction and absorbance values. |
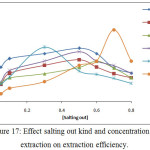 |
Figure 17: Effect salting out kind and concentration on extraction on extraction efficiency. |
The results appear there is different extraction efficiency and solvation species formation and stability with different kinds and concentration of salting out because the different salting out have different behavior in aqueous solutions that is mean different ability to formation solvation species extracted to cloud point layer as well as the salting out behave as electrolyte salt contribute to formation cloud point layer by effect on the dehydration of micelles.
Interferences
From 10mL aqueous solutions extracted Ce3+ at optimum conditions in the presence of foreign ions the results were as at Table (2):
Table 2: Effect of interferences on extraction efficiency of Ce3+.
|
Ion |
Abs .at λmax=295 nm |
D |
|
Ni2+ |
0.241 |
0.064 |
|
Pb2+ |
0.545 |
4.56 |
|
Cu2+ |
0.284 |
1.50 |
|
Cd2+ |
0.393 |
2.30 |
|
Co2+ |
0.360 |
2.57 |
|
Fe3+ |
0.021 |
0.316 |
The results show all the foreign ions presence in the aqueous solution with Ce3+ ion giving interference effect to decline the extraction efficiency of Ce3+ with different degrees, according to the behavior and activity of the foreign ion in aqueous phase, the interfere included participation of each foreign ion to formation solvation species with different concentration this behavior effect to decrease salting out concentration KNO3 and organic reagent 2,4-MP from the optimum concentration necessary to formation solvation species for Ce3+ which mean decreasing in extraction efficiency.
Effect of Organic Reagent Structure
Extracted Ce3+ ion as in the procedure detailed in the comprehensive method at optimum conditions by using different organic reagent the results were as in Table 3:
Table 4: Effect of organic reagent structure no extraction efficiency of Ce3+ion.
|
Organic reagent |
λmax |
Absorbance |
|
Isobutyl methyl ketone |
294 |
0.5 |
|
Butanon |
282 |
0.88 |
|
Tributyphosphat |
305 |
0.11 |
|
Acetophene |
287 |
0.7 |
The results demonstrate there is differentextraction efficiency for Ce3+with each organic reagent is one of the thermodynamic parameters according to its structure which is theeffect on the thermodynamic equilibrium as well as the rate of formation solvation species extracted.
Stoichiometry
By using two spectrophotometric method slope analysis and slope ratio methods according to the procedure detailed in thecomprehensive method the results were demonstrated in Figures (18→20):
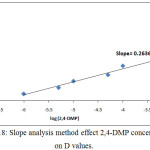 |
Figure 18: Slope analysis method effect 2,4-DMP concentration on D values. Click here to View figure |
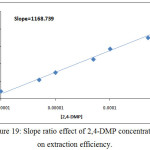 |
Figure 19: Slope ratio effect of 2,4-DMP concentration on extraction efficiency. |
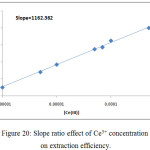 |
Figure 20: Slope ratio effect of Ce3+ concentration on extraction efficiency. |
This two method demonstrated the more probable structure of solvation species structure extracted to CPL was 1:1 organic reagent: metal ion(NO3)3, 2,4-DMP:Ce(NO3)3.
Spectrophotometric Determination of Ce3+
For determination Ce3+ ion in different aqueous samples by application comprehensive method at optimum conditions performed the calibration curve for that goal as in Figure (20):
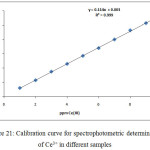 |
Figure 21: Calibration curve for spectrophotometric determination of Ce3+ in different samples Click here to View figure |
References
- Hussein.S. A,K.Al-Kubaisy.R,and Al-Noor.T. H.,Journal of Kufa for Chemical Science,2015,1,10.
- Lokhande. R. S, Janwadkar.S. P., Shirish. P.,Santosh.K. and Sanjay.P., Rasayan. J. Chem, 2011,4.
- Jawad.S. K.,Yassin.M. A.,Innovare Journal of Science, 2016, 4, 4.
- Kokare.B. N., Mandhare.A. M. and Anuse. M. A.,J. Chil. Chem. Soc.,2010,55, 4.
- Lokhande.R. S., Janwadkar.S. P., Shirish.P., Santosh.K. and SanjaySanjayP., Rasayan. J. Chem, 2011,4.
- LokhandeR. S., KulkarniS., PitaleS., PatilS. K. and JanwadkarS. P., Extraction, 2011, 6.
- MarczenkoZ., and BalcerzakM.Separation, preconcentration and spectrophotometry in inorganic analysis. 1st ed. Amesterdam: ELSEVIER,2000.
- AtkinsP., and PaulaJ. de., Physical Chemistry. 9thed. Great Britain: Oxford University Press, 2010.

This work is licensed under a Creative Commons Attribution 4.0 International License.
![]()
A New Edition of Web of Science
Journal Impact Factor
2022: 0.5
Five Year: 0.8
Journal is Indexed in

Cabells Whitelist
![]()


