Ultrasensitive Electrochemical Detection of Cancer Cell Using Modified Graphene Nanostructures
M. Mirhossaini1,2, Mir davood Omrani3,4 , J. Shabani Shayeh5, A. Rahimpour6, F. Haghiralsadat2, V. Mansouri 3,4*and M. Omidi 4
1Department of Biology, Payame Noor University, P.O. Box 119395-3697, Tehran, Iran
2Nano Structured Coatings Institute, Yazd Payame Noor University, P.O. Code 89431-74559, Yazd, Iran.
3Urogenital Stem cell research center, Shahid Beheshti University of Medical Sciences, Tehran, Iran
4Department of Basic science, Faculty of Paramedical Sciences, Shahid Beheshti University of Medical sciences, Tehran, Iran
5Protein research center, Shahid Beheshti University, GC, Tehran, Iran.
6Research Center for Medical Nanotechnology and Tissue Engineering, School of Advanced Technologies in Medicine, Shahid Beheshti University of Medical sciences, Tehran, Iran.
Corresponding Author E-mail: mays_omidi@yahoo.com
DOI : http://dx.doi.org/10.13005/ojc/330318
In this paper the ultrasensitive electrochemical cytosensor was introduced for prostate cancer cells (Du-145) detection. In this cytosensor Du-145 cells were captured on modified gold electrode by using CD-166 antibody. Also reduced graphene oxide/ gold nanoparticle/ CD-166- horseradish peroxidase (rGO/ AuNP/Ab-HRP) nanoprobes as efficient signal amplifiers was designed for the cancer cells recognition. The presented cytosensor exhibited a good cell-capture ability, wide detection range and low detection limit of 50 cells. This cytosensor has great potential for cancer cell detection in clinical and pathological application.
KEYWORDS:Electrochemical cytosensor; cancer stem cells; human prostate cancer cells; hybrid nanostructure
Download this article as:| Copy the following to cite this article: Mirhossaini M, Omrani M. D, Shayeh J. S, Rahimpour A, Haghiralsadat F, Mansouri V, Omidi M. Ultrasensitive Electrochemical Detection of Cancer Cell Using Modified Graphene Nanostructures. Orient J Chem 2017;33(3). |
| Copy the following to cite this URL: Mirhossaini M, Omrani M. D, Shayeh J. S, Rahimpour A, Haghiralsadat F, Mansouri V, Omidi M. Ultrasensitive Electrochemical Detection of Cancer Cell Using Modified Graphene Nanostructures. Orient J Chem 2017;33(3). Available from: http://www.orientjchem.org/?p=33526 |
Introduction
For more effective treatment in cancer disease early detection or diagnosis with the rapid, sensitive and selective method is vital. According to this fact, developing simple strategy for cancer cells and cancer stem cells detection could be crucial in clinical diagnosis [1]. Currently available technologies to detection of cancer cell are based among others on polymerase chain reaction (PCR) [2], immunohistochemistry [3], mass spectrometry [4], flow cytometery [5]. While each technique has its own advantages there remains a need for sensitive, simple, rapid and cheap techniques for cancer cell detection.
A little while ago, electrochemical detection techniques (e. g. impedance spectroscopy (EIS) [6-8], electrochemical luminescence (ECL) [16, 17], differential pulse (DPV) [9, 10], stripping (SV) [13-15] and cyclic voltammetry (CV) [11-13]) was applied for cancer cell detection. The electrochemical techniques in comparison with traditional methods have own advantages such as rapid response, unprecedented sensitivity, and facile operation system. Nonetheless, selectivity and sensitivity electrochemical cytosensor are still the key problem. To overcome this issue, signal amplification approach by using the enzymes based electrocatalysts have proposed in numerous literatures [8-14]. Although sensitivity has improved by using this methods, developing a selectivity and sensitivity electrochemical sensor for cancer cells detection is still a challenging issue [18].
As the thinnest material in our universe, graphene (G), has attracted particular attention of researchers during the past decade [13, 19-21]. It has been demonstrated that the sensitivity of electrochemical cytosensors can be improved by using the Au/ graphene hybrid nanostructure [6, 17, 22, and 23].
According to the world health organization (WHO) reports, prostate cancer is the most widespread form of cancer in men, and it is the second cause of cancer death in male [24]. The overexpression of cluster of differentiation 166 (CD-166) in on a member of prostate cancer cells have proved by immunohistologic studies [25-27]. The overexpression CD-166 in more than 86% of prostate carcinomas was reported by Sampieri [26]. Thus, the CD-166 antibody could be appropriate candidate for prostate cancer cells detection.
In this study, extremely sensitive and selective electrochemical cytosensor has been introduced for detection of Du-145 prostate cancer cells by using the dual recognition and enzymatic signal amplification approach. In the present cytosensor, the modified gold electrode by CD-166 antibody was used to capture the target cancer cells, and graphene / gold / CD-166- horseradish peroxidase (RGO/ AuNP/Ab-HRP) nanoprobes was utilized for accurate recognition and enzymatic signal amplification. As it was anticipated, this cytosensor exhibited an outstanding performance for the target cancer cells detection.
Experimental
All materials and chemical reagents were purchased from Sigma Aldrich. CD-166 monoclonal antibody and CD-166 – horseradish peroxidase were supplied from Abcam. Du-145, 293T, L02, HepG2 and MCF-7cell line was obtained from ATCC. According to our previous work graphene oxide (GO) was synthesized based on modified hummer’s method [19, 28]. The reduced graphene oxide / gold nanostructures (rGO/AuNP) were obtained by chemical reduction of chloroauric acid (HAuCl4) on graphene oxide sheets. In brief, 100 μl of chloroauric acid (0.02 M) was mixed with the 2 ml of GO suspension (1 mg/ml) at room temperature. After 2 h 0.05 ml of NaBH4 (0.1 M) was added to the mixture and stirring for 1 hour. The sample was finally washed three times with DI water.
The CD-166- horseradish peroxidase (Ab-HRP) were introduced to the modified rGO/AuNP through 1-[3-(Dimethylamino)propyl]-3-ethylcarbodiimide (Sigma) and N-hydroxysuccinimide (EDC/NHS) reaction. In brief. 2 ml solution of 3-mercaptopropionic acid (3MPA) was mixed with the 2 ml of rGO/AuNP (1 mg/ml) at room temperature and stirring for 5 hour. Then the mixture was washed three times with PBS. Subsequantly, modified rGO/AuNP were incubated with 50 mM EDC/NHS for 15 minute. Afterwards, 0.2 mg/ml Ab-HRP were added to the mixture and kept in 4° C for 2 h. The mixture was finally washed three times with PBS (Scheme 1a).
In this work gold electrode, was made out of a gold rod isolated by a plastic cover, with its tip polished by Aluminum oxide to be utilized as the immobilization surface. Then it was placed inside piranha solution (hydrogen peroxide / sulfuric acid 1:3 volume fraction) for 5 min and washed with deionized water. The electrochemical cytosensor was prepared by the immersing this electrode in ethanol solution of 3- mercaptopropionic acid (MPA, Merck) (pH=11, using NaOH for pH adjustments) for 2 h in room temperature. Then surface, was washed with deionized water and was incubated in CD-166 antibody solution at 4°C in presence of (EDC/NHS) for 24 h. After 24 h to remove weakly bonded proteins, the electrode was washed with deionized water and dried at room temperature (Scheme 1b).
The prepared modified electrode was incubated with 200 ml of the cell suspensions for 75 min at 37° C. Then the electrode was rinsed and immersed into RGO/ AuNP/Ab-HRP nanoprobes solution for an hour. The electrochemical signal was obtained through enzymatic reaction of HRP in the presence of H2O2 (increasing reduction current) and the current peak in differential pulse voltammetry was directly related to the captured cells (Scheme 1c).
Herein IviumStat.XR was applied electrochemical measurement. Philips EM208 transmission electron microscope (TEM) was used for study of the samples morphology. X-ray diffractions (XRD) analyses was done by X’Pert PRO MPD (PANalytical) diffractometer.
Scheme 1. (a) The fabrication procedures of rGO/ AuNP/Ab-HRP nanoprobe. (b) Preparing procedure of the electrochemical cytosensor (c) Schematic illustration of the present cytosensor for Du-145 prostate cancer cells detection.
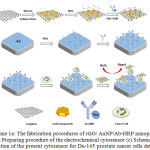 |
Scheme 1: (a) The fabrication procedures of rGO/ AuNP/Ab-HRP nanoprobe. (b) Preparing procedure of the electrochemical cytosensor (c) Schematic illustration of the present cytosensor for Du-145 prostate cancer cells detection. Click here to View scheme |
Result and Discussion
The TEM images of GO and rGO/ AuNP are shown in fig.1A and fig.1B respectively. As shown in fig.1A, the prepared GO was fully exfoliated with several hundreds of nanometres in length (lateral width: 70 to 800 nm and the average thickness: 2 nm). As it is clear in fig.1B, AuNP was decorated on the surface of reduced graphene oxide uniformly with high density. Also in the synthesized rGO/ AuNP, it can be seen that AuNP has narrow size distribution within a range of 5–10 nm. According to the TEM image, the combination of reduced graphene oxide nanosheets and gold nano particles was successfully done, and no free nanoparticles were individually observed. The XRD patterns of GO and rGO/ AuNP are also shown in fig. 1C. As shown in curve a, the reduced graphene oxide has a peak at 2θ~26.01o which is associated to the (002) plane of graphite. For rGO/ AuNP as clearly shows in curve b, the four additional peaks were appeared at 2θ~ 38 o, 44 o, 65 o and 78 o. These peaks are related to the (111), (200), (220) and (311) planes of the AuNPs [29].
Electrochemical impedance spectra (EIS) technique was applied for study of different assembly processes steps in the cytosensor (Fig. 1D). As shows in curve a, due to fast electron transfer process, semicircle domain in Nyquist plots was observed for the bare electrode. Curve b shows that the semicircle domain was increased when CD-166 was introduced to the electrode. As demonstrated in curve c, by assembly of cancer cells the resistance was obviously increased and by introducing the nanoprobes to the cell/ CD-166/ gold electrode impedance was also increased (curve d).The presented results in figs. 1A, 1B, 1C and 1D confirmed that rGO/ AuNP/Ab-HRP / Du-145 cell/ CD-166/ gold electrode architecture was successfully achieved in the present cytosensor.
The signal amplification strategy that used in this study was investigated by differential pulse voltammetry (DPV) technique (fig. 2A). For the Du-145 / CD-166 /gold electrode weak current peak was observed in DPV (curve a). DPV current peak was increased by introducing the nanoprobes to the Du-145 / CD-166/ gold electrode in the presence of H2O2 (curve b). On the other hand, when CD-166 /gold electrode was incubated rGO/ AuNP/Ab-HRP nanoprobes without Du-145 cells current peak was obviously decreased in DPV (curve c).
![Figure 1: (A) Typical TEM images of GO (B), rGO/ AuNP. (C) XRD spectra of GO (a) and rGO/ AuNP (b). (D) impedance spectra (EIS) of bare electrode (a), CD-166/ gold electrode (b), Du-145 / CD-166/ gold electrode (c), and rGO/ AuNP/Ab-HRP / Du-145 / CD-166/ gold electrode (d). The measurements were carried out in 0.15 M KCl solution containing 5 mM [Fe(CN6)]4-/3-.](http://www.orientjchem.org/wp-content/uploads/2017/06/Vol33No3_Ultr_Mirh_fig1-150x150.jpg) |
Figure 1: (A) Typical TEM images of GO (B), rGO/ AuNP. (C) XRD spectra of GO (a) and rGO/ AuNP (b). (D) impedance spectra (EIS) of bare electrode (a), CD-166/ gold electrode (b), Du-145 / CD-166/ gold electrode (c), and rGO/ AuNP/Ab-HRP / Du-145 / CD-166/ gold electrode (d). The measurements were carried out in 0.15 M KCl solution containing 5 mM [Fe(CN6)]4-/3-. Click here to View figure |
The incubation time of rGO/ AuNP/Ab-HRP nanoprobes with the Du-145 / CD-166/ gold electrode was known as essential factor in cytosensor response. The effect of incubation time on DPV current peak was shows in Fig. 2B. As demonstrated in Fig. 2B, the peak (Δip) gradually rose by increasing incubation time of nanoprobes. However, the peak current hit a plateau after 75 minute. According to this results, 75 min. can be selected as optimum times and it was chosen as incubation time of nanoprobes for this cytosensor. The concentration of nanoprobe is another essential factor in cytosensor response. The effect of nanoprobe concentration on DPV current peak was shows in Fig. 2C. As shown in Fig. 2C, the Δip rose by increasing concentration of nanoprobe and it was started to plateau for concentration of 7 μL of nanoprobe. Therefore, 7 μL was chosen as optimum concentration.
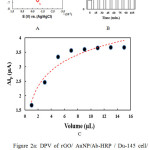 |
Figure 2. (A) DPV of rGO/ AuNP/Ab-HRP / Du-145 cell/ CD-166 /gold electrode (a) without, (b) with 2 mM H2O2 , (c) and CD-166 /gold electrode after incubation in rGO/ AuNP/Ab-HRP nanoprobes without cells. (B), Effects of the incubation time. (C) and volume for rGO/ AuNP/Ab-HRP nanoprobes on the Δip of the cytosensor. The measurements were carried out in an electrolyte of PBS solution (pH 7.0, 100 mM). Click here to View figure |
The influence of Du-145 cells concentration on DPV responses and the linear calibration curve was shows in Fig. 3. As demonstrated in Fig. 3B, the peak (Δip) increased by increasing Du-145 cells concentration. Also between the peaks current and Du-145 cells concentration a linear relationship with Δip (μA) = 2.07 + 1.12 Ln C cells (cells ml-1) with a correlation coefficient of 0.97 (n = 5) observed from 102 to 106 cells ml-1. The detection limit of this cytosensor for Du-145 cells was achieved as 50 cells ml-1. According to the fact that in this excrement 200 μL of cell suspension have been used achieve detection limits of the cytosensor can be obtained as 10 Du-145 cells. As represented in Table 1 in comparison with cytosensors which fabricated based on other electrochemical technique such as CV, DPV and EIS this cytosensor shows lower sensitivity. The specificity of this cytosensor was examined by using human embryonic kidney 293T, human breast cancer MCF-7 cells, human liver hepatocellular carcinoma HepG2 cells and human normal hepatocyte L02 cells. As demonstrated in Fig. 3C, for the 293T, MCF-7, HepG2 and L02 cells in comparison with Du-145 cells notable response can be observed. An excellent selectivity of the present cytosensor have been showed by this results.
Table 1:Comparison of this present cytosensor with other reported biosensors for cancer cell detection.
| Detection method | Cell line | Detection limit(cells ml-1) | Linear range(cells ml-1) |
| DPV [28] | Hela | 300 | 3×10² – 107 |
| DPV [29] |
CCRF -CEM |
10 | 102 – 5×10⁴ |
| CV [12] | MCF-7 | 100 | 102-107 |
| EIS [8] | Hela | 500 | 5×10² – 5×10⁶ |
| DPV* | Du-145 | 50 | 102-106 |
* Present work
Conclusion
In conclusion, we design and fabricate an ultrasensitive electrochemical cytosensor for Du-145 human prostate cancer cells detection by use of the dual recognition and enzymatic signal amplification approach. The modified gold electrode by CD-166 antibody was used in this cytosensor to capture the target cancer cells. Accurate recognition and enzymatic signal amplification was achieved by graphene / gold / CD-166- horseradish peroxidase (RGO/ AuNP/Ab-HRP) nanoprobes. A wide linear range from 102 to 106 cells ml-1, good repeatability, high sensitivity and comparative low detection limits was observed for this cytosensor. In comparison with other cytosensors that reported in literatures, good performance was observed for the present sensor in cancer cell detection. All in all, this cytosensor has great potential for cancer cell detection in clinical application.
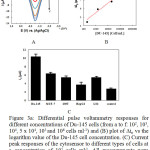 |
Figure 3: (A) Differential pulse voltammetry responses for different concentrations of Du-145 cells (from a to f: 102, 103, 104, 5 x 10⁴, 105 and 106 cells ml-1) and (B) plot of Δip vs the logarithm value of the Du-145 cell concentration. (C) Current peak responses of the cytosensor to different types of cells at a concentration of 105 cells ml-1. All measurements were employed from -0.3 to 0.1 V in 100 mM PBS buffer (pH 7.0) containing 1.5 mM H2O2. The error bars represent relative signals across three repetitive experiments. Click here to View figure |
Reference
- Omidi, M.; Malakoutian, M.; Choolaei, M.; Oroojalian, F.; Haghiralsadat, F.; Yazdian, F. Chin. Phys. Let. 2013, 30, (6), 068701.
CrossRef - Schamhart, D.; Swinnen, J.; Kurth, K.-H.; Westerhof, A.; Kusters, R.; Borchers, H.; Sternberg, C. Clin chem 2003, 49, (9), 1458-1466.
CrossRef - Singh, S. K.; Hawkins, C.; Clarke, I. D.; Squire, J. A.; Bayani, J.; Hide, T.; Henkelman, R. M.; Cusimano, M. D.; Dirks, P. B. nature 2004, 432, (7015), 396 401.
- Whelan, S. A.; He, J.; Lu, M.; Souda, P.; Saxton, R. E.; Faull, K. F.; Whitelegge, J. P.; Chang, H. R. J of prote res 2012, 11, (10), 5034-5045.
- Phillips, J. A.; Xu, Y.; Xia, Z.; Fan, Z. H.; Tan, W. Anal chem 2008, 81, (3), 1033-1039.
CrossRef - Zhang, J.-J.; Gu, M.-M.; Zheng, T.-T.; Zhu, J.-J. Anal che 2009, 81, (16), 6641-6648.
- Zheng, T.-T.; Zhang, R.; Zou, L.; Zhu, J.-J. Analyst 2012, 137, (6), 1316-1318.
CrossRef - Yadegari, A.; Omidi, M.; Yazdian, F.; Zali, H.; Tayebi, L. RSC Adv.2017, 7, (4), 2365-2372.
CrossRef - Cheng, W.; Ding, L.; Lei, J.; Ding, S.; Ju, H. Anal chem 2008, 80, (10), 3867-3872.
CrossRef - Ding, L.; Ji, Q.; Qian, R.; Cheng, W.; Ju, H. Anal chem 2010, 82, (4), 1292-1298.
CrossRef - Rashidi, A.; Omidi, M.; Choolaei, M.; Nazarzadeh, M.; Yadegari, A.; Haghierosadat, F.; Oroojalian, F.; Azhdari, M. Adv. Mater. Research. 2013, 332-336.
- Zhu, X.; Yang, J.; Liu, M.; Wu, Y.; Shen, Z.; Li, G. Anal chim acta 2013, 764, 59-63.
CrossRef - Baniasadi, L.; Omidi, M.; Amoabediny, G.; Yazdian, F.; Attar, H.; Heydarzadeh, A.; Zarami, A. S. H.; Sheikhha, M. H. Enzy. and micro. Tech. 2014, 63, 7-12.
- Omidi, M.; Amoabediny, G.; Yazdian, F.; Habibi-Rezaei, M. EPL. 2015, 109, (1), 18005.
CrossRef - Ding, L.; Cheng, W.; Wang, X.; Ding, S.; Ju, H. JACS 2008, 130, (23), 7224-7225.
CrossRef - Ding, C.; Wei, S.; Liu, H. Chem. Eur. J. 2012, 18, (23), 7263-7268.
CrossRef - Shi, H.-W.; Wu, M.-S.; Du, Y.; Xu, J.-J.; Chen, H.-Y. Biosens. Bioelectron 2014, 55, 459-463.
CrossRef - Zhang, J.-J.; Zheng, T.-T.; Cheng, F.-F.; Zhang, J.-R.; Zhu, J.-J. Anal chem 2011, 83, (20), 7902-7909.
CrossRef - Shayeh, J. S.; Ehsani, A.; Ganjali, M.; Norouzi, P.; Jaleh, B. Appl. Surf. Sci 2015, 353, 594-599.
CrossRef - Shayeh, J. S.; Ehsani, A.; Nikkar, A; Norouzi, P; Ganjali, M.R; wojdyla, M. NJC 2015, 39, 9454-9460.
CrossRef - Salehifar, N; Shayeh, J. S.; Ranaei-Siadat, S, O; Niknam, N; Ehsani, A; Movahed, S. K. RSC Adv 2015, 5, 96130-96137.
CrossRef - Hashemi, M.; Yadegari, A.; Yazdanpanah, G.; Jabbehdari, S.; Omidi, M.; Tayebi, L. RSC Adv. 2016, 6, (78), 74072-74084.
CrossRef - Hashemi, M.; Yadegari, A.; Yazdanpanah, G.; Omidi, M.; Jabbehdari, S.; Haghiralsadat, F.; Yazdian, F.; Tayebi, L. Biotechnol. Appl. Biochem. 2016. doi:10.1002/bab.1487
CrossRef - Omidi, M.; Yadegari, A.; Tayebi, L. RSC Adv. 2017, 7, (18), 10638-10649.
CrossRef - Jemal, A.; Siegel, R.; Ward, E.; Hao, Y.; Xu, J.; Thun, M. J. CA: CA Cancer J Clin 2009, 59, (4), 225-249.
CrossRef - Sampieri, K.; Fodde, R. In Cancer stem cells and metastasis, Seminars in cancer biology, 2012; Elsevier: 187-193.
- Kristiansen, G.; Pilarsky, C.; Wissmann, C.; Kaiser, S.; Bruemmendorf, T.; Roepcke, S.; Dahl, E.; Hinzmann, B.; Specht, T.; Pervan, J. J. Pathol. 2005, 205, (3), 359-376.
CrossRef - Piazza, T.; Cha, E.; Bongarzone, I.; Canevari, S.; Bolognesi, A.; Polito, L.; Bargellesi, A.; Sassi, F.; Ferrini, S.; Fabbi, M. J. Cell Sci 2005, 118, (7), 1515-1525.
CrossRef - Omidi, M.; Amoabediny, G.; Yazdian, F.; Habibi-Rezaei, M. Chin. Phys. Lett 2015, 32, (1), 018701.
CrossRef - Zhang, J.; Lei, J.; Pan, R.; Leng, C.; Hu, Z.; Ju, H. Chem Com 2011, 47, (2), 668-670.
CrossRef - Wang, X.; Ju, J.; Li, J.; Li, J.; Qian, Q.; Mao, C.; Shen, J. Electrochim Acta 2014, 123, 511-517.
CrossRef - Chen, X.; Wang, Y.; Zhang, Y.; Chen, Z.; Liu, Y.; Li, Z.; Li, J. Anal chem 2014, 86, (9), 4278-4286.
CrossRef - Hedjazi, Y.; Omidi, M. J. Agr. Sci. Tech. 2008, 10, 205-214.

This work is licensed under a Creative Commons Attribution 4.0 International License.
![]()
A New Edition of Web of Science
Journal Impact Factor
2022: 0.5
Five Year: 0.8
Journal is Indexed in

Cabells Whitelist
![]()


