Simultanious Determination of Related Organic Impurities of Ibuprofen and Paracetamol in Combination Solid Dosage form by Rp-Hplc With Qbd Approach
1Analytical Research and Development, Dr. Reddy’s Laboratories, IPDO, Bachupally, Hyderabad-500072.India.
2Center for Chemical Sciences and Technology Institute of Science and Technology Jawaharlal Nehru Technological University, Kukatpally, Hyderabad -500 085.India.
Corresponding Author E-mail: ashokchem2000@gmail.com
DOI : http://dx.doi.org/10.13005/ojc/330349
Download this article as:
![]()
A stability indicating QbD based gradient method was developed and validated with the concept of quality by design (QbD) and with help of design of experiments (DoE) tool for the simultaneous determination of related organic impurities of Ibuprofen and Paracetamol in a combination solid oral dosage form by reverse phase high performance liquid chromatography (RP-HPLC). The most important critical quality attributes (CQA) of the developed test method were chosen and were evaluated by using “Design-Expert® 8” software tool with a quadratic mode of central composite design (CCD). The separation between all known impurities was achieved using “X-Terra RP18, 250-mm × 4.6-mm, 5-µm column with a 1.0 mL/min flow rate of gradient elution. The UV detection wavelength was used as 220 nm. The method validation is carried out as per ICH guidance, and the parameters include precision, accuracy, specificity, linearity, detection limit (DL), quantitation limit (QL), and robustness.
KEYWORDS:Paracetamol; QbD; Design of experiments
Introduction
Ibuprofen [(RS)-2-(4-(2-Methylpropyl) phenyl) propanoic acid] and Paracetamol [N-(4-hydroxyphenyl) ethanamide] are often sold in a form of combination oral dosage. The recommended dose of Ibuprofen is 1200 mg/day and Paracetamol is 4000 mg/day. Ibuprofen is category of non-steroidal anti-inflammatory drug (NSAID) which can be used to relief a pain, fever and inflammation. And Paracetamol is a generally used medicine to treat a pain and fever.
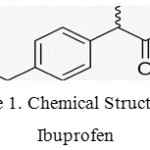 |
Figure 1: Chemical Structure of Ibuprofen. Click here to View figure |
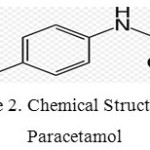 |
Figure 2: Chemical Structure of Paracetamol. Click here to View figure |
In current USP, no official monograph is available for Ibuprofen and Paracetamol, but only the limit test for limit of ibuprofen related compound C are reported for Ibuprofen tablets, UPS 39, page 4269 and Ibuprofen API, USP 39, page 4267 [1-2]. As per literature there are several assay methods are reported for simultaneous determination of Ibuprofen and Paracetamol [3]. And a separate impurity methods are reported for Paracetamol [4] and Ibuprofen [5]. But, no stability indicating method is reported for the simultaneous determination of related organic impurities of Ibuprofen and Paracetamol in a combinational dosage form with QbD approach.
Now-a-days, Quality-by-design (QbD) is become an important paradigm for the risk assessment of process R&D (synthesis), formulation processes and analytical research of pharmaceutical industry majorly. The concept of QbD (DOE) is recommended by ICH, Q8 (R2) guidance. The definition of QbD is as follows, “A systematic approach to development that begins with redefined objectives and emphasizes product and process understanding and process control, based on sound science and quality risk management” [6-11].
In accordance to U.S FDA requirement from 2013, MODR needs to be conducted together with method validation. But, a conference on “A QbD by U.S FDA in 2014”, the current (OFAT) approach in method development phase is not an appropriate method approach for routine analysis to be considered under regulatory flexibility [12-13]. The information which is specified in available literature papers was referred for guidance [14-16] and to investigate the impact of different variables on resolution (as method response) and to verify method performances.
The aim of current research work is to develop and validate a stability indicating method for the simultaneous determination of organic impurities in Ibuclin Tablets for (Ibuprofen and Paracetamol, 100 mg / 125 mg) by Quality by Design (QbD) approach.
Materials and Methods
Chemicals
Ibuprofen Standard, Paracetamol Standard and Ibuclin tablets (Ibuprofen and Paracetamol, 100 mg / 125 mg) were supplied by Dr. Reddy’s laboratories limited, Hyderabad, India. Acetonitrile (HPLC grade), methanol (HPLC grade), and ortho phosphoric acid (H3PO4, AR grade) were purchased from Merck, Darmstadt, Germany. The purified water (HPLC grade) was collected from Milli-Q Plus water purification system which is manufactured by Millipore.
Chromatographic Parameters
The chromatographic analysis was carried out on a Waters Alliance HPLC with a photodiode array detector. The output signal was recorded using Empower 2 Software. The column was used as “X-Terra RP18, 250 mm x 4.6 mm, 5 µm (Waters, USA)”. The separation was achieved using a gradient method elution. Mobile phase A was contained a mixture of pH 2.5 buffer solution (purified water pH adjusted to 2.5 with ortho phosphoric acid) and methanol in the ratio of 950:50 (v/v) and mobile phase B contained a mixture of pH 2.5 buffer solution, acetonitrile and methanol in ratio of 200:200:600 (v/v/v). The flow rate of mobile phase was set as 1.0 mL/min. The gradient program was set as: time (min) / % mobile phase B: 0.0/5, 5/5, 20/50, 40/50, 55/70, 85/70, 86/5, and 100/5. The column temperature was maintained at 25ºC and the detection was monitored at a wavelength of 220 nm. The injection volume was 10.0 mL. The diluent was a solution of ph 2.5 buffer solutions and acetonitrile in the ratio of 50:50 (v/v). All sample solutions were centrifuged by using the centrifuge: REMI R-8C BL. Design-Expert 8 software was used for to design the current research work.
Preparation of Test Solutions
The sample solution was prepared with a concentration of 1000 μg/mL of Ibuprofen, and the spiked sample solution is prepared by spiking all known impurities (11 impurities) at the concentration of 0.2% with respect to respective sample solution on a sample solution which had a concentration of 1000 μg/mL of Ibuprofen and 1250 μg/mL of Paracetamol. The placebo solution was prepared same as sample solution.
Method Development and Optimization
Selection of Detector and Wavelength
An individual stock solution of Ibuprofen and Paracetamol API and its impurities were prepared in diluent and scanned using a photodiode array detector (PDA) in the range of 200 nm ~ 400 nm. The spectra of each component was verified, and found that all the impurities showing absorbance maximum at about 220 nm. Hence, 220 nm was selected for method detection.
Finalization of Sample Concentration and Method Optimization
Initial chromatographic conditions selected for method are reversed-phase HPLC with X-Terra RP18, 150 mm × 4.6 mm, 5-μm column with isocratic flow. The mobile phase is mixture of pH 3.0 buffer and acetonitrile (70:30 (v/v)). The flow rate is 1.0 mL/min and the CTO is at 25°C. With the above conditions paracetamol and its impurities eluted below 1min RT and resolution between Ibuprofen impurities is not good. To meet resolution criteria between the closely eluting peaks, the buffer concentration was increased to 70%, even though resolution between peaks found to be below 2.0.
Due to the inefficient nature of the isocratic mode, the gradient program was used to achieve the good separation, resolution > 2, between all peaks, i.e 11 impurities and 2 active peaks. Separation tried with same column and with by varying pH of buffer A & B, gradient program also changed to get resolution (R) > 2 . Finally, the optimized chromatographic condition were as mentioned in “Chromatographic Parameters” section .
All impurity peaks separated with (R) > 2 resolution. No interference was observed at Paracetamol, Ibuprofen and all impurities due to the blank (diluent) and other excipients (placebo) which are used in the tablets formulation. The typical chromatogram of all impurities spiked sample solution was shown in Figure 3.
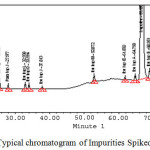 |
Figure 3: Typical chromatogram of Impurities Spiked sample . Click here to View figure |
Experimental Design for Qbd Study
Quality by Design
A QbD has different tools such as, (1) Analytical Target Profile (ATP), (2) Critical Quality Attributes (CQA), (3) Risk assessment, (4) Method Optimization and Development with DoE, (5) MODR (Method Operable Design Region), (6) Control Strategy and Risk assessment, (7) Analytical QbD Method Validation and (8) Continuous Method Monitoring. The pharmaceutical QbD is a systematic approach for analytical method development, to begins with tentative method conditions to achieve operating ranges. A broad knowledge obtained from the QbD process is used to establish a method operable design region (MODR). Analytical method development tools are identified and tabulated in Table 1.zZ
Table 1: QbD tools identification in Analytical method Development.
| S No | QbD Tool | Analytical Method | RS |
|
1 |
Quality Target Product Profile (QTPP) | Analytical Target Profile (ATP) |
|
|
2 |
Critical Quality Attributes (CQA) | Critical Method Attributes (CMA) |
|
|
3 |
Critical Process parameters (CMP) | Critical method parameter (CMP) |
|
Selection of Factors and Responses
The method variables are evaluated and listed as follows: (1) flow rate of mobile phase: 0.5 mL/min, and 1.5 mL/min and (2) column temperature: 25°C and 35°C which given in Table 2.
The resolution between (1) Impurity D & Impurity L, (2) Impurity A & Ibuprofen, and (3) Ibuprofen & impurity B was used as a response in experimental design as controlling response, which is expected to affect and control method responses.
The critical method parameters (CMP) and method attributes are identified from the RA and set low and high factor limits for experimentation along with acceptance limits for attributes. Three responses are evaluated; R1, R2 and R3. R1 is the resolution between Ibuprofen impurity-D and Impurity-L, R2 is the resolution between Ibuprofen impurity-A and Ibuprofen and R3 is the resolution between Ibuprofen and Ibuprofen impurity-b. The factors are presented in Table 2.
Table 2: CMPs and Levels
|
Name of Factor |
Low Condition |
Original Condition |
High Condition |
|
Flow rate (mL/min) |
0.5 |
1.0 |
1.5 |
|
Column Temperature (ºC) |
25 |
30 |
35 |
Selection of DOE and Design Layout
The present research work was designed with help of “Design-Expert® 8” software tool with a quadratic mode of central composite design (CCD), (3n-1 = 13 runs with 2 factors) to identify the optimum conditions for separation of impurities of ibuprofen during method development. This factorial design can give full evaluation of individual impurities resolutions. The experimental observations along with Factorial Design (DoE) plan and the statistical analysis is given is shown in Table 2. The MODR (Method Operable Design Region) was defined using all variables. From MODR suitable method conditions were selected and subjected to verification for method performance like accuracy and precision (NLT 2 resolution) and robustness as targeted response.
Results and Discussion
The quantitative determination of organic impurities in a combination drug product with a shorter run time and with a stability indicating characteristics is a critical task for analytical scientist(s). However, we have been taken it as a challenge and was developed a single testing method for separation of 13 active peaks (11 known impurity peaks and 2 active peaks), see Fig. 3.
DOE – Statistical Response Analysis
Each of responses was analyzed using “Design-Expert® 8”. The residual values from the corresponding Diagnostics for each response are presented in Table 3.
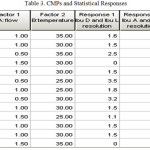 |
Table 3: CMPs and Statistical Responses. Click here to View table |
The method assessment for attaining CQA of the product is shown in Table 2. To initiate the QbD work, resolution between Ibuprofen impurity A and Ibuprofen were considered in the selection of input variables for factorial design (2n-1). Mid points were added to find the curvature effect. Once the curvature effect was significant, CCD was adopted to get response surface to optimize design. C18 column was chosen as stationary phase due to wide acceptability pharmaceuticals and high reproducibility. In initial run, 70% buffer was used for retaining paracetamol and its impurities. Column temperature, Buffer, methanol components were considered as qualitative variable in water and were controlled.
In order to achieve the complete scientific understanding between method results and input variables, a central composite design was designed and performed. The various variables and their levels were shown in Table 2. The obtained experimental results was subjected various statistical parameter for better understanding and was found to be a nonlinear relationship between input variable and response. The statistical data analysis is shown in Fig. 4, Fig. 5 and Fig. 6.
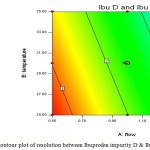 |
Figure 4: Contour plot of resolution between Ibuprofen impurity D & Ibuprofen impurity L. Click here to View figure |
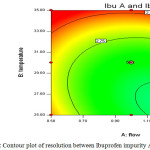 |
Figure 5: Contour plot of resolution between Ibuprofen impurity A & Ibuprofen. Click here to View figure |
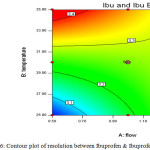 |
Figure 6: Contour plot of resolution between Ibuprofen & Ibuprofen impurity B. Click here to View figure |
The resolution between Impurity-D and Impurity-L is sensitive towards high flow rate and high column temperature. The resolution between Impurity-A and Ibuprofen is independent of flow and column temperature variations. The resolution between Impurity-B and Ibuprofen is independent of flow and column temperature variations. The proposed analytical parameters are suitable to work at desired efficiency with allowable practical variations in day to day operations.
Method Validation
Validation of method performed as per ICH guidelines (20).
System Suitability
Diluted standard (prepared at 2ppm of Ibuprofen & 2.5ppm of paracetamol in diluent), and resolution solution (prepared with 2ppm of Ibuprofen impurity A & 1000ppm of Ibuprofen) were injected as part of system suitability and all the system suitability parameters like standards tailing factor, plate counts, % RSD for average areas of standard peaks and resolution between Impurity A & Ibu are found to be within the acceptable criteria.
Specificity
To know the method capability, intrinsic stability of the molecules and separation of Impurites in the method performed force degradation studies on the sample with a concentration 1000 ppm of Ibuprofen and 1250 ppm of Paracetamol, on Active pharmaceutical ingredient. Performed forced degradation study on final finished product formulations to know the placebo peaks interference with known impurities and formation of new impurities in the final formula. Taken tablets on to a mortar vessel crushed in to fine powder and prepared sample. The degradation performed in Hydrolytic condition, Oxidative condition, Thermolytic condition and Photolytic conditions.
In the Hydrolytic condition Sample Exposed to acid and Base conditions. For acid condition sample was treated with Hydrochloric acid with concertation of 0.1N (0.1N HCl) at 60°C for about 30 min, for base sample was treated with concertation of 0.1N sodium hydroxide at 60°C for about 10min. and for Humidity condition sample exposed to 90%RH for about 7 days.
In the Oxidative condition sample was exposed to 5% hydrogen peroxide for about 2hrs at 60ºC and Thermal condition sample exposed to 105°C for about 3hours finally the Photolytic codtions sample exposed to 1.2 million lux hours followed by 200 watt hours-m−2 UV and visible light.
Precision
The precision was performed by preparing six individual sample solutions as per the test method and spiked the Impurites with a concentration of 0.2% then injected in to HPLC and calculated % of each individual impurity the % RSD of six sample solutions. The ruggedness (intermediate precision) of the method was also evaluated using different analysts and a different instrument in the same laboratory on a different day. Also, the precision and intermediate precision study was performed for unknown impurity by spiking 2.0 μg/mL of Ibuprofen and 2.5 μg/mL of Paracetamol on the placebo as per test preparation.
Accuracy
The accuracy of the method was demonstrated at five different concentration levels by preparing each level in triplicate preparations. The analysis was carried out by spiking all of the impurities on the Finished product sample at 0.1%, 0.2%, 0.5%, 0.75%, and 1.0% of the test concentration (1000 μg/mL of Ibuprofen & 1250 μg/mL of Paracetamol ). Also, the accuracy study was performed for unknown impurities by spiking both the APIs on the placebo at the above-mentioned levels. The percentage mean recoveries at each level for all of the impurities, Paracetamol and Ibuprofen were calculated.
Detection Limit (DL) and Quantitation Limit (QL)
To demonstrate the sensitivity of the method Established The DL and QL for all known impurities and both APIs by using the signal to noise ratio method and the values are S/N of 3:1 and 10:1, respectively, To prove the repeatability of the method at QL level prepared six samples preparation as per the test method and spiked the impurities at QL level and injected in to the HPLC. Then calculate the % RSD and recovery of Impurites at QL concentrations. In the same way by spiking both the APIs on the placebo at the above-mentioned levels performed precision and accuracy and calculated the % RSD and recovery of APIs at QL concentrations
Linearity
To demonstrate the Linearity of the method and detector response prepared linearity of solutions of Impurites and APIS from the LOQ level to 1.0% of the test concentration (six different levels are prepared) and injected in to the HPLC as per the test method conditions . Calculated the linearity of test method by taking , The peak area versus concentration of each level data were subjected to least-squares linear regression analysis. The calibration curve was drawn by plotting impurity areas against the concentration expressed in μg/mL.
Robustness
To prove the robustness of the method deliberately changed the chromatographic conditions from as such method to lower side and higher side (flow rate and column temperature), and injected the sample solutions. Observed the system suitability results in all conditions. All peaks are ( impurity peaks and active peaks) were adequately resolved and elution orders remained unchanged. The resolutions between adjacent peaks were found to be satisfactory, see Table 3.
Conclusion
Analytical method development and validation by the QbD approach was played a key role in the quantitative determination of organic impurities of Ibuprofen and Paracetamol and to ensuring the product quality. The outcome of the QbD is the understanding from product development to commercial production. Scientist can easily identify the risk initially so that quality can be increased. The gradient HPLC method developed for the determination of Ibuprofen and paracetamol impurities in pharmaceutical combination dosage form was found to be specific, precise, linear, accurate, and robust. The developed method can be used for the stability analysis of formulated samples.
Acknowledgements
The author wish to thank the management of Dr. Reddy’s Laboratories Limited, Hyderabad, India.
References
- United States Pharmacopeia monograph, Ibuprofen API, USP 39. 2016, 4267.
- United States Pharmacopeia, Ibuprofen Tablets, USP 39. 2016, 4269.
- Prasanna Reddy Battu, MS Reddy. RP-HPLC Method for Simultaneous Estimation of Paracetamol and Ibuprofen in Tabets. Asian J Research Chem. 2009, 2: 70–72.
- Rao RN, Narasaraju A. Rapid separation and determination of process-related substances of paracetamol using reversed-phase HPLC with photo diode array as a detector. Anal Sci. 2006, 22: 287-292.
CrossRef - Cafiglioli G, Valeraia P, Brunella P, Sergio C, Attilia A, et al. Identification of degradation products of Ibuprofen arising from oxidative and thermal treatments. J Pharm Biomed Anal. 2002, 30: 499–509.
CrossRef - International Conference on Harmonization of technical requirements for registration of pharmaceuticals for human use, ICH harmonized tripartite guideline, Draft Step 4. Pharmaceutical Development Q8 (R1). 2008.
- Yu L. Pharmaceutical quality by design: Product and process development, understanding and control. Pharm Res. 2008, 25:781–791.
CrossRef - Lee SL, Raw AS, Yu L. Significance of drug substance physiochemical properties in regulatory quality by design. In Drugs and the Pharmaceutical Sciences 78 (Preformulation in Solid Dosage Form Development), London: Informa Healthcare. 2008, 571–583.
- Mhatre R, Rathore AS. Quality by design: An overview of the basic concepts. In Quality by design for biopharmaceuticals. New York: Wiley. 2009, 1–8.
CrossRef - International Conference on Harmonization (ICH). Tripartite Guidelines, ICH Q8 (R2): Pharmaceutical Development. 2009.
- International Conference on Harmonization (ICH). Tripartite Guidelines, ICH Q9: Quality Risk Management. 2006.
- Chatterjee S. QbD Consideration for Analytical Methods – FDA Perspectives, US IFPAC Annual Meeting; Baltimore. 2013.
- Alexander Schmidt H. Validation and Transfer, Berlin, 4th Annual Conference on Analytical Method Development, Germany. 2014.
- Lewis GA, Mathieu D, Phan Tan L. New York: Marcel Dekker;. Pharmaceutical Experimental Design. 1999.
- Wen-Ying H, Pei-Chi L, Ling-Kuei H, Li-Ping L, Wayne CL. Stability studies of ascorbic acid 2-glucoside in cosmetic lotion using surface response methodology. Bioorg Med Chem Lett. 2013; 23:1583–7.
CrossRef - Srinubabu G, Raju CH, Sarath N, Kiran Kumar P, Seshagiri Rao JV. Development and validation of a HPLC method for the determination of voriconazole in pharmaceutical formulation using an experimental design. Talanta. 2007,71,1424–9.
CrossRef - Orlandini S, Pinzauti S, Furlanetto S. Application of quality by design to the development of analytical separation methods. Anal Bioanal Chem. 2013,50,405:443.
- Beg S, Sharma G, Katare OP, Lohan S, Singh B. Development and validation of stability-indicating liquid chromatographic method for estimating olmesartan medoxomil using quality by design. J Chromatogr Sci. 2015, 53, 1048–59.
CrossRef - Kurmi M, Kumar S, Singh B, Singh S. Implementation of design of experiments for optimization of forced degradation conditions and development of a stability-indicating method for furosemide. J Pharm Biomed Anal. 2014, 96, 135–43.
CrossRef - ICH – Q2 (R1) Guideline on Validation of Analytical Procedure: Text and Methodology; 2005.


![]()


