Kurdistan Native Acorn as Abundant Useless Raw Material to Produce Activated Carbon Adsorbent: Application in Removal of Fe (III) Ion from Aqueous Solutions, Thermodynamic and Kinetic Studies
Asra Alaghebandi and Bahram Ebrahimi
Department of Chemistry, Faculty of Science, Sanandaj Branch, Islamic Azad university, Sanandaj, Iran.
Corresponding Author E-mail: bahram302.ebrahimi@gmail.com
DOI : http://dx.doi.org/10.13005/ojc/330350
Thermochemical method was used to prepare activated carbon from Kurdistan native acorn as abundant raw material. A two steps temperature program was applied for pyrolysis and activation of chemical oxidized raw material in 350 and 700 oC respectively. Surface functional groups were detected in FT-IR spectrum of adsorbent. Also, Formation of uniform porous structure observed in SEM images. Specific surface area (SBET), pore volume (Vp) and average pore diameter were determined 520.14 m2/g, 0.235 cm3/g and 2.8 nm respectively. Effective parameters on batch experiments such as adsorbent dosage, contact time, initial pH and Fe (III) concentration were optimized. Thermodynamic studies showed that the process was spontaneous (∆G0<0) and endothermic with high amounts of ∆H0 and positive ∆S0. Adsorption of Fe (III) was obeyed from Langmuir model with maximum adsorption capacity 42.12 mg g-1. Pseudo-second order model was best kinetic model (R>0.995) to describe kinetic of adsorption process of Fe (III).
KEYWORDS:Adsorption; Activated carbon; Ferric ion; Kurdistan Acorn; West Iran
Download this article as:| Copy the following to cite this article: Alaghebandi A, Ebrahimi B. Kurdistan Native Acorn as Abundant Useless Raw Material to Produce Activated Carbon Adsorbent: Application in Removal of Fe (III) Ion from Aqueous Solutions, Thermodynamic and Kinetic Studies. Orient J Chem 2017;33(3). |
| Copy the following to cite this URL: Alaghebandi A, Ebrahimi B. Kurdistan Native Acorn as Abundant Useless Raw Material to Produce Activated Carbon Adsorbent: Application in Removal of Fe (III) Ion from Aqueous Solutions, Thermodynamic and Kinetic Studies. Orient J Chem 2017;33(3). Available from: http://www.orientjchem.org/?p=33778 |
Introduction
Iron is the most common used metal in the world caused to abundant and mechanical properties. This metal is used in many modern industrial instruments and possibility it releasing is very high in natural waters1, mining 2, metallurgical 3 and a range of other industrial wastes4. Although, iron is existed commonly in an insoluble forms but at appropriate conditions it can be converted soluble forms such as Fe (III) that often result in water contamination in excessive concentration. High concentration of ferric ion causes the turbidity, unpleasant taste and odor and creation difficulties in distribution piping systems by clogging 5. Thus, searching for effective Fe (III) treatment methods can be attractive in related fields.
Different treatment methods have been used to remove and eliminate of Fe (III) from aqueous solutions such as chemical precipitation, ion exchange, filtration and adsorption6-10. Among these methods, adsorption is widely used due to free from some limitations including ineffective, generation of secondary pollutions and high cost. Also, existence of various adsorbent with different sorption properties is important advantage in this method11-14.
Activated carbon is traditional and frequently used adsorbent to remove different range of contaminants especially organic compounds. This adsorbent is produced from pyrolysis of carbon materials such as wood, coal, kernel or husk of fruits and then under thermal activation, the porous structure will form with high surface area. Capability of this adsorbent to eliminate gases 15, 16, metal ions 17, 18 and organic compounds 19, 20 has been shown in different studies. Preparation of activated carbon from abundant useless raw materials is accordance with environmental protection policies. Indeed, resulted adsorbent include additional economic and environmental values.
In this study, activated carbon adsorbent was prepared from acorn as native abundant natural raw material in Kurdistan as west province of Iran. Thermochemical method was used by using H3PO4 as chemical activation agent. In a batch process, capability of adsorbent was tested to remove Fe (III) ions from aqueous solutions. Also, thermodynamic and kinetic studies of adsorption process were done for further investigations.
Experimental
Reagents and Solutions
Acorn samples were collected from native oak trees of Kurdistan (western region of Iran) as precursor raw material. H3PO4 was obtained from Merck Co. (Darmstadt, Germany) and used as chemical oxidation and activator in preparation process. HCl 0.1 M and NaOH 0.1 M solutions were used to adjust the pH of solutions. An aqueous stock standard solution of Fe (III) at a concentration 500 mg/L was prepared by the dissolution of the proper amount of FeCl3.6H2O (pH=2). Potassium thiocyanate (KSCN) was used as source of thiocyanate ion to form coloring complex with Fe (III). Working standard solutions were prepared daily through serial dilutions of the stock solution with deionized water prior to analysis. All chemicals employed in this work were of analytical reagent grade used as received.
Instruments
The shape and surface morphology of samples were investigated by field emission scanning electron microscope (FESEM, Hitachi S4160, Japan) under an acceleration voltage of 15 kV. The specific surface area of prepared activated carbon adsorbent was measured by the BET method (Beckman Coulter, model SA3100, USA) with N2 chemi sorptions. The BET surface area, total pore volume, and micropore area were achieved from the adsorption isotherms. Fourier transform infrared spectroscopy (perkin Elmer, USA, Spectrum RXI) analysis was done to identify the surface functional groups of the adsorbent. A laboratory centrifuge (Heraeus, Labofuge 400 model, Germany) was used to accelerate the phase separation after contact of adsorbent with Fe (III) solutions. The pH measurements were done using pH/Ion meter model-682 (Metrohm, Switzerland) and absorption studies were carried out using Jusco (UV-Visible spectrophotometer model V-570, Japan) for concentration determination of Fe (III) as thiocyanate complex. Isotope hot plate stirrer (Fisher Scientific, USA), was used for stirring. The samples were weighted using an analytical balance (Citizen, CY 204, Poland).
Preparation Method of Adsorbent
The acorn was grounded and sieved (20-50 mesh) to obtain particles with 300-850 µm of range of diameters as standard meshing scales. Then, the fine particles were washed with distilled water. Afterwards, the grounded material dried in an air-supplied oven at 90oC for 12 h. The appropriate amounts of dried particles were weighted and rinsed in concentrate H3PO4 85% (w/w) as chemical oxidation reagent to dehydrate and oxidize the sample under stirring for 1.5 h. After decantation of H3PO4, the raw material was put in cylindrical furnace/reactor under 200 cm3/min flows of N2 to face a temperature program with two distinctive steps, as: from 25oC rising at 10oC /min to 350oC kept for 90 min, rising at 25oC /min to 700oC kept for 30 min. After naturally cooling down the furnace/reactor, the produced activated carbons were washed several times by distilled water and completely dried.
Elimination of fe (III) Ions
In a batch process, removal capability of activated carbon sample was examined to eliminate Fe (III) ions. All experiments were done at 25oC. At optimum conditions the appropriate amounts of adsorbent were added to solution of analyte. Then at right time, under magnetic stirring, the solutions of Fe (III) containing adsorbent were agitated. Adsorbent was separated by passing the sample solution through a filter paper and refined solution centrifuged. Then, potassium thiocyanate solution include thiocyanate ions as stoichiometric quantity was added to non-adsorbed Fe (III) solution after separation from the adsorbent to produce FeSCN red complex. Concentration of Fe (III) was determined by using a calibration curve obtained from UV-vis spectrophotometer (by using thiocyanate iron complex absorptions in ƛ= 447 nm). For this, Then, the percentage Fe (III) removal efficiency, R and amount of ion adsorbed per unit weight of adsorbent at any time, qt (mg/g) were calculated from equations 1 and 2:
where C0 (mg L-1) and Ct (mg L-1) are initial ion concentration at time t, V is the volume of the solution (L) and W is the mass of the adsorbent (g).
Results and Discussion
Characterization of Adsorbent
Fig. 1 shows the SEM micrograph of prepared activated carbon. It can be seen that the porous surface has well developed and formed with pore diameter mostly in the range of nano and micro sizes. This image is good sign to show capability of selected raw material to convert porous activated carbon adsorbent.
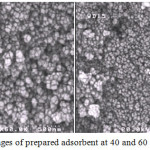 |
Figure 1: SEM images of prepared adsorbent at 40 and 60 k × magnifications. |
BET adsorption experiment has done to determine some important characteristics of the adsorbent. The specific surface area (SBET), average pore diameter and pore volume (Vp) were determined 520.14 m2 g-1, 2.87 nm and 0.235 cm3 g-1 respectively. These results showed that thermochemical used method have been effective to develop porous structure on surface adsorbent. The pore volume percent distribution curve of activated carbon presents in Fig.2 based on nitrogen adsorption isotherm at 77 K. According to the International Union of Pure and Applied Chemistry (IUPAC), these created pores were in the micro and mesopores range that classified as micropores (<2 nm diameter), mesopores (2–50 nm diameter) and macropores (>50 nm diameter) 21.
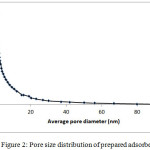 |
Figure 2: Pore size distribution of prepared adsorbent. |
The IR spectrum of prepared activated carbon was revealed the peaks in different wave numbers such as 3441 cm-1 (non-acidic O-H), 2952, 2853 cm-1 (aliphatic C-H), 1734 cm-1 (ester C=O) and 1342 cm-1 (ester C-O). Fig.3 shows the IR spectrum of adsorbent. These functional groups surely affected on the adsorption property of adsorbent. Indeed, interaction forces between adsorbent and Fe (III) ion are related to surface functional groups of adsorbent.
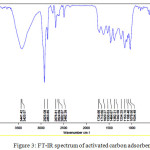 |
Figure 3: FT-IR spectrum of activated carbon adsorbent. |
Fe (III) Removal Batch Procedure Optimization
Effect of Contact Time
Investigation of time effect is necessary in adsorption experiments due to mass transfer phenomenon. Fig. 4 shows the effect of time on the adsorption process. This result can be related to accessibility of adsorption sites on the external surface of adsorbent that lead to sorption of most of Fe (III) ions with highest slope. After saturation of external sites by adsorbed ions, diffusion of remaining Fe (III) from solution to interior sites was time consuming and slow. The extraction efficiency remained almost constant after 15 min. Therefore, the contact time of 15 min was selected as an optimum amount.
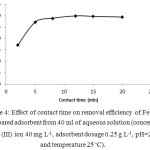 |
Figure 4: Effect of contact time on removal efficiency of Fe (III) by prepared adsorbent from 40 ml of aqueous solution (concentration of Fe (III) ion 40 mg L-1, adsorbent dosage 0.25 g L-1, pH=2 and temperature 25◦C). |
Effect of Adsorbent Dosage
To investigate the effect of adsorbent dosage, various amounts 2-25 mg of adsorbent were used and variations of ion removal were evaluated. Fig. 5 shows the obtained results. As it can be seen, the required adsorbent to reach the graphs to plateau (steady state of process) was 10 mg. Adsorbents with high adsorption capacity can remove solutes in low quantity. The necessary amounts of adsorbent to complete the process were not high as it is an advantage of proposed method.
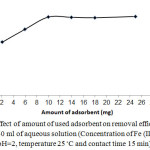 |
Figure 5: Effect of amount of used adsorbent on removal efficiency of Fe (III) from 40 ml of aqueous solution (Concentration of Fe (III) ion 40 mg L-1, pH=2, temperature 25◦C and contact time 15 min). |
Effect of Ph
FT-IR spectrum of activated carbon revealed the some functional groups that there can be affected by initial pH of solution and surely alter the removal efficiency of Fe (III) ion. The effect of the pH value is shown in Figure 6. At strong acidic solutions, extraction efficiency was decreased which can be related to protonation of surface acidic groups of adsorbent which, in turn, decrease the tendency of Fe (III) to adsorb on adsorption sites with similar charge. Additionally, at strong alkaline solution hydrolyzing of Fe (III) surely occurred that decreasing of removal efficiency. Accordingly, pH 5 was selected for subsequent studies.
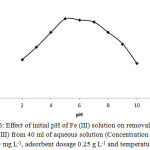 |
Figure 6: Effect of initial pH of Fe (III) solution on removal efficiency of Fe (III) from 40 ml of aqueous solution (Concentration of Fe (III) ion 40 mg L-1, adsorbent dosage 0.25 g L-1 and temperature 25◦C). |
Fe (III) Concentration Effect
The initial concentration of Fe (III) was changed from 10 to 120 mg/L at given pH and fixed temperature to evaluate the effect of initial ion concentration on the removal efficiency of the adsorbent. Fig.7 shows the results. As it can be seen, increasing ion concentration up to given limits didn’t significantly effect on removal efficiency. Over these limits, due to saturation of adsorption sites of the adsorbent, decreasing of sorption took place more rapidly. Thus, the prepared activated carbon has a good capacity for sorption of Fe+3 ions over an approximately vast range (10.0 to 80.0 mg/L) with no high decrease in removal efficiency.
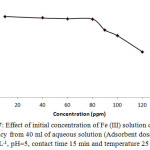 |
Figure 7: Effect of initial concentration of Fe (III) solution on removal efficiency from 40 ml of aqueous solution (Adsorbent dosage 0.25 g L-1, pH=5, contact time 15 min and temperature 25◦C). Click here to View figure |
Effect of Temperature
Adsorption experiments were carried out at different temperatures (15 to 60 ◦C) to investigate the effect of temperature on the removal efficiency of adsorbent. Fig. 8 shows the results. By increasing the temperature, the removal efficiency was increased that is a sign of endothermic of process. This result maybe expectable due to agitate of Fe+3 ions to overcome the effects of mass transfer as a restricting force in adsorption process.
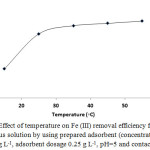 |
Figure 8: Effect of temperature on Fe (III) removal efficiency from 40 ml of aqueous solution by using prepared adsorbent (concentration of Fe (III) ion 80 mg L-1, adsorbent dosage 0.25 g L-1, pH=5 and contact time 15 min)
|
Thermodynamic parameters were determined to further analyze the effect of temperature on the sorption of Fe (III). The related equations:
Where ∆G0, ∆H0 and ∆S0 are the change in Gibbs free energy, enthalpy and entropy respectively, T is temperature in kelvin and b is called adsorption affinity obtained from a combination of Eqs. (3) and (4):
![]()
Where qe and Ce are amount of ion adsorbed per unit mass of adsorbent (mg/g) and equilibrium concentration (mg/L) respectively.
From plot of
![]()
vs.
![]()
using Eq. 5, enthalpy and entropy of adsorption were calculated. Then, ∆G0 was calculated at different temperatures. The obtained thermodynamic values are shown in Table 1. The ∆H0 is positive (endothermic) that supports the results in Fig.8. High amounts of ∆H0 are attributable to a big interaction force like chemisorption that leads to sorption of Fe (III). Also the positive value of ∆S0 revealed that adsorbed ion species on porous structure of activated carbon are random.
Table 1. Thermodynamic parameters for the adsorption of Fe (III) on prepared activated carbon
| T (K) | ∆G0 (KJ/mol) | ∆H0 (KJ/mol) | ∆S0 (J/mol K |
| 288 | -1.97 | ||
| 298 | -4.85 | 80.74 | 287.22 |
| 308 | -7.72 | ||
| 318 | -10.59 |
Adsorption Isotherm Studies
Isotherm models contain some constants that represent the property of surface and affinity of adsorbent to sorption of solute species. The adsorbent with fixed dosage was contacted with solutions containing various concentrations of Fe (III) for 24 hours at room temperature. Then, the obtained equilibrium data were fitted to well-known isotherm models such as Langmuir and Freundlich (table 2).
Langmuir isotherm model -as an ideal model- is based on this assumption that maximum adsorption corresponds to a saturated monolayer of adsorbate species on the adsorbent surface in which the energy of adsorption is constant and there is no moving of adsorbate in the surface 22. The linear form of the Langmuir isotherm equation is given as equation:
![]()
where Ce (mg/L) is the equilibrium concentration of Fe (III) ion in solution, qe (mg/g) is the equilibrium sorption capacity of adsorbent, Qm (mg/g) is the Langmuir constant related to adsorption capacity, and KL (L/mg) is the Langmuir adsorption constant related to the energy of sorption, which represent the affinity between the adsorbent and the adsorbate. Thus, a plot of Ce/qe versus Ce was used to calculate Qm and KL from slop and intercept of it respectively. The Freundlich model is based on adsorption on a heterogeneous surface with different affinities. The linear form of Freundlich model 23 is given as equation:
![]()
where qe (mg/g) is the amount of ion adsorbed at equilibrium, Ce (mg/L) is the adsorbate equilibrium concentration, Kf ((mg/g)/(mg/L)n) is the Freundlich constant related to adsorption capacity, and n is the isotherm constant revealing the sorption intensity of the adsorbent, while the 1/n factor is a sign of heterogeneity. These constants are determined from the intercept and slope of linear plot of log qe vs. log Ce.
From the plots of three isotherm models, the related constants are determined with R2 (correlation coefficient) for are shown in table 5. Obtained correlation coefficients revealed that, Langmuir isotherm model is the best model (R2>0.99) to describe the adsorption process of Fe (III) ions on the adsorbent. So, adsorption of ion has occurred as monolayer adsorption on adsorbent surface.
Table 2. Langmuir and Freundlich isotherm parameters for Fe (III) on adsorbent
| Langmuir | Freundlich | ||||
| R2 | KL (mL/g) | Qm (mg/g) | R2 | Kf ((mg/g)/(mg/L)n) | 1/n |
| 0.998 | 0.0742 | 42.12 | 0.905 | 41.26 | 0.28 |
Sorption Kinetics
In adsorption process, analysis of kinetic data is important to determine the solute uptake rate and also to specify which parameters control the kinetic of process. Especially, adsorption kinetics is the base to scale up the process or change it to fixed-bed or any other flow-through systems. Several kinetic models have been introduced and applied to evaluate the controlling mechanism of solute adsorption from solutions 24.
In this study, to analyze the adsorption rate of Fe (III) onto the adsorbent, the pseudo-first-order and pseudo-second–order models were applied based on the obtained data and according to their equations. Lagergren’s first order rate equation is the earliest known model to describe the adsorption rate based on adsorption capacity. The linear form of Lagergren’s first order rate equation is as follows 25:
![]()
Where qe and qt are the values of amount adsorbate per unit mass (mg g-1) at equilibrium and at any time t, respectively and k1 is the pseudo first order sorption rate constant (min-1). Equation of straight line of log (qe _ qt) versus t, give us k1 and qe (equilibrium adsorption capacity cal.) from slope and intercept respectively. Pseudo-second-order model- as linear form -can be written as follows:
![]()
where k2 is the equilibrium rate constant for pseudo-second-order sorption (g mg-1 min-1) 26. The terms of qe and k2 can be obtained from slop and intercept of plot of t/qt versus t. The obtained data are shown in table 3. As it can be seen, the obtained R2 from pseudo-second-order model is very close to unity for Fe (III), indicating that the adsorption of process onto adsorbent is compliant with this model and that chemisorption is controlling the kinetic of process.
Table 3: Pseudo-first order and pseudo-second order kinetic model parameters for the adsorption of Fe (III)
| qe,exp | Pseudo-first order model | Pseudo-second order model | ||||
| (mg/g) | ||||||
| R2 | qe,cal | K1 | R2 | qe,cal | K2×103 | |
| (mg/g) | (1/min) | (mg/g) | (g/mg min) | |||
| 46.14 | 0.881 | 9.18 | 0.871 | 0.995 | 49.12 | 5.54 |
Conclusions
In the present study simple thermochemical method was applied to prepare activated carbon from Kurdistan native acorn (fruit of oak tree) as precursor abundant material. The adsorbent has good structural characteristics such as high surface area and good distribution porosity in the range of predominantly meso porous. The adsorption batch method has been successfully developed for removal of Fe (III) from aqueous solutions. Various effective parameters on batch adsorption have been investigated. At acidic pH (around 5.0) the proposed adsorbent has maximum removal efficiency. Thermodynamic studies showed that the adsorption process was endothermic and spontaneous with high ∆H0 that is a sign of big interaction force (chemisorption) and is consistent with kinetic pseudo second order model. Langmuir isotherm equation was the best model to fit experimental equilibrium data.
Acknowledgment
The authors are thankful to research deputy of Sanandaj branch of Islamic Azad University (IAUSDJ) and SAHA collection laboratories for financial and instrumental supports.
References
- Ahmetli, G.; Tarlan, E. J. Appl. Polym. Sci. 2007, 104, 2696–2703.
CrossRef - Gaikwad, R.W. J. Environ. Agric. Food Chem. 2010, 9, 1343–1350.
- McKevitt, B.; Dreisinger, D. Hydrometallurgy, 2009, 98, 116–121.
CrossRef - Agrawal, A.; Kumari, S.; Sahu, K.K. Ind. Eng. Chem. Res. 2009, 48, 6145–6161.
CrossRef - Onganer, Y.; Temur, C. J. Coll. Interf. Sci. 1998, 205, 241–244.
CrossRef - Khan, E.; Li,M.; Huang, C.P. Water Environ. Res. 2007, 79, 1858–1902.
CrossRef - Peters, R.W.; Ku, Y. J. Water Pollut. Contr. Fed. 1984, 6, 553–568.
- Kanzelmeyer, T.J.; Adama,C.D. Water Environ.Res. 1996. 68, 222–228.
CrossRef - Gode, F.; Pehlivan, E. J. Hazard. Mater. 2003, 100, 231–243.
CrossRef - Aksu, Z.; Alperis, I. Process Biochem. 2005, 40, 3031–3044.
CrossRef - Palomino, J. M.; Tran, D. T.; Kareh, A. R.; Miller, C.A.; Gardner, J.M.V.; Dong, H.; Oliver, S.R.J. J. Power Sources, 2015, 278, 141-148.
CrossRef - Guijuan, J.I.; Weiwei, B.A.O.; Guimei, G.A.O.; Baichao, A.N.; Haifeng, Z.O.U.; Shucai, G.A.N. Chin J. Chem. Eng. 2012, 20, 641-648.
CrossRef - Haibo, L.; Shuchuan, P.; Lin, S.; Tianhu, C.; Teng, B.; Ray, L. F. J. Colloid Interface Sci. 2013, 390, 204-210.
CrossRef - Wei, W.; Yan, M.; Aimin, L.; Qing, Z.; Weiwei, Z.; Jing, Jin. J. Hazard. Mater. 2015, 294, 158-167.
- Lemus, J.; Martin-Martinez, M.; Palomar, J.; Gomez-Sainero, L.; Gilarranz, M.A.; Rodriguez, J.J. Chem. Eng. J. 2012, 15, 246-254.
CrossRef - Nowicki, P.; Wachowska, H.; Pietrzak, R. J. Hazard. Mater. 2010, 181, 1088-1094.
CrossRef - Norasikin, S.; Khairiraihanna, J.; Hanapi, M. Microporous Mesoporous Mater. 2014, 194, 38-45.
CrossRef - Awwad, N.S.; El-Zahhar, A.A.; Fouda, A.M.; Ibrahium, H.A. J. Environ. Chem. Eng. 2013, 1, 416-423.
CrossRef - Wong, K.T.; Yoon, Y.; Snyder, S.A.; Jang, M. Chemosphere, 2016, 152, 71-80.
CrossRef - Hu, J.; Shang, R.; Heijman, B.; Rietveld, L. Chemosphere, 2016, 150, 49-56.
CrossRef - I.U.P.F A. Pure Appl Chem, 1972, 31, 579-638.
- Langmuir, I. J. Am. Chem. Soc. 1918, 40, 1361-1403.
CrossRef - Mellah, A.; Chegrouche, S. Water Res. 1997, 31, 621-629.
CrossRef - Qiu, H.; Lv, L.; Pan, B.; Zhang, Q.; Zhang, W. J. Zhejiang Univ-Sci. A, 2009, 10, 716-724.
CrossRef - Sheha, R.R. J.Colloid Interf. Sci. 2007, 310, 18–22.
CrossRef - Ho, Y.S.; McKay, G. Biochem. 1999, 34, 451–465.
CrossRef

This work is licensed under a Creative Commons Attribution 4.0 International License.
![]()
A New Edition of Web of Science
Journal Impact Factor
2022: 0.5
Five Year: 0.8
Journal is Indexed in

Cabells Whitelist
![]()


