Hydro-Chemical and Physico-Chemical Monitoring of Groundwater in North-West Region of Punjab, India- A Study Involving Analysis of Major Ions, Heavy Metal Ions and other Related Parameters
Jeevan Jyoti Mohindru1,3 and Umesh Kumar Garg 1,2
1IKG Punjab Technical University, Kapurthala, Punjab, India.
2Guru Teg Bahadur Khalsa College of IT, Malout, Punjab.
3Department of Chemistry, DAV College, Amritsar, Punjab, India.
Corresponding Author E-mail: jjmdav@gmail.com
DOI : http://dx.doi.org/10.13005/ojc/330357
The district of Tarntaran is situated in Punjab State of Northwestern part of Punjab, India covering 5059 Sq. Km area, located 45 km from Amritsar its geographical coordinates are 310 16' 51" north and 740 51' 25" East longitudes. Water samples are collected from 100 locations in 20 villages on the Patti –Khem Karan highway with 5 samples from each village, and were subjected to analysis for chemical characteristics. The type of water that predominates in the study area is Ca-Mg-HCO3 type, based on hydro-chemical analysis. Besides, suitability of water for irrigation is evaluated based on sodium adsorption ratio (SAR), residual sodium carbonate, sodium percent and salinity hazard. Other physico-chemical parameters such as pH, TDS, conductance etc were also determined using water analysis kit. Analysis of water samples for heavy metal analysis was also carried out in the present study.
KEYWORDS:Groundwater; chemical classification; SAR; RSC; USSL diagram
Download this article as:| Copy the following to cite this article: Mohindru J. J, Garg U. K. Hydro-Chemical and Physico-Chemical Monitoring of Groundwater in North-West Region of Punjab, India- A Study Involving Analysis of Major Ions ,Heavy Metal Ions and other Related Parameters. Orient J Chem 2017;33(3). |
| Copy the following to cite this URL: Mohindru J. J, Garg U. K. Hydro-Chemical and Physico-Chemical Monitoring of Groundwater in North-West Region of Punjab, India- A Study Involving Analysis of Major Ions ,Heavy Metal Ions and other Related Parameters. Orient J Chem 2017;33(3). Available from: http://www.orientjchem.org/?p=33194 |
Introduction
Monitoring the quality of water is one of the most important aspects in groundwater studies. The suitability of water for drinking, agriculture and industrial purposes is assessed by hydro chemical studies. Any natural or anthropogenic effect on water quality can also be studied if regular monitoring of water samples is carried out in a specified region. The most important one is hydro chemical study which determines the presence of ion such as Ca+2, Mg+2, Cl-1, HCO3 -1 Na+1, K+1, and SO4 -2 in groundwater. Different criterion has been studied for deciding the suitability of water for various purposes. It was observed that the criteria used in the classification of waters for a particular purpose considering the individual concentration may not find its suitability for other purposes and better results can be obtained only by considering the combined chemistry of all the ions rather than individual or paired ionic characters [1-5].
Classification of water based on these parameters is a big challenge as it requires the determination of concentration of various ions present in water and their interrelationships. In order to decide the quality of water that is suitable for a particular purpose, it important to evaluate and interpret its physical and chemical parameters. A number of techniques and methods have been developed to interpret the chemical data. Presentation of chemical data in graphical form makes understanding of complex groundwater system. Methods of representing the chemistry of water like Collin’s bar diagram [6], radiating vectors of Maucha [7], and parallel and horizontal axes of Stiff [8], have been used in many parts of the world to show the proportion of ionic concentration in individual water samples. [9] Numerous methods have been developed by Subramanian to interpret the chemistry of groundwater in coastal southern parts of India. The objective of the present work is to monitor the major ions present in underground water and to evaluate the ground water quality in north-west region of Punjab, India. In this case study the methods proposed by Back[10] and Hanshaw, Wilcox, Eaton, Todd [10] and USSL (US Salinity Laboratory) classification have been used. Moreover other parameter such as TDS, pH, DO etc have also been studied to assess the overall quality of water and its suitability for drinking and irrigation purposes.[11-12]
Study Area
The district of Tarntaran is situated in northwest region of Punjab, India covering 5059 Sq Km Area.. It is surrounded by district Amritsar in the north, Kapurthala in the east, Ferozepur in the South and Pakistan in the West. Patti town is a municipal council of the Tarntaran district, located 45 km from Amritsar with geographical coordinates 310 16′ 51″ north and 740 51′ 25″ east. Even though only limited region experience temperature below 0 0C, ground frost is commonly found in majority of the areas in winter season. The temperature rises gradually with high presence of moisture and overcast sky. However, the rise in temperature is steep when sky is clear and moisture content is very less, falling within the semiarid region and frequently facing water scarcity as well as quality problems, so assessment of water quality becomes an important research concern.
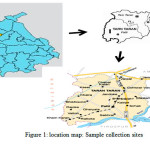 |
Figure 1: location map: Sample collection sites Click here to View figure |
Methodology
Sampling, storage and preservation
Field visits were carried out to collect water samples from hundred locations in twenty villages on the Patti –Khem Karan highway with five samples from each village, and were subjected to analysis for chemical characteristics. These samples were collected in duplicates randomly from water sources (Hand-pumps/submersible pumps/public and private Tube wells) of the selected sites. The collected water samples were transferred into pre-cleaned polythene bottles for analysis of chemical characteristics.
Hydro- chemical analysis of water samples
Chemical analyses was carried out for the major ion concentrations in water samples collected from different locations using the standard procedures recommended by APHA-1994 [13]. The analytical data can be used for the classification of water for utilitarian purposes and for ascertaining various factors on which the chemical characteristics of water depend. Cations like calcium and magnesium were analyzed using volumetric method while sodium and potassium were analyzed by flame photometer, whereas anions like chloride and bicarbonate were analyzed by volumetric method while sulphate was analyzed by spectrometric method.
Physico -chemical analysis of water samples
The onsite analysis of various physicochemical parameters (such as pH, TDS, DO, Electrical conductance and salinity) was carried out using water analysis kit. The conductance and pH measurements were done using microprocessor based conductivity meter and pH meter (Systronics, India). The analysis of other parameters such as TDS, pH, DO etc was carried out for the classification of water for purposes other than agricultural use and also for ascertaining various factors on which the chemical characteristics of water depends.[14-17]
Analysis of water samples for Heavy metal ions
The analysis of heavy metal was carried out by emission spectrometer, ICAP 6300 (Thermo Electron Corporation) [18-26]. ICAP 6300 allows for simultaneous analysis of all elements from sub ppb to percentage level. The instrument is calibrated by using stock solutions of known concentration of heavy metals ions and various dilutions of stock solution. Analysis of a solution of known concentration is required to check the performance of the instrument.
Results and Discussions
Hydro-Chemistry
The assessment of hydrochemistry of ground water is important for its irrigational and domestic usage. Maximum and minimum concentration of major ions present in the groundwater from the study area is presented in Table 1.
Table 1: Hydro-chemical analysis of ground water
|
Village |
Na +1 |
K +1 |
Ca +2 |
Mg+2 |
HCO3-1 |
CO3-2 |
Cl-1 |
SO4-2 |
Total Hardness |
|
Patti |
61.9 |
14.2 |
56 |
24 |
314 |
34 |
534 |
162 |
856 |
|
Patti Rural |
68.1 |
13.8 |
76 |
34 |
354 |
35 |
587 |
154 |
912 |
|
Kulla |
149.8 |
27.3 |
84 |
46 |
298 |
27 |
486 |
134 |
798 |
|
Chuslewar |
171.5 |
14.2 |
118 |
56 |
346 |
36 |
438 |
102 |
976 |
|
Thakar Pura |
178.9 |
19.2 |
128 |
43 |
178 |
25 |
432 |
121 |
768 |
|
Asal |
143.8 |
10.1 |
114 |
34 |
179 |
29 |
398 |
125 |
698 |
|
Boparai |
71.8 |
17.2 |
134 |
47 |
278 |
28 |
476 |
89 |
854 |
|
Dhaliwal |
165.2 |
16.9 |
69 |
36 |
179 |
27 |
498 |
144 |
916 |
|
ParagPura |
176.2 |
27.2 |
158 |
47 |
197 |
29 |
578 |
121 |
924 |
|
Thatha |
156.4 |
21.9 |
76 |
34 |
243 |
29 |
459 |
140 |
912 |
|
Dhagana |
146.1 |
19.8 |
112 |
29 |
198 |
26 |
528 |
145 |
871 |
|
Gharyala |
112.4 |
23.3 |
115 |
31 |
178 |
27 |
473 |
136 |
824 |
|
Punian |
168.8 |
18.1 |
164 |
37 |
199 |
31 |
472 |
117 |
874 |
|
Maan |
164.2 |
23.8 |
119 |
39 |
187 |
36 |
481 |
148 |
891 |
|
Varnala |
145.6 |
17.4 |
167 |
43 |
204 |
33 |
477 |
143 |
901 |
|
Valtoha |
114.2 |
19.3 |
185 |
26 |
213 |
29 |
397 |
98 |
746 |
|
Khern Karan |
87.4 |
26.6 |
180 |
43 |
243 |
25 |
295 |
129 |
721 |
|
Asal uttar |
137.6 |
25.5 |
143 |
48 |
196 |
26 |
574 |
151 |
970 |
|
Mashika |
76.5 |
22.7 |
104 |
37 |
231 |
33 |
538 |
141 |
995 |
|
Khem Karan |
89..7 |
16.3 |
97 |
41 |
195 |
34 |
412 |
135 |
859 |
Cations
Cation concentration (Ca+2, Mg+2, Na+, K+) in the groundwater samples come out to be much below the WHO limits (WHO 2011). Presence of calcium (Ca+2) and magnesium (Mg+2) ions in water is largely due to leaching of limestone, dolomites, gypsum and anhydrites. The concentration of Ca+2 is varied from 56.0 mg/l to 180.0 mg/l. (WHO limit 100 mg/l; WHO 2011). The concentration of Mg+2 ion varied from24mg/l to 56 mg/l. (WHO limit 30 mg/l; WHO 2011) similarly, the concentration of Na+ ion varied from 61.9 mg/l to 178.9 mg/l. (WHO limit 175 mg/l; WHO 2011). The concentration of K+ ion varied from 13.8 mg/l to 27.2 mg/l. (WHO limit 25 mg/l; WHO 2011).
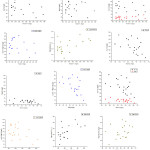 |
Figure 2: Variation and correlations of various ions in water samples Click here to View figure |
Anions
The concentration of Chloride (Cl-1) ion varied from 397mg/l to 587 mg/l. (WHO limit 600 mg/l; WHO 2011). The bicarbonate (HCO3-1) ion concentration varied from 178 mg/l to 354 mg/l. The Sulphate (SO4-2) ion concentration varied from 98 mg/l to 162 mg/l. (WHO limit 250 mg/l; WHO 2011). A number of correlation studies between various major cations and anions present in water were carried out to know the extent of availability of one type of ion in reference to other.
Piper Trilinear diagram
The Piper-Hill diagram [13] is used to infer hydro-geochemical facies. These plots include two triangles, one for plotting cations and the other for plotting anions. The cation and anion fields are combined to show a single point in a diamond-shaped field, from which inference is drawn on the basis of hydro-geochemical facies concept. This tri-linear diagram is useful in bringing out chemical relationships among groundwater samples in more definite terms rather than with other possible plotting methods.
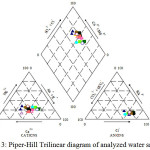 |
Figure 3: Piper-Hill Trilinear diagram of analyzed water samples Click here to View figure |
Chadha’s diagram
The difference in milliequivalent percentage between alkaline earth metal ions(Ca+2 and Mg+2 )and alkali metal ions(Na+and K+) expressed as percentage is plotted on the X- axis and difference in milliequivalent percentage between weak acidic anions(CO3-2and HCO3-1 )and strong acidic anions (Cl-1and SO4-2)expressed as percentage is plotted on the y axis
Sodium Adsorption Ratio (SAR)
It is a measure of the suitability of water for use in agriculture and given by the relation:
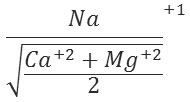
Based on SAR values water samples are classified as excellent (SAR<10), good (10-20), doubtful (20-30) and unsuitable (>30). The SAR value is associated with alkalinity hazard in ground water used for irrigation. In the present study of ground water samples SAR value varied from 5.85 to 13.83.
Residual Sodium carbonate (RSC)
The hazardous effects of carbonate and bicarbonate in ground water used for irrigation are best explained in terms of residual sodium carbonate (RSC) which is calculated as follows
RSC = (HCO3-1 + CO3-2) _ (Ca+2 + Mg+2)
Based on RSC water has been classified as safe (RSC<1.25), marginal (RSC=1.25-2.50) and unsuitable (RSC>2.50). In the present study of ground water samples RSC value varied from -5.85 to 1.48.
Magnesium Ratio
The quality of water is greatly affected by magnesium, because large amount of magnesium in water makes the soil alkaline which leads to a decrease in crop yield. The amount of magnesium in water is best expressed as the magnesium ratio which is calculated as follows
Water has been classified as good (Mg ratio<20), suitable (Mg ratio=20-50) and poisonous (Mg ratio>50) for plants. In the present study of ground water samples RSC value varied from 27.3 to 47.7.
Permeability Index (PI)
Permeability index (PI) is used to measure the suitability of ground water for irrigation purpose. With the consistent use of water the levels of sodium potassium magnesium and bicarbonates change in the soil so that permeability index changes. Permeability index is given by the equation
Based on PI water has been classified as good (Mg ratio<20), suitable (Mg ratio=20-50) and poisonous (Mg ratio>50) for plants. In the present study RSC value varied from 27.3 to 47.7.
USSL classification
For the use of water in irrigation purpose it useful to interpret the water quality by USSL diagram which tells us about the alkali hazard of the groundwater samples for the study area.(Todd 1980). In this diagram the sodium adsorption ratio is plotted against specific conductance. The sixteen classes in the diagram indicate the extent that waters can affect the soil in terms of salinity hazard as low(C1), Medium(C2), high(C3),and very high(C4)and similarly sodium hazard as low(S1), medium(S2), High(S3) and very high(S4). Most of the sample of the analyzed data fall in the region C3S4.This category is predominant in the study area and it is suit-able for irrigations purposes as shown in Fig. 5.
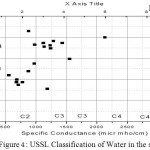 |
Figure 4: USSL Classification of Water in the study area |
Physico chemical Characteristics
The assessment of Physico-chemical characteristic of ground water is carried out on site using the water testing kit. The value of various parameters collected from the study area is presented in Table 2
Table 2: Physico-chemical analysis of ground water
|
S No. |
Village |
Temp |
TDS |
EC |
pH |
Salinity(ppt) |
DO |
|
1 |
Patti |
32 |
256 |
687 |
7.31 |
0.001 |
2.4 |
|
2 |
Patti Rural |
29 |
912 |
780 |
7.93 |
0.003 |
2.9 |
|
3 |
Kulla |
28 |
798 |
1431 |
7.12 |
0.001 |
2.6 |
|
4 |
Chuslewar |
27 |
976 |
1122 |
8.40 |
0.002 |
2.5 |
|
5 |
Thakar Pura |
26 |
768 |
2130 |
8.32 |
0.002 |
2.5 |
|
6 |
Asal |
30 |
598 |
1243 |
8.14 |
0.003 |
2.8 |
|
7 |
Boparai |
31 |
854 |
1187 |
7.75 |
0.001 |
2.7 |
|
8 |
Dhaliwal |
32 |
816 |
3212 |
7.71 |
0.001 |
2.3 |
|
9 |
ParagPura |
30 |
924 |
1232 |
7.24 |
0.001 |
2.3 |
|
10 |
Thatha |
32 |
412 |
879 |
8.63 |
0.002 |
2.4 |
|
11 |
Dhagana |
32 |
871 |
978 |
8.91 |
0.002 |
2.3 |
|
12 |
Gharyala |
30 |
824 |
971 |
7.01 |
0.001 |
2.6 |
|
13 |
Punian |
29 |
1096 |
1134 |
6.97 |
0.001 |
2.5 |
|
14 |
Maan |
28 |
891 |
1287 |
7.91 |
0.001 |
2.4 |
|
15 |
Varnala |
27 |
901 |
1553 |
7.17 |
0.002 |
2.4 |
|
16 |
Valtoha |
25 |
746 |
876 |
7.20 |
0.001 |
3.2 |
|
17 |
Khern Karan |
29 |
721 |
710 |
7.34 |
0.002 |
2.5 |
|
18 |
Asal uttar |
32 |
470 |
3090 |
7.21 |
0.001 |
2.3 |
|
19 |
Mashika |
30 |
995 |
680 |
7.43 |
0.003 |
2.5 |
|
20 |
Khem Karan |
31 |
859 |
554 |
7.11 |
0.001 |
2.5 |
pH measurements
The pH of groundwater in the study area varied from 7.1 to 9.2, indicating its alkaline nature. (WHO limit 6.5 to 8.5; WHO 1993), only two samples exceed the limit of 8.5.
Electrical Conductivity (EC)
Conductivity of the groundwater in the study area varied from 554 to 3212 µS/cm. (WHO limit 1500 µS/cm ; WHO 1993). Measurement of conductivity is important as it provides an insight to concentrations and type of ions present in ground water. A high conduction is generally an indication of high chloride ion concentration in ground water. Water is regarded as excellent (conductivity less than 500 µS/cm), good (500-1250 µS/cm), permissible (1250-2500 µS/cm), bad (2500-5000 µS/cm) and unsuitable for irrigation (above 5000 µS/cm).
Total dissolved solids (TDS)
Cations including (Na+, K+, Ca+2 and Mg+2) and anions including (HCO3-1, CO3-2,Cl-1,SO4-2,NO3-1) are the major contributors toward TDS .The TDS of ground water in the study area varies from 256 to 1096 mg/l. Water is regarded as excellent with TDS less than 150 ppm, with 150-400 good, with 400-1500 permissible and above 1500ppm it becomes unsuitable for irrigation.
Dissolved Oxygen (DO)
DO content varied from a minimum value of 2.3mg/l to 3.g mg/l. It showed a typical relationship with temperature as the temperature rises the DO content falls
Heavy metal ion
The ground water samples were also analyzed for metal concentrations (Tables 3) it was found that the metal ion concentration was well within the safer limits as given by WHO. The recommendation for safe limits of metal ions in drinking water is given in Table 4 .Maximum arsenic concentration was found in Patti town (0.005mg/l) and it varied from 0.001 mg/l to 0.005 mg/l in the entire study area. These values of As are well within the permissible limits recommended by USEPA [32]. Hence the water of the study area is suitable for human consumption and domestic usage.
Table 3: Concentration of Heavy metals (mg/l) in Ground water samples
| Village | Arsenic | Cadmium | Chromium | Copper | Iron | Nickel | Manganese | Lead | Zinc |
| Patti | 0.005 | 0.0012 | 0.001 | 0.004 | 0.053 | 0.001 | 0.114 | 0.005 | 0.037 |
| Patti Rural | 0.003 | 0.0010 | 0.000 | 0.003 | 0.033 | 0.001 | 0.001 | 0.006 | 0.064 |
| Kulla | 0.000 | 0.0010 | 0.000 | 0.000 | 0.003 | 0.002 | 0.005 | 0.003 | 0.012 |
| Chuslewar | 0.002 | 0.0011 | 0.000 | 0.001 | 0.006 | 0.002 | 0.007 | 0.003 | 0.013 |
| Thakar Pura | 0.004 | 0.0012 | 0.000 | 0.000 | 0.010 | 0.001 | 0.001 | 0.001 | 0.012 |
| Asal | 0.001 | 0.0010 | 0.001 | 0.000 | 0.001 | 0.001 | 0.001 | 0.001 | 0.020 |
| Boparai | 0.001 | 0.0012 | 0.000 | 0.002 | 0.001 | 0.002 | 0.001 | 0.007 | 0.012 |
| Dhaliwal | 0.001 | 0.0011 | 0.001 | 0.000 | 0.001 | 0.003 | 0.013 | 0.004 | 0.010 |
| ParagPura | 0.001 | 0.0011 | 0.001 | 0.000 | 0.002 | 0.001 | 0.017 | 0.004 | 0.010 |
| Thatha | 0.002 | 0.0010 | 0.000 | 0.001 | 0.010 | 0.001 | 0.001 | 0.001 | 0.009 |
| Dhagana | 0.001 | 0.0010 | 0.000 | 0.000 | 0.001 | 0.004 | 0.001 | 0.001 | 0.009 |
| Gharyala | 0.001 | 0.0010 | 0.000 | 0.000 | 0.002 | 0.001 | 0.010 | 0.003 | 0.070 |
| Punian | 0.005 | 0.0011 | 0.001 | 0.000 | 0.002 | 0.004 | 0.001 | 0.001 | 0.012 |
| Maan | 0.001 | 0.0012 | 0.001 | 0.001 | 0.000 | 0.004 | 0.009 | 0.002 | 0.078 |
| Varnala | 0.001 | 0.0010 | 0.000 | 0.001 | 0.000 | 0.004 | 0.003 | 0.007 | 0.024 |
| Valtoha | 0.001 | 0.0010 | 0.000 | 0.000 | 0.000 | 0.001 | 0.007 | 0.002 | 0.012 |
| Khern Karan | 0.002 | 0.0010 | 0.000 | 0.000 | 0.020 | 0.001 | 0.001 | 0.001 | 0.012 |
| Asal uttar | 0.002 | 0.0012 | 0.001 | 0.000 | 0.034 | 0.002 | 0.010 | 0.001 | 0.012 |
| Mashika | 0.001 | 0.0011 | 0.001 | 0.001 | 0.032 | 0.001 | 0.001 | 0.002 | 0.010 |
| Khem Karan | 0.004 | 0.0010 | 0.001 | 0.001 | 0.047 | 0.001 | 0.001 | 0.002 | 0.031 |
Table 4: Safe limits of Heavy metals in the water as prescribed by various agencies
|
Heavy metal |
Safe Limit (WHO standards) |
Safe Limit (Indian standards) |
Safe Limit (European standards) |
|
Arsenic(As) |
0.01 mg/l (ppm) |
0.05 mg/l (ppm) |
0.01 mg/l (ppm) |
|
Cadmium(Cd) |
0.003 mg/l (ppm) |
0.01 mg/l (ppm) |
0.005 mg/l (ppm) |
|
Chromium(Cr) |
0.05 mg/l (ppm) |
0.05 mg/l (ppm) |
0.05 mg/l (ppm) |
|
Copper(Cu) |
1.5 mg/l (ppm) |
1.5 mg/l (ppm) |
2.0 mg/l (ppm) |
|
Iron(Fe) |
— |
1.0 mg/l (ppm) |
0.2mg/l (ppm) |
|
Nickel(Ni) |
0.02 mg/l (ppm) |
3.0 mg/l (ppm) |
0.02 mg/l (ppm) |
|
Manganese(Mn) |
0.5 mg/l (ppm) |
0.5 mg/l (ppm) |
0.05 mg/l (ppm) |
|
Lead(Pb) |
0.01 mg/l (ppm) |
0.1 mg/l (ppm) |
0.01 mg/l (ppm) |
|
Zinc(Zn) |
3.0 mg/l (ppm) |
10.0 mg/l (ppm) |
—- |
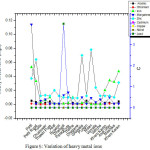 |
Figure 5: Variation of heavy metal ions |
Statistical analysis
The data were subjected to normal distribution analysis and Pearson correlation using Microsoft Excel 2007 and origin pro 8.5.Normal distribution analysis (involved mean, median, standard deviation, skewness and kurtosis) analysis is an important statistical tool for identifying the distribution patterns of the different water quality parameters in groundwater samples. [35-41] . Pearson’s correlation coefficient is usually signified by σ(rho), and can take on the values from -1.0 to 1.0. Where -1.0 is a perfect negative inverse) correlation, 0.0 is no correlation and 1.0 is a perfect positive correlation. The variables having coefficient value (r) > 0.5 or < -0.5 are considered significant.
Table 5: Distribution of Physico-chemical parametres in the water samples (statistical Analysis)
|
S. No. |
Parameter |
N |
Mean ± S.D. |
Max. |
Min. |
Median |
WHO |
|
1. |
Temp |
100 |
29.5±1.8 |
32 |
26 |
30 |
— |
|
2. |
TDS |
100 |
784.4±0.8 |
1096 |
256 |
839 |
— |
|
3. |
EC |
100 |
1286.8±14 |
3212 |
554 |
1128 |
— |
|
4. |
pH |
100 |
7.64±0.20 |
9.1 |
7.2 |
7.385 |
6.5-8.5 |
|
5. |
salinity |
100 |
0.0016±0.001 |
0.003 |
0.001 |
0.001 |
— |
|
6. |
DO |
100 |
2.53±0.2 |
3.2 |
2.3 |
2.5 |
— |
Table 6: Distribution of Heavy metal ions in the water samples(statistical Analysis)
|
S. No. |
Heavy Metal ion |
N |
Mean |
Max. |
Min. |
Median |
WHO |
|
1. |
Arsenic |
100 |
0.00195 |
0.005 |
0.000 |
0.001 |
0.01 |
|
2. |
Cadmium |
100 |
0.001075 |
0.0012 |
0.0010 |
0.00105 |
0.003 |
|
3. |
Chromium |
100 |
0.00045 |
0.001 |
0.000 |
0.000 |
0.05 |
|
4. |
Copper |
100 |
0.00075 |
0.004 |
0.000 |
0.000 |
1.5 |
|
5. |
Iron |
100 |
0.0129 |
0.053 |
0.000 |
0.0025 |
— |
|
6. |
Nickel |
100 |
0.0019 |
0.004 |
0.001 |
0.001 |
0.02 |
|
7. |
Manganese |
100 |
0.01025 |
0.114 |
0.001 |
0.002 |
0.5 |
|
8. |
Lead |
100 |
0.00285 |
0.007 |
0.001 |
0.002 |
0.01 |
|
9. |
Zinc |
100 |
0.02345 |
0.070 |
0.010 |
0.012 |
3.0 |
Conclusion
The type of water that predominates in the study area is Ca-Mg-HCO3 type during based on hydro-chemical analysis.The suitability of water for irrigation is determined based on SAR, %Na, RSC and salinity hazard, it is only an empirical conclusion. Other factors like soil type, type of crop, frequency and pattern of crop, rain fall and its frequency, climate, etc. all are important in deciding the suitability of water. Most of the samples in the study area fall in the suitable range for irrigation purpose either from SAR, % Na or RSC values.Physicochemical characteristic of water were determined in order to assess the overall quality of water.The concentrations of heavy metal ions in water samples were well below the permissible limits indicating their suitability for drinking and irrigation purposes. The correlation coefficient values for the water samples show a perfect positive correlation. Most of the samples in study area fall in the suitable range for irrigation and drinking purpose as recommended by WHO 2011.
Acknowledgments
The authors are thankful to IKG Punjab Technical University, Kapurthala and Guru Nanak Dev University, Amritsar for their support in analyzing the data. The authors are also thankful to Principal DAV College, Amritsar for providing the necessary lab facilities. A special thanks to University Grants Commission (New Delhi) for funding.
References
- Hem J. D. U.S. Geographical Survey. Water Supply Paper, 1985, 2254, 117-120.
- Bartram, J.; Balance, R. Water Quality Monitoring, London. 1996,1-100
- Sadashivaiah, C.; Ramakrishnaiah, C. R.; Ranganna, G. Int. J. Environ. Res. Public Health ,2008, 5(3), 158-164
CrossRef
- Todd, D. K. Groundwater Hydrology, Wiley, New York, USA, 1980, 2, 310-315.
- Standard method for examination of water and wastewater, APHA/AWWA/WEF, Washington DC, USA. 1999,1-100
- Kumar, A.R.; Riyazuddin P. Current Science ,2008,94 (8), 1012-1022
- Piper, A. M. U.S. Geol. Survey. Groundwater note 1953, 12, 63.
- Mohamed, E. A.; El-Kammar, A. M.; Yehia, M. M.; Salem, A. J. Adv. Res. 2015, 6, 1031–1044
CrossRef
- Back, W.; Hanshaw, B. B. Academic Press, New York, USA, 1965, 11, 49-50.
- Wicox, L. V. US Department of Agriculture, Washington DC,USA , 1995,19-30
- Eaton, E. M. Soil Science, 1950, 69, 12-133.
CrossRef
- Kumaresan, M.; Riyazuddin, P. Current Science, 2006, 91(12), 1668-1677.
- Kumar, A.R.; Riyazuddin, P. Int. J. En. & Ana. Chem., 2008, 88 (4), 255-266
CrossRef
- Standard method for examination of water and wastewater, APHA/ AWWA/WEF, 1998, Washington DC, USA.
- Chidambaram, S.; Ramanathan, A.L.; Srinivasamoorthy, K.; and Ananthan, P. Capital publishing company, New Delhi, 2004,203- 207.
- Davies, S.N.; De Wiest, R.J.M. Hydrogeology, John Wiley & Sons, USA,1996,1-100
- Arrels, R.M. International Atomic Energy Agency, 1976, 65–84.
- Karanth, K.R. Tata Mc-Graw Hills Publications, New Delhi, India,1987,1-150
- Kelley, W.P. Reinold Publ. Corp., New York, USA. 1951,1-70
- Srinivasamoorthy, K. Nanthakumar, C. Vasanthavigar, M. Vijayaraghavan, K. Rajivgandhi, R. & Chidambaram, S. Anandhan, P. Manivannan, R. Vasudevan, S. Arab J. Geo.sci,2011, 4, 91–102.
CrossRef
- Todd, D.K. John Wiley and Sons, New York, USA, 1980, 2,535.
- Viswanathaiah, M.N.; Sastri, J.C.; Gowda, B. Indian Mineralogist, 1978, 19, 65-69.
- Walton, W.C. McGraw Hill Book Co., New York, 1970, 664.
- Guidelines for drinking-water quality, WHO 2011,4, ISBN 978 92 4 1548151
- Sharma, C. ; Mahajan, A.; Garg U. K. Desalination and Water Treatment, 2013 ,1-9
- Sehgal, M.; Garg, A.; Suresh, R.; Dagar, P . J. En. Mon. Ass.., 2011, 181,1181-1196
- Adams, S.; Titus, R.; Pietersen, K.; Tredoux, G.; Harris, C. J. Hydro. 2001, 241(1-2), 91–103.
CrossRef
- Trivedi, R.K.; Goel, P.K. Environmental publications, Karad, 1984,1-28
- Hundal, H.S.; Singh K.; Singh, D. J Environ Monit Assess, 2009, 154,393–400
CrossRef
- Nikolov, J.; Todorovic, N.; Forkapic, S.; Bikit, I.; Mrdja, D. W. A. Sci. Engg. Tech.,2011, 76,307–310
- Asubiojo, O.I.; Nkono, N.A.; Ogunsua, A.O.; Oluwole, A.F.; Ward, N.I.; Akanle, O.A.; Spyrou, N.M..Sci. Total Environ.1997, 208(1-2), 1-8.
CrossRef
- National primary drinking water regulations for radionuclide. USEPA ,1991,570,9-91
- National recommended water quality criteria, USEPA,2009,10-25
- Yang, W. R. C. J. App. Eco.,2007,18(9), 2013-2018
- Shekhar, S.; Pandey, A.C.; Nathawat, M.S. Int. J. Environ. Sci.2012, 3(3), 1022–1030.
- Lar, U.A.; Sallau, A.K. Environ Geochem Health. 200527(4),331-339
CrossRef
- Water and Related Statistics, Central Water Commission, 2015 .
- Ali, R.R.; Abdel Kawy, W.A.M. Arab J Geosci,2013,6, 2767-76.
CrossRef
- Liang, Y., Yan,C.; Guo,Q.; Xu,J.; Hu,H.Ana. Chem. Res., 2016, 10 , 1-8
CrossRef - Varale , Y.; Wagh, S. Curr. World environ.,2009,4(2),421-423.

This work is licensed under a Creative Commons Attribution 4.0 International License.
![]()
A New Edition of Web of Science
Journal Impact Factor
2022: 0.5
Five Year: 0.8
Journal is Indexed in

Cabells Whitelist
![]()


