A Preliminary Study of the Distribution of Nitrogen Compounds in Tasik Kenyir, Malaysia
Suhaimi Suratman1,2, Edmand Bedurus1 and Tan Hock Seng1
1Institute of Oceanography and Environment.
2Institute for Kenyir Research, Universiti Malaysia Terengganu, 21030 Kuala Terengganu, Terengganu Malaysia.
Corresponding Author E-mail: miman@umt.edu.my
DOI : http://dx.doi.org/10.13005/ojc/330332
A preliminary study of N compound levels in Tasik Kenyir, Terengganu, Malaysia was conducted from August to October 2010. In general, most of the monitoring stations had relatively higher concentrations of N compounds in the bottom water compared to the surface water. In comparison with other selected study areas in Malaysia, the concentration of N compounds in Tasik Kenyir were low, most likely due to less anthropogenic activities around the lake. Based on the National Water Quality Standard (NWQS) classification for Malaysia, the N compound levels for both the surface and bottom waters of Tasik Kenyir can be considered at a natural level (Class 1), indicating that the water is suitable for the conservation of the natural environment, for water supply with practically no treatment necessary, and for fishery activity including that for very sensitive aquatic species.
KEYWORDS:N compounds; Distribution; Water samples; National Water Quality Standard (NWQS); Tasik Kenyir (Malaysia)
Download this article as:| Copy the following to cite this article: Suratman S, Bedurus E, Seng T. H. A Preliminary Study of the Distribution of Nitrogen Compounds in Tasik Kenyir, Malaysia. Orient J Chem 2017;33(3). |
| Copy the following to cite this URL: Suratman S, Bedurus E, Seng T. H. A Preliminary Study of the Distribution of Nitrogen Compounds in Tasik Kenyir, Malaysia. Orient J Chem 2017;33(3). Available from: http://www.orientjchem.org/?p=33717 |
Introduction
Tasik Kenyir is the largest artificial lake in Southeast Asia and is located in the state of Terengganu (5o 12.902’ N, 102o 38.306’ E) in northeast Malaysia. It is an impounding reservoir that was created by the damming of two main rivers (Terengganu and Terengan Rivers) which flow through deep valleys and gorges. The lake covers over 260,000 hectares and contains 340 islands. The usual capacity of the lake is 13.6 billion m3 of water. The water levels near the dam fluctuate between 135 m and 145 m, giving a water drawdown of about 10 m1. The minimum water discharge is 405 million m3 and the maximum is 1001 million m3. In general, water discharge is more pronounced during the wet months (November-March) compared to the dry months (May-September)1. As a result of the damming of these rivers, there were numerous trees flooded at the bottom of the lake, creating anoxic conditions below 15 m. These anoxic conditions are probably due to decomposition processes2. The lake is strongly stratified, with surface and bottom temperatures varying from 24.2 to 32.2°C, and 20.8 to 24.0°C, respectively.
In terms of activity, Tasik Kenyir is popular as a tourist spot for sport-fishing and has cage aquaculture3,4. The increase in visitors to Tasik Kenyir and the rapid development in the area may increase the possibility of deforestation and sewage discharge into the lake. These factors may then increase the concentrations of nutrient compounds in the lake. Thus, an investigation has been carried out to establish the distributions and current levels of nutrients in Tasik Kenyir. Data for the phosphorus and silicon compounds has been presented elsewhere4. Therefore, here we present the levels of nitrogen (N) compounds in Tasik Kenyir. The levels of N compounds will then be compared to the available standards for Malaysia, the National Water Quality Standard (NWQS) (Table 1)5.
Table 1: NWQS for Malaysia5
|
Parameter
|
Unit
|
Class |
||||
|
I |
IIA/IIB |
III |
IV |
V |
||
|
Nitrite |
mg/L |
Natural level |
0.4 |
0.4 |
1 |
– |
|
Nitrate |
mg/L |
Natural level |
7 |
– |
5 |
– |
|
Ammonia |
mg/L |
0.1 |
0.3 |
0.9 |
2.7 |
>2.7 |
Table 1a
| Classes | Uses |
| Class I | Conservation of natural environment |
| Water supply I – Practically no treatment necessary | |
| Class IIA | Fishery I – Very sensitive aquatic species |
| Class IIB | Water supply II – Conventional treatment required |
| Class III | Fishery II – Sensitive aquatic species |
| Recreational use with body contact | |
| Class IV | Water supply III – Extensive treatment required |
| Fishery III – Common of economic value and tolerant species; livestock drinking | |
| Class V | Irrigation |
| None of the above |
Materials and Methods
Three sampling surveys were conducted in this study from August until October 2010. There were two major areas involved, the eastern part of Tasik Kenyir (ELK, stations K1 to K15) and the Terengganu National Park area (TNP, stations N1 to N17), which is located in the western part of Tasik Kenyir (Fig. 1). In ELK, the water samples were collected from both surface and bottom waters (i.e. 30 m below the surface water), from two main transects, Transect 1 (stations K1 to K10) and Transect 2 (stations K11 to K15). In the TNP area, scattered sampling stations were chosen and only surface waters were collected due to the shallow water in comparison to ELK. The samples were placed in an ice cooler and transported back to the laboratory for analysis. Upon arrival at the laboratory, samples were filtered through 0.45 µm membrane filters for the dissolved nutrients determination. After filtration, samples were refrigerated (20°C) prior to analysis. The samples were stored for less than one month prior to analysis.
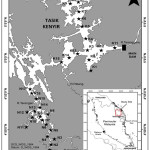 |
Figure 1: Sampling stations in Tasik Kenyir
|
The analysis included nitrite, nitrate, ammonia, and total dissolved nitrogen (TDN) based on established methods6. The concentration of dissolved organic nitrogen (DON) was calculated by the subtraction of dissolved inorganic N (nitrite + nitrate + ammonia) from TDN, which was wet digested6. Unfiltered samples were also digested using a wet digestion method5. The concentration from this digestion and subsequent analysis was then subtracted from TDN to give the concentration of total particulate nitrogen (TPN). Appropriate analytical quality controls have been made during analysis. These include reagent blanks, duplicate samples and analysis of samples spiked with standards (standard addition). The recovery of the standard additions was >98%. The precision of the procedure showed deviations between the duplicate samples of <5%. The significant differences for each parameter among the stations and among the depths were analysed using a two-way ANOVA test.
Results and Discussion
Spatial Distribution of N Compounds in ELK
For the ELK transect, the distribution of N compounds is spatially presented in Fig. 2. For surface water, the highest concentration of nitrite was 0.79 µg/L N (station K9) while the lowest was 0.02 µg/L N (station K13). The mean concentration of nitrite for surface water was 0.30 ± 0.26 µg/L N. For bottom water, the highest concentration of nitrite was observed at station K1 (1.58 µg/L N) and the lowest was at station K12 (0.19 µg/L N). The mean concentration of nitrite for bottom water was 0.85 ± 0.42 µg/L N. Based on a two-way ANOVA analysis, there were no significant differences (p>0.05) regarding nitrite concentrations between stations in ELK. However, there was a significant difference (p<0.05) in nitriteconcentrations between surface and bottom water samples. Based on the NWQS classification, all surface and bottom water samples for all stations were in Class I, meaning the nitriteconcentrations were at a natural level.
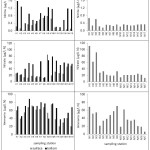 |
Figure 2: Variation of N compounds in Tasik Kenyir
|
The highest concentration of nitrate in surface water was observed at station K9 (84.6 µg/L N) while the lowest was at station K4 (12.5 µg/L N). For bottom water, the highest concentration of nitrate was detected at station K10 (79.0 µg/L N) and the lowest was at station K8 (14.0 µg/L N). The mean concentrations of nitrate for surface and bottom water were 27.7 ± 19.6 and 49.1 ± 19.9 µg/L N, respectively. A two-way ANOVA analysis of nitrate concentrations showed no significant differences (p>0.05) between the sampling stations. However, there was a significant difference (p<0.05) in nitrateconcentrations between surface and bottom water samples. Similar to nitrite, the concentration values of nitrate in the surface and bottom waters for all stations were at natural levels (Class I) according to NWQS.
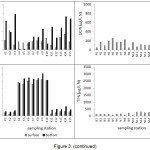 |
Figure 3: (continued) Click here to View figure |
The highest value of ammonia for surface water was 77.2 µg/L N at K10 while the lowest was 20.3 µg/L N at K12. For bottom water, the highest concentration of this nutrient was at K4 (88.4 µg/L) while the lowest was at K12 (37.8 µg/L). The mean concentration of ammoniafor surface water was 51.0 ± 18.4 µg/L while for bottom water it was 63.8 ± 16.2 µg/L. Based on a two-way ANOVA test, the ammoniaconcentration showed significant differences between the sampling stations as well as between the surface and bottom water (p<0.05). According to NWQS, the ammoniaconcentrations in both surface and bottom waters for all the sampling stations were classified as Class I.
In ELK, the concentration of DON ranged from 51 to 430 µg/L N for surface water, with the minimum recorded at station K12 and maximum at station K2, while the bottom water was ranged from 15 to 786 µg/L N. The lowest and highest levels of DON were found at stations K5 and K3, respectively. In general, the bottom water samples had higher concentrations of DON compared to the surface water samples, with mean concentrations of 389 ± 251 µg/L N and 203 ± 97 µg/L N for bottom and surface water, respectively. Based on a two-way ANOVA test, the difference between DON concentrations in surface and bottom water was significant (p<0.05). However, there were no significant differences (p>0.05) between stations.
For surface water in ELK, the TPN concentration ranged from 137 to 2643 µg/L N. The mean concentration of TPN in surface water was 1294 ± 1154 µg/L N. The TPN concentration for bottom water was in the range of 278 to 3063 µg/L N and the mean concentration was 1490 ± 1177 µg/L N. On average, the bottom water in ELK had higher concentrations of TPN compared to the surface water. According to a two-way ANOVA test, there was a significant difference (p<0.05) of TPN concentration between stations, and also between the surface and bottom water.
In general, the bottom water samples had higher concentrations of N compounds compared to the surface water samples. It is likely that the decay of dead trees at the bottom of the lake has increased the concentration of these nutrients. In addition, algal growth in surface waters will die off and subsequently sink to the bottom where it will undergo the remineralisation process and release nutrients into the water. Previous studies have shown that nutrients at 30 m in a lake are not utilised by phytoplankton as light cannot reach the bottom of a lake. These nutrients were locked up in the hypolimnion due to thermal stratification in ELK7. The current result is also parallel to those of a study by Yusoff & Ambak8, in which they found that lower nutrient levels were presented in the euphotic zone (epilimnion layer – down to 10 m depth), compared to the metalimnetic and hypolimnetic zones during a period of strong stratification. Another characteristic of the bottom and surface waters was the concentration of ammonia, which was much higher in the bottom water compared to the nitrite and nitrate. This is due to the anoxic conditions leading to the formation of N compounds in the reduced form (i.e. ammonia) compared to the oxidised form (nitrite and nitrate).
It is obvious that among the N compounds, higher TPN concentrations were recorded at stations from K4 to K10 compared to other stations. These stations were located near to Pangkalan Gawi, which serves as a jetty area, with lakeside restaurants and hotels. Therefore, nutrients and organic matter originating from the nearby activities and sewage waste may diffuse into the lake. In addition, higher concentrations of TPN were probably due to the land-clearing activities on some of the islands in ELK for the development of tourist attractions.
Comparison With Some Selected Previous Studies
The concentrations of nitrite, nitrate and ammoniawere compared with selected previous studies undertaken in Malaysia (Table 2). However, the DON and TPN were not listed in this comparison as most of the previous studies focused primarily on the other three nutrients. For nitrite, the concentration range of the current study was lower compared to both Batang Ai Reservoir9 and Bakun Reservoir10. The nitrate concentration in Tasik Kenyir was lower compared to Chini Lake11 but almost similar to Batang Ai Reservoir9. Chini Lake11 recorded higher values of nitrate among the compared sites.
Table 2: Comparison of N compounds within selected study areas in Malaysia
|
Location
|
Nitrite (µg/L N) |
Nitrate (µg/L N) |
Ammonia (µg/L N) |
References |
| Tasik Kenyir, Malaysia |
0.02 – 1.58 |
12.5 – 111.6 |
6.1 – 88.4 | Present study |
| Batang Ai Reservoir, Sarawak, East Malaysia |
9 – 25 |
0 – 97 |
17 – 567 | Ling et al.9 |
| Bakun Reservoir, Sarawak, East Malaysia |
0.3 – 8.3 |
3 – 27 |
20 – 1340 |
Ling et al.10 |
| Chini Lake, Pahang, West Malaysia |
– |
0 – 1840 |
0 – 597
|
Shuhaimi-Othman et al.11
|
Higher ammonia concentrations were found at the other study areas. The study from Chini Lake reported that high values of ammonia were recorded during the wet season. Increased ammonia is carried down the Pahang River into the lake during this season11. In the case of the Batang Ai Reservoir in Sarawak, the ammonia was the product of the mineralization of organic matter from uneaten fish food, urine and faeces9.
Comparison of Nutrients Between ELK and TNP
In this study, comparisons have been made between ELK and TNP surface waters to evaluate the potential different inputs of nutrients. In TNP, the nitrite and nitrate concentrations fell within the range of 0.16 – 0.66 µg/L N (mean: 0.32 ± 0.13 µg/L N) and 12.3 – 111.6 µg/L N (mean: 32.1 ± 26.9 µg/L N), respectively. High concentrations of nitrite and nitrate were observed at stations N1 and N3 in TNP. Meanwhile, ammonia, DON and TPN concentrations were in the range of 6.1 – 71.1 µg/L N (mean: 39.8 ± 19.3 µg/L N), 159 – 323 µg/L N (mean: 222 ± 51 µg/L N) and 89 – 315 µg/L N (mean: 188 ± 73 µg/L N), respectively. Generally, in ELK, most of the N compounds were in the higher ranges compared to the TNP area. The results show that the pollution levels in TNP are low, due to minimal disturbance from anthropogenic activities, as TNP is a protected area. Based on the NWQS, all the surface water in TNP was within Class I and therefore the nutrient levels are considered as at a natural level.
Conclusion
The results from this preliminary study have shown that most of the selected stations have relatively higher concentrations of N compounds in the bottom water compared to the surface water in ELK. In addition, most of N compounds in ELK were higher than the concentrations in TNP, which is probably due to low anthropogenic activities in this area of Tasik Kenyir. Based on the NWQS classification, the N compounds fell in Class I (natural level) i.e. suitable for conservation of natural environment, water supply with practically no treatment necessary and fishery activity for very sensitive aquatic species.
Acknowledgements
This study was partially supported by Ministry of Education, Malaysia (Fundamental Research Grant Vote No. 59313). The assistance of Miss Cho Kar Yen in the sampling and analysis is kindly acknowledged. Thanks to Dr. Rose Norman for assistance with proof reading of the manuscript. This paper also benefited from the comments of anonymous reviewers.
References
- Rouf, A.J.M. A.; Ambak, M.A.; Shamsudin, L.; Phang, S.-M.; Ho, S.C. Lakes & Reservoirs: Research and Management 2008, 13, 271-287.
CrossRef - Yusoff, F.M.; Lock, M.A. In: Proceeding of the international conference tropical limnology, 4-8th July, Indonesia, 1994, . 18.
- Kamaruddin, I.S.; Mustafa Kamal, A.S.; Christianus, A.; Daud, S.K.; Yu Abit, L. Journal of Sustainability Science and Management 2011, 6, 89-97.
- Suratman, S.; Hee, Y.Y.; Tan, H.S. Journal of Sustainability Science and Management 2015, 10, 35-41.
- DOE (Department of Environment). Malaysia Environmental Quality Report 2010. Department of Environment. Ministry of Natural Resources and Environment Malaysia 2010, 78 .
- Grasshoff, K.; Ehrhardt, M.; Kremling, K. Methods of seawater analysis, 2nd ed. Florida: Verlag Chemie. 1983, 419 .
- Yusoff, F.M.; Zaidi, M.Z.; Ambak, M.A. Fisheries and environmental management of Lake Kenyir, Malaysia. Paper presented at the Regional Symposium on Sustainable Devlopment of Inland Fisheries under Environmental Constraints, Bangkok, Thailand. 19-21 October 1994. 1994, 24 .
- Yusoff, F.M.; Ambak, M.A. In: Fish and fisheries of lakes and reservoirs in Southeast Asia and Africa. Westbury Publishing, Otley, UK. 1999,. 59-76.
- Ling, T. Y.; Nyanti, L.; Nurul-Safinaz, M. K.; Sim S. F.; Grinang, J. Iranica Journal of Energy and Environment 2016b, 7, 169-176.
- Ling, T.-Y.; Nyanti, L.; Muan, T.; Grinang, J.; Sim, S.-F.; Mujahid, A. Sains Malaysiana 2016b, 45, 157–166.
- Shuhaimi-Othman, M.; Lim, E. C.; Mushrifah, I. Environmental Monitoring Assessment 2007, 131, 279–292.
CrossRef

This work is licensed under a Creative Commons Attribution 4.0 International License.
![]()
A New Edition of Web of Science
Journal Impact Factor
2022: 0.5
Five Year: 0.8
Journal is Indexed in

Cabells Whitelist
![]()


