Preparation and Characterization of Solid Dispersion Telmisartan – Hydroxypropyl Methyl Cellulose (HPMC) E5 LV by Co-Grinding Method
Erizal Zaini, Lili Fitriani, Sanezea Effendy, Deni Noviza and Auzal Halim
Department of Pharmaceutics, Faculty of Pharmacy, Andalas University, Kampus Limau Manis, Padang, Indonesia, 25163.
Corresponding Author E-mail: erizal@ffarmasi.unand.ac.id
DOI : http://dx.doi.org/10.13005/ojc/330236
Article Received on : October 14, 2016
Article Accepted on : January 02, 2017
Telmisartan (TMS), an antihypertensive drug, is classified as class II according to Biopharmaceutical Classification System (BCS) with low solubility and high permeability. The purpose of this study was to prepare and characterize solid dispersion of TMS with hidroxypropyl methyl cellulose (HPMC) E5 LV to increase the solubility. Solid dispersion was prepared in three different ratio TMS:HPMC 2:1, 1:1, and 1:2 (w/w) by co-grinding method for 60 minutes. Solubility test was conducted in distilled water for 72 hours and the amount of TMS was determined by spectrophotometry UV. Result of Powder X-Ray Diffraction (PXRD) showed a decrease in intensity of TMS in accordance with the amount of HPMC E5 LV in solid dispersion. Fourier Transform Infra-Red (FT-IR) Spectra showed no significant shift of wavelength. Scanning Electron Microscopy (SEM) result presented the crystalline form of TMS, while both physical mixture and solid dispersion at different ratio showed TMS stick on the surface of HPMC E5 LV. Thermogram of Differential Scanning Calorimetry (DSC) showed an incline of endotherm peak as the ratio HPMC E5 LV increased. The solubility result of intact TMS was 0.49±0.03µg/mL, while the physical mixture and solid dispersion 2:1, 1;1 and 1:2 were 1.87±0.18 µg/mL, 5.36± 0.48 µg/mL, 7.24±1.73 µg/mL, and 14.89±1.49 µg/mL, respectively. In conclusion, solid dispersion of telmisartan-HPMC E5 LV enhanced the solubility of TMS.
KEYWORDS:telmisartan; HPMC E5 LV; solid dispersion; solubility; co-grinding
Download this article as:| Copy the following to cite this article: Zaini E, Fitriani L, Effendy S, Noviza D, Halim A. Preparation and Characterization of Solid Dispersion Telmisartan – Hydroxypropyl Methyl Cellulose (HPMC) E5 LV by Co-Grinding Method. Orient J Chem 2017;33(2). |
| Copy the following to cite this URL: Zaini E, Fitriani L, Effendy S, Noviza D, Halim A. Preparation and Characterization of Solid Dispersion Telmisartan – Hydroxypropyl Methyl Cellulose (HPMC) E5 LV by Co-Grinding Method. Orient J Chem 2017;33(2). Available from: http://www.orientjchem.org/?p=32031 |
Introduction
Telmisartan (TMS), an antihypertensive drug, belongs to angiotensin receptor blockers (ARBs) which act by inhibiting receptor stimulation of angiotensin II type 1 (AT1) without affecting other related receptors in cardiovascular1. TMS is classified as class II, low solubility high permeability, based on Biopharmaceutical Classification System (BCS). The main problem is the low solubility of drugs in biological fluids that result in poor bioavailability after oral administration2. Therefore, it is necessary to improve the solubility and dissolution rate of TMS. Several studies have been conducted to improve the solubility and dissolution of TMS including co-grinding TMS with polyvinyl alcohol3, formation of solid nanoparticles4, inclusion complex of TMS and β-cyclodextrins5, formation of cocrystalline phase with several coformers 6,7, formation amorphous solid dsipersion8 .
Various strategies are used to increase the solubility and dissolution rate of drugs BCS class II and solid dispersion is one of effective approaches 9,10. This method can be defined as a molecular dispersion of active substance in one or more hydrophilic carriers, which involved a reduction in particle size, increase the wettability of the active ingredient by the carrier, the formation of soluble complexes, and the formation of an amorphous active substance. In the solid dispersion, the hydrophilic polymer also plays an important role in inhibiting the crystallization of crystalline phase through the process of molecular mobility 11, 12.
In this research, preparation of solid dispersions TMS – HPMC E5LV using a planetary ball mill with a ratio of 2: 1, 1: 1, 1: 2 (w / w) aimed to modify the solid properties of TMS and the effects on the solubility. The results obtained were then characterized by Scanning electron microscope (SEM), analysis of X-ray diffraction, differential scanning calorimetry (DSC), Fourier Transform Infrared spectroscopy (FT-IR), and solubility test.
Materials and Methods
Materials
Telmisartan (TMS) (Dr. Reddy’s Laboratories, India), HPMC E5 LV (Wuhan Senwayer, China), KH2PO4 (Bratachem, Indonesia), NaOH and distilled water. All materials were used as received.
Preparation of Solid Dispersion
Preparation of solid dispersion TMS and HPMC E5 LV was conducted using co-grinding method in a planetary ball mill (Fritsch, Pulverissete 7, Germany) at 500 rpm. Solid dispersion was prepared at three ratio of TMS:HPMC E5LV 2:1, 1:1 and 1:2 (w/w) and grounded for 60 minutes. The milled powder then was kept in a desiccator.
Preparation of Physical Mixture
Preparation of physical mixture was done at ratio of TMS:HPMC E5 LV 1:1 (w/w). The mixture was mixed homogenously in a sealed container and the mixed powder then was also kept in a desiccator.
Powder X-Ray Diffraction Analysis
Intact TMS, intact HPMC E5LV, physical mixture and solid dispersion at different ratio were analyzed the crystallinity degree using an X-ray diffractometer (X’Pert XRD Powder type PW 30/40 PANalytical, The Netherlands). Samples were placed on the sample holder and levelled to prevent particle orientation during sample preparation. Analysis was carried out at 2θ range 5-40 °. Measurement condition was as follow: target metals Cu, Kα filter, voltage 45 kV, and current 40 mA.
Scanning Electron Microscopy (SEM) Analysis
Sample powder was placed on an aluminum sample holder and the voltage was set at 10kV and current 12 mA to observe surface and morphology of TMS and HPMC E5LV before and after mixing and co-grinding. Sample was observed on various magnifications using SEM (HITACHI type S-3400N, Japan). SEM analysis was done for intact TMS, intact HPMC E5LV, physical mixture and solid dispersions at all ratio.
FT-IR Spectroscopy Analysis
FT-IR spectroscopy analysis was done using a PerkinElmer FT-IR Spectrophotometer, where the samples absorption spectra were recorded at wave number 4000-400 cm-1 in order to observe and confirm the functional groups and fingerprint of each sample. FT-IR spectroscopy analysis was done for intact TMS, intact HPMC E5LV, physical mixture and solid dispersions at all ratio.
Differential Scanning Calorimetry
The thermal properties of intact TMS, intact HPMC E5LV, physical mixture and solid dispersions at all ratio were determined using a thermal analyzer (Mettler Toledo FP90, Switzerland) which has been calibrated with Indium temperature. Each sample in a small amount was placed on an aluminum pan and the instrument temperature was set in a range from 50°C to 300°C at 10°C per minute of heating rate.
Solubility Test
An excessive amount intact TMS, physical mixture and solid dispersions at all ratio were dissolved in 100 mL of distilled water. Solubility test was conducted for 72 hours in an orbital shaker at room temperature. Samples were analyzed using UV spectrophotometer (Shimadzu UV-1700, Japan) at the wavelength of TMS maximum absorption 295.2 nm. All experiments were done triplicated.
Results and Discussion
Powder X-Ray Diffraction Analysis
The diffractogram of intact TMS, intact HPMC E5LV, physical mixture, and solid dispersions can be seen in Figure 1. Intact TMS showed the sharp peak indicated its form as crystalline, while HPMC E5LV showed an amorphous phase as no sharp peak observed due to HPMC E5LV is a hydrophilic polymer. The physical mixture showed a decrease of peak intensity. In addition, the greater the amount of HPMC E5LV, the greater decrease of peak intensity in solid dispersion. Solid phase changes of telmisartan was occured during co-grinding process such as partial amorphization. The position of 2Ɵ and intensity of the peak for intact TMS, physical mixture and solid dispersion at all ratio is shown in Table 1. This result indicated that preparation of solid dispersion at all ratio give an impact in decreasing the TMS crystallinity, which decrease the rigidity of TMS and likely increase the solubility 11. Solid dispersion at 1:2 showed the greatest reduction of peak intensity at 2ϴ (14.1781, 15.0101, 22.2641 and 24.9421) which decrease 4.7; 2.5; 3.4; and 2.6 fold, respectively.
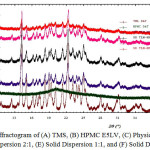 |
Figure 1: Diffractogram of (A) TMS, (B) HPMC E5LV, (C) Physical Mixture, (D) Solid Dispersion 2:1, (E) Solid Dispersion 1:1, and (F) Solid Dispersion 1:2 |
Table 1: Peak intensity of TMS, physical mixture and solid dispersions
| Position (2θ) |
Peak intensity |
||||
|
Intact telmisartan |
Physical mixture 1:1 |
Solid dispersion 2:1 |
Solid dispersion 1:1 |
Solid dispersion 1:2 |
|
|
14.1781 |
8713.11 |
3905.11 |
3625.59 |
3471.25 |
2051.43 |
|
15.0101 |
3623.26 |
2032.64 |
2157.86 |
2084,26 |
1449.26 |
|
22.2641 |
6801.54 |
3011.58 |
4138.31 |
3675,67 |
2014.06 |
|
24.9421 |
4090.83 |
2112.23 |
2659.64 |
2307,47 |
1589.82 |
Scanning Electron Microscopy Analysis
The morphology of intact TMS, intact HPMC E5LV, physical mixture, and solid dispersions all ratio is shown in Figure 2. TMS looked like needles in crystalline form, while HPMC E5LV looked like a fiber. The physical mixture of TMS – HPMC E5LV and solid dispersion depicted that TMS was on the surface of HPMC E5LV, but the difference in morphology among them could not be distinguished based on SEM result. In solid dispersion system, fine particles of TMS embedded on HPMC E5, a carrier hydrophilic LV, and contributed to the improvement solubility of TMS. Thus, solid dispersion of TMS in a hydrophilic carrier increase wettability TMS.
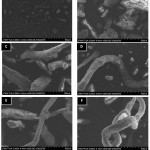 |
Figure 2: Scanning Elctrom Microscopy of (A) TMS, (B) HPMC E5LV, (C), Physical Mixture, (D) Solid Dispersion 2:1, (E) Solid Dispersion 1:1, and (F) Solid Dispersion 1:2 Click here to View figure |
FT-IR Spectroscopy Analysis
The FT-IR spectra of intact TMS, intact HPMC E5LV, physical mixture and solid dispersion is shown in Figure 3. TMS showed the OH strain at wavenumber 3047.63 cm-1 from carboxylic acid and C-H aliphatic strain at wave number 2939.80 cm-1. On the other hand, wave length of HPMC E5LV for OH strain was at 3400.43 cm-1 and C-H aliphatic strain were 2902.97 cm-1, 1590.77 cm-1 and 1046.36 cm-1. There was a shift wave numbers of OH strain from carboxylic acid at 3045.61 cm-1; 2881.97 cm-1; 2879.97 cm-1; and 2878.99 cm-1 for physical mixture and solid dispersion 1:2; 1:1; 2:1, respectively. This wavelength shift was still within the range of strain OH. Moreover, shift wave number of C-H aliphatic group of physical mixture and solid dispersion 1: 2; 1: 1; 2: 1 were at 2953.03 cm-1; 2959.22 cm-1; 2959.21 cm-1; and 2960.61 cm-1, respectively. Thus, there was no new functional group observed which indicated no chemical interaction occurred between TMS and HPMC E5LV in both physical mixture and solid dispersion at all ratio. This result was anticipated since the preparation of solid dispersion was not purposed to produce new substance, yet to modify the physicochemical properties 13.
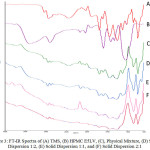 |
Figure 3: FT-IR Spectra of (A) TMS, (B) HPMC E5LV, (C), Physical Mixture, (D) Solid Dispersion 1:2, (E) Solid Dispersion 1:1, and (F) Solid Dispersion 2:1 |
Differential Scanning Calorimetry (DSC) Analysis
Thermal properties of intact TMS, intact HPMC E5LV, physical mixture and solid dispersion at all ratio can be seen in Figure 4. Based on DSC thermogram, TMS showed a sharp endothermic peak (Tpeak 268.96°C) corresponding to its melting event, indicating its crystallinity phase. Meanwhile, DSC thermogram of HPMC E5 LV showed a broad endothermic peak in the range 95.96°C, which may be attributed to dehydration of water molecules. The physical mixture and solid dispersions showed two peaks which represented TMS and HPMC E5LV. Based on the thermogram data, there was a decrease of TMS melting point. The melting point of TMS in physical mixture was 267.54°C while at solid dispersions 2:1, 1:1 and 1:2 were 268.41°C, 267.47°C and 266.90, respectively. This result is in accordance with PXRD result, where the solid dispersion at 1:2 showed the lowest peak intensity 3,9. However, the characteristic endothermic peak corresponding to drug melting point was broadened and shifted toward lower temperature with reduced intensity.
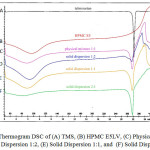 |
Figure 4: Thermogram DSC of (A) TMS, (B) HPMC E5LV, (C) Physical Mixture, (D) Solid Dispersion 1:2, (E) Solid Dispersion 1:1, and (F) Solid Dispersion 2:1 |
Solubility Test
The result of solubility test can be seen in Table 2. There was a trend observed as the increasing the amount of HPMC E5LV, the solubility of TMS increased significantly (P<0.05). Moreover, the solubility of physical mixture was also increased. This result is in accordance with the PXRD and DSC analysis. As the crystallinity degree of TMS decreased, the solubility of TMS increased. In addition, the mechanism of HPMC E5LV on increasing solubility was also due to the intrinsic characteristic of HPMC as the hydrophilic polymer which soluble in the water 10,11,12. Mechanical energy supplied during co-grinding process TMS – HPMC E5LV in a planetary ball mill apparatus may cause crystalline phase of TMS underwent partial amorphization and TMS dispersed in a hydrophilic polymer network in the form of fine particles14. Thus, the dominant factors affecting drug dissolution from the co-grinding particles were the reduction of drug crystallinity, a probable decrease in drug particle size, an increase in the de-aggregation and wettability of hydrophobic drug particles. Similar observations have been reported for mebendazole and norfloxacin where the solubility of this poorly water soluble was improved by high wettability and reduction of drug crystallinity 15-16.
Table 2: Result of solubility test
|
Materials |
Solubility (μg/ml) |
Enhancement of solubility |
| Intact TMS |
0.49±0.03 |
– |
| Physical mixture |
1.87±0.18 |
3.8 fold |
| Solid dispersion 2:1 |
5.36± 0.48 |
10.9 fold |
| Solid dispersion 1:1 |
7.24±1.73 |
14.7 fold |
| Solid dispersion 1:2 |
14.89±1.49 |
30.3 fold |
Conclusion
In the conclusion, the co-grinding method was successfully applied to prepare solid dispersions of telmisartan with hydrophilic polymer HPMC E5LV. Solid dispersions of TMS with HPMC E5LV has higher solubility than intact TMS and its physical mixture. The enhancement of the solubility may be due to partial amorphization of TMS crystalline phase.
Acknowledgment
The authors would like to thank for research granted by Hibah Klaster Guru Besar Andalas University No 17/UN.16/HKRGB/LPPM/2016. The authors also thank Mr. Mulyadi Sirin from PT. Tata Rasa Primatama for providing TMS in this research.
References
- Sharpe, M.; Jarvis, B.; & Goa, K. L. Drugs, 2001, 61(10), 1501-1529.
- Marasini, N.; Tran, T. H.; Poudel, B. K.; Cho, H. J.; Choi, Y. K.; Chi, S. C.; Choi, H.G.; Yong C.S. & Kim, J. O. Int. J. Pharm., 2013, 441(1), 424-432.
- Isaac, J.; Ganguly, S. & Ghosh, A. Eur. J. Pharm. Biopharm., 2016, 101, 43-52.
- Patel, J.; Dhingani, A.; Garala, K.; Raval, M. & Sheth, N. Powder Technol., 2014, 258, 331-343.
CrossRef - Borba, P. A. A.; Pinotti, M.; Andrade, G. R. S.; da Costa, N. B.; Olchanheski, L. R.; Fernandes, D.; de Campos, C.E.M. & Stulzer, H. K. Carbohydr. Polym., 2015, 133, 373-383.
CrossRef - Alatas, F.; Ratih, H. & Soewandhi, S. N. Int. J. Pharm. Pharm. Sci., 2015, 7(3), 423-426.
- Chadha, R.; Bhandari, S.; Haneef, J.; Khullar, S. & Mandal, S. Cryst.Eng.Comm, 2014, 16(36), 8375-8389.
- Dukeck, R.; Sieger, P.; & Karmwar, P. Eur. J. Pharm. Sci., 2013, 49(4), 723-731.
- Fitriani, L.; Haqi, A. & Zaini, E. J. Adv. Pharm. Tech. Res, 2016, 7(3), 105.
- Leuner, C. & Dressman, J. Eur. J. Pharm. Biopharm., 2000, 50(1), 47-60.
- Salman, Ardiansyah, Nasrul, E.; Rivai, H.; Ben, E. S. & Zaini, E. Int. J. Pharm. Pharm. Sci., 2014, 7(2), 209-212.
- Vasconcelos, T.; Sarmento, B. & Costa, P. Drug Discovery Today, 2007, 12(23), 1068-1075.
- Jamadar, S.; Pore, Y. & Sayyad, F. Part. Sci. Technol., 2014, 32(5), 512-519.
- Muehlenfeld, C.; Kann, B.; Windbergs, M. & Thommes, M. J. Pharm. Sci., 2013, 102(11), 4132-4139.
- García-Rodriguez, J. J.; Paloma, M.; Vegas-Sánchez, M. C.; Torrado-Durán, S.; Bolás-Fernández, F. & Torrado-Santiago, S. Int. J.Pharm., 2011, 403(1), 23-28.
- Loh, G. O. K.; Tan, Y. T. F. & Peh, K. K. Powder Technol., 2014, 256, 462-469.
CrossRef

This work is licensed under a Creative Commons Attribution 4.0 International License.
![]()
A New Edition of Web of Science
Journal Impact Factor
2022: 0.5
Five Year: 0.8
Journal is Indexed in

Cabells Whitelist
![]()


