Determination of the Percentages of Some Fatty Acids Present in A Sample of Olea Oil Traded in Sudanese Markets Present
M. J. A. Abualreish
Department of Chemistry, Faculty of Science and Technology, Omdurman Islamic University, Sudan.
Corresponding Author E-mail: Mustjeed_2008@hotmail.com
DOI : http://dx.doi.org/10.13005/ojc/330239
Article Received on : June 20, 2016
Article Accepted on : January 01, 2017
A sample of Olea oil obtained from the local market in Khartoum (Sudan) was analyzed by some chromatographic methods. The saponifiable and the unsaponifiable contents of the oil were determined ,which were found 79.08 % and 0.712% , respectively. It was found that the oil contains 69% fatty acids and 0.7 % sterols. The percentages of the fatty acids Stearic , Palmitic , Oleic and Linoleic in the oil were found 1.35 , 7.30 , 65.80 , and 4.91 % respectively.
KEYWORDS:Olea oil; Physicochemical Properties; Fatty acids
Download this article as:| Copy the following to cite this article: Abualreish M. J. A. Determination of the Percentages of Some Fatty Acids Present in A Sample of Olea Oil Traded in Sudanese Markets Present. Orient J Chem 2017;33(2). |
| Copy the following to cite this URL: Abualreish M. J. A. Determination of the Percentages of Some Fatty Acids Present in A Sample of Olea Oil Traded in Sudanese Markets Present. Orient J Chem 2017;33(2). Available from: http://www.orientjchem.org/?p=31521 |
Introduction
Olea oil is a fat obtained from the olive (the fruit of Olea europaea; family Oleaceae), a traditional tree crop of the Mediterranean Basin. The oil is produced by pressing whole olives. It is commonly used in cooking, cosmetics, pharmaceuticals, and soaps and as a fuel for traditional oil lamps. Olive oil is used throughout the world, but especially in the Mediterranean countries and, in particular, in Greece, which has the highest consumption per person.[1] Some olive oils thicken and gum more readily than others , and are thus less suitable for certain purposes [2] Olive oil is composed mainly of the mixed triglyceride esters of oleic acid and palmitic acid and of other fatty acids, along with traces of squalene (up to 0.7%) and sterols (about 0.2% phytosterol and tocosterols) [3].The composition varies by cultivar, region, altitude, time of harvest, and extraction process.
Olive oil contains polyphenols such as esters of tyrosol and hydroxytyrosol, including oleocanthal and oleuropein[4] ,having acidic properties that give extra-virgin unprocessed olive oil its bitter and punge nt taste. Olive oil is a source of at least 30 phenolic compounds[5]. Other phenolic constituents include aldehydic secoiridoids, flavonoids and lignans (acetoxypinoresinol, pinoresinol). [6] The latter two compounds are only present in extra virgin oil. [7] Hydroxytyrosol (2-(3,4-Di-hydroxyphenyl)-ethanol or DHPE) is a phenolic component of extra-virgin olive oil. An olive oil fraction containing DHPE was shown to inhibit platelet aggregation and eicosanoid (thromboxane B2) formation in vitro. [8] Oleocanthal from olive oil is a non-selective inhibitor of cyclooxygenase (COX) similar to classical NSAIDs like ibuprofen. It has been suggested that long-term consumption of small quantities of this compound from olive oil may be responsible in part for the low incidence of heart disease associated with a Mediterranean diet. [9] One of the most important developments in the analysis of oils and fats is the application of chromatography and one of the applications of chromatography to oil and fat analysis was made by Drummond and coworkers in 1953[10].
Material and Methods
All chemicals used were AnalaR grade. All solutions were prepared according to the usual analytical procedures. silica gel 60PF was used for preparation of thin layer plates for separation of unsaponifiable components. Pyeunicamltd gas liquid chromatography instrument was used for the analysis of fatty acids .
Olive oil is produced by grinding olives and extracting the oil by mechanical means.
General Procedure
Saponification of oil
An accurately weighed 4.9424 g sample of oil was saponified by boiling under reflux with (1M , 50 ml ) ethanolic potassium hydroxide for an hour , 100 ml of water was then added through the condenser . The mixture was transferred into a separtory funnel and extracted three times with ethoxy ethane ( 100 ml total ) . The combined ether extracts were washed with water (40 ml ) and (0.5M , 40 ml ) potassium hydroxide and the process repeated twice . The ether solution was washed several times with water until washing gave no colour with phenolphthalein . The solution was dried with anhydrous sodium sulphate and the solvent was evaporated in vaccue. The unsaponifiable residue was weighed and its percentage in oil was evaluated . The Unsaponifable fractions were kept in freezer for further analysis .
Fatty Acid Extraction
The soap solution obtained after saponification was acidified with concentrated hydrochloric acid ( 36 % 10 ml ). The fatty acids generated were then extracted with petroleum ether three times ( 100 ml total ) . The fatty acids solution was washed several times with distilled water until free from acid ( neutral to methyl orange indicator ) . The ether was removed in vaccue (25 – 30 CO ) and the percentage of fatty acids in the oil was evaluated. Preparation of fatty acid methyl ester [11]: 2.0017g of the fatty acid generated previously were refluxed with 50 ml methanolic sulphuric acid ( 2 ml of 98 % H2SO4 in 230 ml methanol ) . The methyl esters were then partitioned between petroleum ether ( 40 – 60 CO ) twice ( 100 ml total ) and the solvent was removed . Methyl esters of the sample was then dissolved in n – hexane and the solution thus obtained was introduced into gas liquid chromatography.
Preparation of Fatty Acids Standard
The same above procedure was repeated with each of the standard fatty acids , 1.0372 g of Stearic acid , 1.0146 g of Palmitic acid and 1.0669 g of Oleic acid.
Detection Method
Thin Layer Chromatography of the Unsaponifiable Component
The unsaponifiable fraction was dissolved in n- hexane , 5X20 cm glass plates were coated with silica gel 60PF ( in the ratio 2:1 ) water and silica gel, the temperature to complete dryness was 110 CO for half an hour in drying oven. A presaturated tank was prepared containing the solvent mixture (( mobile phase)) n- hexane : diethyl ether: acetic acid in the ratio 79:20:1 respectively. The unsaponifiable solution was then spotted using a capillary tube on the lower edge (2 cm from the edge), the plates were then inserted cautiously in the presaturated tank and left until the solvent reaches a few cms below the upper edge of the plate, finally removed and visualized by iodine vapour.
Results and Discussion
Thin layer chromatography is used for the analyzing of the unsaponifiable component quantitatively and four spots appeared on the plate of silica gel , which were due to demethyl sterol , 4- mono methyl and 4,4 dimethyl sterol.
The retardation factor (Rf) of each of the four spots was calculated.
The unsaponifiable component was found to be 0.712 % of the sample which is near to the standard value of 0.8%.
Table 1 : Conditioning of gas liquid chromatography.
|
Instrument |
Perkin –Elmer F33 |
| Type of columns | Gas column |
| Internal diameter | 0.25cm |
| Length of column | 1 meter |
| Packed with | 10% DEGS chromosorb Q |
| Type of detector | FID flame ionization detector |
| Flow rate of nitrogen (carrier gas) | 45 ml/min |
| Injector’s temperature | 300°C |
| Oven’s temperature | 170°C |
| Detector’s temperature | 300°C |
|
Charged speed |
5 mm/min |
Table 2 : The unsaponifiable component of the olive oil sample (Thin layer chromatography T. L. C):
|
Number of spots |
Distance in cm |
Rf |
|
Mobile phase |
17.8 |
….. |
|
Spot No.1 |
4.4 |
0.25 |
|
Spot No.2 |
4.9 |
0.28 |
|
Spot No.3 |
6.5 |
0.37 |
|
Spot No.4 |
7.8 |
0.43 |
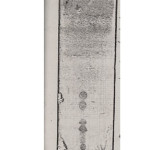 |
Figure 1: Chromatogram of thin layer chromatography of the unsaponifiable component of olive oil |
Table 3 : The standard retardation factor of some unsaponifiable compounds.
|
Compound |
Rf |
|
Demethyl sterol |
0.38 |
|
4-Monomethylsterol |
0.48 |
|
4,4-Dimethylsterol |
0.55 |
By comparing the retardation factors of the sample with the standard ones, it was found that spot No.3 is due to Demethyl sterol and spot No.4 is due to 4-Monomethylsterol.
Table 4 : Composition of Olive oil ( Gas liquid chromatography G. L. C):
|
Element |
Weight in gram |
Experimental percentage % |
Theoretical percentage % |
| Sample |
4.999 |
100 |
– |
| Saponifiable compounds |
3.9543 |
79.080 |
– |
| Unsaponifiable compounds |
0.0356 |
0.712 |
0.8 |
| Others |
1.01 |
20.208 |
– |
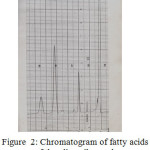 |
Figure 2: Chromatogram of fatty acids of the olive oil sample |
Table 5 : Retention times of the standard fatty acids:
|
Methylated fatty acids |
Distance between solvent and peaks |
Retention times of the standards fatty acids (Rt) |
| Methyl palmitate |
3.7 |
7.4 |
| Methyl stearate |
6.6 |
13.2 |
| Methyl oleate |
8.2 |
16.4 |
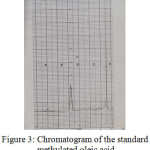 |
Figure 3: Chromatogram of the standard methylated oleic acid |
Table 6 : Retention times of the fatty acids in the sample:
|
Number of peaks in the sample |
Peak 1 |
Peak 2 |
Peak 3 |
Peak 4 |
Peak 5 |
|
Distance between solvent and peaks |
3.5 |
4.4 |
6.5 |
8.0 |
10.0 |
|
Rt |
7.0 |
8.8 |
13.0 |
16.0 |
20.0 |
By comparing the retention times of the methylated sample with that of the standard ones, it appears that there is Palmitic, Stearic and Oleic acids, the fourth and the fifth peaks probably due to Linoleic acid and other components.
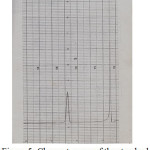 |
Figure 4: Chromatogram of the standard methylated stearic acid |
Table 7 : The percentage of methylated fatty acids of the samples
|
Methylated fatty acids |
Peak high in cm |
1/2 Peak base |
Area under the peak cm2 |
Experimental percentage |
|
Methyl palmitate |
7.20 |
0.15 |
1.08 |
9.20% |
|
Methyl stearate |
0.50 |
0.40 |
0.20 |
1.71% |
|
Methyl oleate |
12.00 |
0.80 |
9.60 |
82.29% |
|
Methyl linoleate |
2.90 |
0.25 |
0.725 |
6.21% |
|
Others |
0.60 |
0.10 |
0.06 |
0.51% |
Four fatty acids namely , Palmitic, Stearic , Oleic and Linoleic were detected in the sample of the oil by gas liquid chromatography and their percentages were calculated. The fatty acids in the sample were converted to methyl esters because they have short time and hence short analysis time [12].
The identification of each fatty acid in the sample of the oil was carried out by comparing their retention times with that of the standard ones.
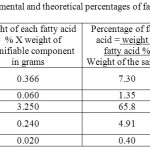 |
Table 8 : The experimental and theoretical percentages of fatty acids in Olive oil: |
The data in table (8) show that two of the four fatty acids determined namely, Oleic and palmitic acids constitute the major component of the oil 65.80 and 7.30% respectively, while Linoleic and Stearic acids are present in a minor component of the oil 0.240 and 0.06% respectively.
References
- North American Olive Oil Association: “About Olive Oil – Consumption””.2013, Retrieved June 11.
- Suliman, A.M ; Jackson, J.K, Sudan Silva. 1959, 9.
- Hussein,S. A; Dollar, F.G and O’Connor, R. T , J. Amer. Oil. Soc, 1949, 26,730 – 732.
- Tripoli , E.; Giammanco ,M.; Tabacchi, G.; Di Majo , Di Majo ,D.; Giammanco ,S.; and Maurizio La Guardia. Nutrition Research Reviews. 2005 18, 98–112.
- Tuck , K. L and Hayball , P.J, The Journal of Nutritional Biochemistry. 2002, 13, 636-644.
- Owen ,R.W; Giacosa ,A; Hull ,W.E; Haubner ,R; Spiegelhalder , B and . Bartsch ,H, European Journal of Cancer. 2000, 36, 1235-1247.
- Owen R. W.; Mier ,W.; Giacosa ,A.; Hull , Hull W. E.; Spiegelhalder B. and Bartsch, H., Clinical Chemistry. 2000, 46, 976-988.
- Petroni ,A.; Blasevich ,M.; Salami, M.; Papini N.; Montedoro ,G. F. and Gallia, C., Thrombosis Research .1995, 78, 151–160.
CrossRef - Russell ,L. L and Keast ,A., , Current pharmaceutical design. 2011, 17 (8),754–768.
- J . Of development and industry.1987,industrial research and consultancy center 34.
- Metcalte ,L.D; Schmitz ,A.A, and Pelka ,T.R, , J. Anal.Chem. 1966, 38, 514.
- Nomana,P. J. Of Chrom, 1978 ,615, 149 – 150.

This work is licensed under a Creative Commons Attribution 4.0 International License.
![]()
A New Edition of Web of Science
Journal Impact Factor
2022: 0.5
Five Year: 0.8
Journal is Indexed in

Cabells Whitelist
![]()


