Corrosion Rate Monitoring of Mild Steel in underground Soil at Different Depths using Electrical Resistance (ER) Probe Technique
S. Suganya1, R. Jeyalakshmi1 and N. P. Rajamane2
1Department of Chemistry, SRM University, Chennai,Tamilnadu, India.
2CACR, SRM University, Chennai, Tamilnadu, India.
Corresponding Author E-mail: rajyashree64@gmail.com
DOI : http://dx.doi.org/10.13005/ojc/330245
Article Received on : April 28, 2016
Article Accepted on : February 02, 2017
The mild steel used as a rebar facing a major corrosion challenge when it exposed to different kinds of soil especially in the underground construction or buried structure, pilings etc., This study investigates metal loss of mild steel by studying the in-situ-soil parameters at the selected site . ER probe is used as a real time monitoring technique by installingin native and sea water simulated soil condition at different location below the ground level of 3,6, and 9 m . At the laboratory,two probes have been packed in the tray with the typical soil taken from the site. Corrosion rate were measured for a period of 18 months. The steady state corrosion rate under sea water simulated soil was found to be 2.39 mpy in 3m depth. The chloride content increases the ability of electrolyte to conduct current and enhanced the corrosion process. Probe reading are not measurable count from the native soil under all depth levels. Analysis of polarization curves led to corrosion rate of coupons kept under soil extract exposed at a period of 30 days and the corrosion rate of mild steel was calculated by tafel analysis. The optical microscopic examination indicated the roughness of the surface of metal.
KEYWORDS:soil corrosion; real-time corrosion monitoring; ER probe; pitting corrosion
Download this article as:| Copy the following to cite this article: Suganya S, Jeyalakshmi R, Rajamane N. P. Corrosion Rate Monitoring of Mild Steel in underground Soil at Different Depths using Electrical Resistance (ER) Probe Technique. Orient J Chem 2017;33(2). |
| Copy the following to cite this URL: Suganya S, Jeyalakshmi R, Rajamane N. P. Corrosion Rate Monitoring of Mild Steel in underground Soil at Different Depths using Electrical Resistance (ER) Probe Technique. Orient J Chem 2017;33(2). Available from: http://www.orientjchem.org/?p=30992 |
Introduction
The corrosion of metallic structures buried in soils or in contact with soils has long been a serious engineering and economic problem. Underground metal structures are usually expected to have a long durability and service life but very often structures like pipe lines, constructed buildings are affected by soil corrosion. The main factors for soil corrosion are found to be nature of the soil, geo technical properties, soluble chemicals, pH, resistivity, chloride and sulphate contents. In order to reduce the corrosion damage, it is necessary to monitor the corrosion rate periodically to prevent the metal from corrosion damage.
Underground metal structures are usually expected to have a long working life, often 50-100 years, but before such structure is put on site the risk of corrosion and the need for corrosion protection measures should be estimated. NACE recommends using a high pitting corrosion rate of 16 mpy (0.4 mm/year) to determine the interval time for external corrosion direct assessment (ECDA). This rate represents the upper 80% confidence level from long-term corrosion tests of unprotected steel in various soils. When reliable estimation of corrosion growth rate is not used, default corrosion rate of 16 mils per year may be used for any design aspect. Therefore, it is of interest to obtain information about corrosion rate by valid methods of determination[1-3].
In literature different experimental methods have been suggested to measure the corrosion rate in soil such as weight loss measurements with buried coupons under different exposure period,electrochemical techniques[4-8], electrical resistance (ER) probes [9-14]. The present research project evaluated the use of such techniques in estimating the external corrosion growth rate of rebar of underground structure at the identified site.
Selection of Site: underground Structure Metro Rail Station Near Shenoy Nagar, Chennai
Box Slabs which are supported on 25 to 30 m deep, 1m wide and 5 m long Diaphragm Walls, panels. The Diaphragm Walls are constructed using M40 concrete and Bentonite slurry as stabilizing fluid. Design cover thickness for rebars in the Walls is 80mm. After excavation of the soil in between the Diaphragm Walls, less cover was observed at several locations; few cover blocks were exposed directly and rebars were found to have no cover at some places. This led to presumption that the rebars of the soil side surface of the walls could have been exposed directly to soil at some locations may lead to corrosion.Mostly soil engineering properties, type and soil contents, moisture content , presence of aggressive ions are other important parameters that influence soil corrosivity and level of underground dynamic corrosion. Hence pilot project was taken to investigate corrosion rate real time monitoring for longer period at the site conditions adopting different techniques. Soil samples collected from the site were used for further study at laboratory conditions throughout.
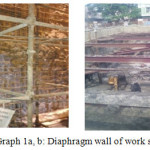 |
Graph 1a,b: Diaphragm wall of work site |
Materials
The chemical and physio chemical parameters of the soil were determined and observed parameters were tabulated in Table 1.
Materials Preparation
The mild steel coupons of dimension 200mm x 25 mm x 5mm were used for field buried tests and 4 cm x 1 cm x 0.2 cm for electrochemical studies. The specimens were polished mechanically with emery papers ranging from 400 to 1200 grits [15]. All the specimens were washed with distilled water and degreased with acetone after drying kept in desiccators to avoid atmospheric corrosion. The composition of the mild steel was confirmed by optical emission spectroscopy (OES analysis) and the result was tabulated in table 3.
Methods
Electrical Resistance Method
The electrical resistance (ER) device measures the corrosion rate of a metal alloy having a composition similar to the mild steel material when placed in a corrosive environment. The device is suited to corrosive environments having either poor or non‐continuous electrolytes. The ER device consists of a read out instrument connected to a probe. The measuring instrument provides metal loss and corrosion rate when consecutive measurements are taken of the same probe in the field. Photograph 2 a,b shows the “Metal samples” ER device used in the testing program. It works on the principle that the corrosion causes metal loss due to electro chemical action, thereby creating the changes in the electrical resistance of the metallic test element.
The ER device calculates corrosion rate from the electrical resistance of a metal probe R in the equation: R=r *L/A , where r is the specific resistance of the metal element, L and A are the element length and cross‐sectional area, respectively. The element’s electrical resistance is proportional to its total mass‐loss due to corrosion. In the present case, the metal loss in terms of thickness is directly given as the output after the internal micro-processed based calculations and thereby corrosion rate over a period of time can be computed. When two consecutive mass‐loss readings (M1 and M2) are taken by the device, the corrosion rate (CR) can be calculated
CR = 365 *(M1-M2)/ Δt .Where Δtis the time between the two readings in days. An ER probe type Flush 20 and a read outbox model “Metal Samples” MS1500E were used in the field and the details of installation of ER probe are given in the Table 1.
Table 1: Details of ER probes installation
|
ER probeID No |
Date | Depth (m) |
Soil condition |
| 803 a | 15.09. 2014 | 3 | Native soil |
| 804 | 15.09.2014 | 6 | Native soil |
| 808 | 14.10.2014 | 9 | Native soil |
| 806 | 17.09.2014 | 3 | Sea water saturated soil: (5% NaCl ) |
| 800 | 19.05.2015 | 1m | Native soil (laboratory) |
| 803 b | 19.05.2015 | 1m | Sea water saturated soil ( laboratory) |
The ER probes are backfilled using the same backfill that is used around the pipe. The end connectors of the probes are placed in a protected case at the ground surface to allow for ER monitoring. Initial reading is taken after the placement of the backfill. Consequent readings are taken periodically to monitor corrosion rate. The measurements are uploaded to a computer from the readout box for data analysis and plotting.
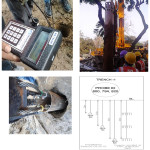 |
Graph 2a: ER probe Metal Samples (b) Probe installation by auguring (c) Bore hole (d) Outline of installation |
Electro Chemical Measurements
Soil collected from the depth of 1m was air dried and sieved by using 1.33mm sieve, mixed with water 2:10 weight % and kept in shaker for 8hours. It was then filtered after 24 hours and used for polarization studies (Biologic SP 300 work station)in a three electrode system. Platinum mesh used as a counter electrode (15mm x 15mm) against SCE. The steel sample with an exposure of 1.0 cm2 was used as a working electrode. Potentio dynamic polarization studies are carried out with the scan rate 1mV/S, at ambient temperature.
Results and Discussion
Composition of the mild steel is given in the Table2. The soil samples taken from the experimental site (field) of different locations and soil characteristics were analyzed using standard procedure. The physico chemical properties are given in the Table 3.
Table 2: The chemical composition (w/w %) of mild steel (Based on Optical Emission Spectroscopy
|
Element |
C | Si | Mn | P | S | Cr | Ni | Zn | Mo |
Fe |
| Composition% | 0.227 | 0.178 | 0.439 | 0.018 | 0/012 | 0.08 | 0.065 | 0.03 | 0.017 |
remaining |
Table 3: Physico Chemical properties (wet analysis) of the soil samples used in the study
|
Parameter |
Sample1 | Sample 2 | Sample 3 | Sample 4 |
Sample5 |
| Dry matter (%) | 0.60 | 6.65 | 5.2 | 5.48 | 14.9 |
| Total organic carbon (%) | 0.10 | 0.69 | 0.63 | 0.67 | 0.27 |
| pH | 7.84 | 8.36 | 8.26 | 8.10 | 7.18 |
| Electrical conductivity- µmhos/ cm | 228.9 | 150 | 134 | 129.4 | 91.16 |
| Cation exchange capacity- meq/kg | 12.94 | 13.4 | 13.07 | 16.5 | 10.95 |
| Calcium (mg/kg) | 859 | 2221 | 8185 | 2277 | 2259 |
| Magnesium (mg/ kg) | 1043 | 6739 | 1242 | 5527 | 2740 |
| Sodium (mg/kg) | 1275 | 2150 | 39.6 | 3.1 | 2756 |
| Potassium (mg/kg) | 3107 | 397 | 390 | 575.5 | 390 |
| Total organic matter (%) | 0.18 | 1.18 | 1.08 | 1.16 | 0.47 |
| Chloride (mg/kg) | 399 | 50 | 200 | 202 | 202 |
| Sulphate (mg/kg) | 1160 | 543 | 750 | 608 | 184 |
| Carbonate(mg/kg) | Nil | Nil | Nil | Nil | Nil |
| Phosphate (mg/kg) | 505 | 3010 | 1083 | 910 | 160 |
| Bicarbonate (mg/kg) | 2100 | 3063 | 2545 | 2599 | 1587 |
Estimation of Corrosion‐Rate Through on-Line Measurement using ER Probe
Readings from ER probe installed during September 2014 in the densely packed soil and readings are taken for 18 months. The change of corrosion rate against time duration measured through ER probe, both study site and laboratory conditions are shown in Fig 1.0.The measured corrosion rate from ER probe are from under 3,6 and 9 m depth (from the ground level) in the native soil were approximately 4 nm/year (0.0002 mil/year) ( almost the same as initial readings) which is below the lower detection limit of the analyzer (10 nm/year). Upon insertion of NaCl solution in the soil (ER 806) the signal instantly increased as 2.25 mpy within 2 hrs, which is close to the rate of mild steel material in the simulated sea water. Following the steep decrease the corrosion rate was from 2.25 to 1.04 for 3 month period of test (90 days). The rapid decrease of corrosion rate was probably due to the formation of corrosion products and the depletion of reactants (oxygen for example). After attaining stabilizing period, the corrosion rate was found to be in the range 1.04 – 0.75 mpy for the period of 60-120 days and shown an average value of 0.70 mpy till 200 days. It was probably due to the low diffusion rate of the reactants and products involved in the corrosion process during the hot sunny days. Further steady increase in corrosion rate was observed till 420 days period of study.
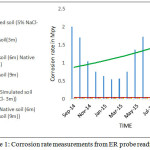 |
Figure 1: Corrosion rate measurements from ER probe readings |
Metallic corrosion in soil is an electrochemical process in a thin moisture film adsorbed on the metal surface . The oxidant (or cathodic depolarizer) is necessary for corrosion process to proceed. It is generally granted that O2 reduction acts as predominant cathodic process supporting soil corrosion .Soil corrosion is affected by a significant number of soil and environmental parameters including soil resistivity, water content, pH, soluble salts, oxygen concentration, soil chemistry, and microbial activities. A study conducted by the National Institute of Standards and Technology (NIST) on bare steel buried underground at different sites representing different types across USA to predict corrosion rate based on soil properties. The data on pitting rate measurements was correlated with various soil properties. It was revealed that the resistivity which indicates the ability of the soil to carry corrosion current is a function of soil moisture and the concentration of current‐carrying soluble ions. The higher the resistivity of the backfill/soil, the higher is its resistance to the electro‐chemical corrosion of the metal.
In our study the electrical conductivity of native soil is in the range of 100-225 µmhos/ cm, and hence soil in contact with ER probe may not induce any corrosion of the metal in the probe. Chloride and sulphate content are in the range of 200-400 and 200-1000 mg/kg respectively and are well within the threshold level in the native soil. However the soil in contact with the probe’s sensing surface in the simulated seawater-soaked soil, corrosion rate is found to be higher and increasing with time duration. Reasonable maximum rate of corrosion loss in relatively uniform soils would be approximately 2.5 mils/year. (about 0.625 mm per year). Hence the one and half year exposure time in a simulated corrosive soil medium (ER Probe ID 806), being much less than 3mpy, this rate may be taken to be corresponding to ‘no active’ corrosion. ER probe reading taken from sea water saturated native soil and clay soil showed low corrosion rate less than 1 mpy for 6 months duration time at laboratory. Probably short duration time showed only the initiation of corrosion.
Electro Chemical Measurement
The polarization curves of steel coupons before and after exposure into the soil extract for a period of 30 days. Polarisation curves of both control (0thday ) and 30 days are shown in fig 2. The corrosion potential, corrosion current density were calculated from Tafel slope by fitting the curves for both anodic and cathodic branches. As seen from the values of corrosion potential (table 4) it was found that the corrosion rate is increasing with time.
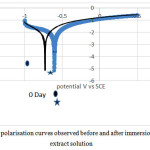 |
Figure 2: Polarisation curves observed before and after immersion in soil extract solution |
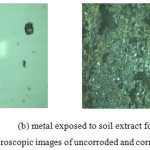 |
Figure 3: Optical microscopic images of uncorroded and corroded specimens Click here to View figure |
Table 4: Polarization parameters for the corrosion of mild steel in soil extract solutio
|
Exposure time (days) |
E corr | icorr (µA/cm2) | βa(mV) |
βc(mV) |
| 0 | -634.583 | 5.105 | 242.9 | 287.7 |
| 28 | -730.590 | 6.307 | 243.3 | 261.8 |
Optical microscopic examination of the specimen before and after exposure to soil extract showed that formation of pits and evident for the presence of corrosion products over the metal surface. Images are taken from the upright optical microscope (Olympus, Japan) 200X are shown in the above Figure 3.
Optical microscopic examination of the specimen before and after exposure to soil extract showed that formation of pits and evident for the presence of corrosion products over the metal surface. Images are taken from the upright optical microscope (Olympus, Japan) 200X are shown in the above Figure 3.
Conclusion
The ER device provides consistent long-term measurements of corrosion rate of the buried structure without the need for field excavation. The probe measurements typically model the localized metal loss at the surface as reflected by change of the probe’s electrical resistance.
Corrosion in undisturbed soil is limited by the availability of oxygen necessary for the cathodic reaction. This was demonstrated in the observed zero corrosion rate at depth of 6 and 9 m.
Average corrosion rate of 2.3 mpy observed under sea water saturated soil at 3 m depth probably due to soil electrochemical reaction with dissolved salts but it was found to be in “no active corrosion range”.
Microscopic examination revealed that there is not much pit is formed and hence general corrosion rate will be related to moisture content and dissolved salts (chloride content)
Electro chemical studies has shown the increase in the corrosion rate over the period of thirty days time interval.
Acknowledgement
The authors gratefully acknowledge the support of M/S TRANSTONNELSTROY–AFCONS JOINT VENTURE for sponsoring current study and express thanks to the staff of Chennai Metro Rail Limited (CMRL). Authors acknowledge Er. H Jayaram (Project Manager) and Er. Prasad Reddy, (Project coordinator), CMRL for technical discussions, useful suggestion valuable comments and for help on underground tests.
References
- Roberge, P.R., Handbook of Corrosion Engineering. McGrow Hill, 1999 second Edition. Baboian,
- NACE Corrosion Engineer’s reference Book. NACE, 2002.Third edition ISBN: 9781575901275.
- Bradford, S., Practical Handbook of Corrosion Control in Soils. CASTI, 2000.
- Vanessa de Freitas Cunha Lins; Mitchel Leonard Magalhaes Ferreira; Patricia AlvesSaliba. J. Mater. Res. Technol.2012, 1(3),161-166.
- Maocheng Yan; Cheng Sun ;Jin Xu; Wei Ke.Int. J. Electrochem. Sci., 2015, 10, 1762 – 1776.
- Cosmes Lopez , L.J; Arce , E; Torres, J; Vazquez Arenas , J; Hallen, J.M; Cabrera-Sierra, R.Corrosion201167(11),161-166.
- Maocheng Yan; Cheng Sun; Jin Xu; Wei Ke.Int. J. Electrochem. Sci.,2015,10,pp 1762 – 1776.
- Roberge,P R; Handbook of Corrosion Engineering. McGraw-HillCorrosion2006; 62,35–43.
- Kim, D;Muralidharan,S;Ha ,T;Bae,J; Ha, Y; Lee, H; ElectrochimicaActa.2006,51,5259–67.
CrossRef - San Antonio, TX;CORROSION 2005, paper no. 05381.
- Yan,M; Wang, J; Han, E; Ke, W. Corros Sci.2008, 50 1331-1339.
CrossRef - Yan, M.C; Wang,J.Q; Han,E.H; Ke,W. Corrosion Engineering Science and Technology,2007, 42, 42-49.
CrossRef - Kempe, P; Denzine,A;Tiefnig .E; Corrosion 2000, paper no. 00092 (Houston, TX: NACE, 2000).
- Varela ;Tan , M.Y; Forsyth, M; Corrosion Engineering Science and Technology. 2015.
- ASTM G1, Standard Practice for Preparing, Cleaning and Evaluating Corrosion Test Specimens. American Society of Testing and Material, 2003.

This work is licensed under a Creative Commons Attribution 4.0 International License.
![]()
A New Edition of Web of Science
Journal Impact Factor
2022: 0.5
Five Year: 0.8
Journal is Indexed in

Cabells Whitelist
![]()


