Studies of the Substitution Yttrium in Pbtio3 Systems
Abdelhalim Elbasset1,2, Lamiae Mrharrab2, and Salahedine Sayouri2
1LSSC Department of Electrical Engineering, Faculty of Science and Technology (FST), Universit Sidi Mohamed Ben Abdellah, Fes, Morocco.
2Department of Physics, Sidi Mohammed Ben Abdellah University, Faculty of Sciences D-M, B.P.1796, Fez-Atlas Morocco.
Corresponding Author E-mail: elbasset.abdelhalim@gmail.com
DOI : http://dx.doi.org/10.13005/ojc/330143
Lead titanate PbTiO3 was successfully doped by yttrium (Y), is prepared by the sol-gel method and characterized by X-Ray diffraction (XRD) and Raman spectroscopy. The results obtained showed that Yttrium lead to a sharp decrease in the lattice parameter c accompanied by a small increase in a parameter up to 10% yttrium. By cons beyond 10 mol%, these parameters a and c are evolving slightly to converge towards the same value (a ≈ c). The investigations done by Raman spectroscopy showed the there is a concentration threshold appears around 10% of Y my corresponding in a change in the substitution process in PT sites. it was revealed that substitution Y2+ by a bivalent lead ion Pb2+ in PbTiO3, not require the load compensating, by cons when the rate Y is greater than 10%, the substituted yttrium has both Pb2+ and Ti4+ in the structure PbTiO3 which requires cost compensation.
KEYWORDS:Load compensating; Yttrium (Y); Lead titanate PbTiO3
Download this article as:| Copy the following to cite this article: Elbasset A, Mrharrab L, Sayouri S. Studies of the Substitution Yttrium in Pbtio3 Systems. Orient J Chem 2017;33(1). |
| Copy the following to cite this URL: Elbasset A, Mrharrab L, Sayouri S. Studies of the Substitution Yttrium in Pbtio3 Systems. Orient J Chem 2017;33(1). Available from: http://www.orientjchem.org/?p=29527 |
Introduction
Lead titanate (PbTiO3 (PT)) a perovskite type compound has a great scientific and technological interest. This compound relongs to the of high performance materials for various types of applications: dielectrics for capacitors, electromechanical converters, infrared detectors, electro optical modulators, memories… The method of preparation of these material plays a very important role in their properties, it can lead to the improvement of these properties, even the discovery of new things (original). However,suitable suitable PT doping (ion substitution) allows for example to modulate the dielectric constant, the Curie temperature, the relaxation frequency or resonance, for such a given application. In the case of these PT ceramics, disorder metal cations, at site B (Ti) of the perovskite structure ABO3 (PbTiO3), is the common point of all the complex compounds such as PZT1, PZN-PT2, PMN-PT3. However for compounds based on PbTiO3 with good density and reducing the fragility and also to study the structural and dielectric properties, many dopants were used (Ca, Co, W, La, Sm, Dy and Mn…) 4-9.
However, no structural study of Y doped PbTiO3 doped Y was presented in the literature. Consequently, this document provides a Raman investigation on the effect of the doping rate (Y) the vibrational modes of PbTiO3 powders and its distribution in the PT sites with the study of its influence on the macroscopic symmetry of the mesh. The analysis of the spectra obtained by the Raman spectroscopy shows that the site occupied by the Y depends on its concentration. From the results obtained, we established a model indicating that up to 10% Y, Y2+ ions integrated site A, whereas beyond of 10% it they may occupied both sites A (Pb2+) and B (Ti 4+).
Synthesis
Pb1-xYxTiO3 (PYT) powders with x varying from 0 to 0.3 were obtained by the sol-gel method, a soft chemical route. Accordingly, titanium isopropoxide (99% purity, Aldrich) was dissolved in an aqueous solution of citric acid, to have a colloidal solution of titanium. A stoichiometric amount of ground of titanium was added to the lead acetate, Pb(CH3COO)2.3H2O, (99% purity, Aldrich). Y(CH3COO)2.3H2O (99.9% purity, Aldrich) dissolved in nitric acid was used as source of Y and added to the reaction mixture. The mixtures Put under agitation in 60°C for a few minutes, then were dried at 80°C for 96 h. For material crystallization, Every powder were heat treated at 650 °C for 4 h under oxygen flow in a tube furnace. The formation of the crystalline phase of the sintered samples was analyzed by X-ray diffractometry (XRD) at room temperature using a PANalytical X’Pert Pro diffractometer system with Cu Ka radiation from 15° to 80° at 2θ intervals. A micro Raman spectrometer (Horiba Jobin-Yvon ) was used with an excitation source at 532 nm at a power level of 40 mW, providing from the second harmonic line of a Nd:YAG laser, and with a CCD (charge-coupled device) detector. Spectra were recorded at room temperature in the range 50 – 3500 cm-1.
Result
XRD spectrum of powder of pure PT (Fig.1) has characteristic peaks of the tetragonal structure of PbTiO3 without the presence of secondary phases. The lines of doublets [(001-100), (101-110), (002-200), (201-210) and (112-211)] are characteristic of this phase10. For Y doped PT it is always observed peaks indicating the presence of pure perovskite phase. We can also indicate that up to 30 mol%, yttrium is soluble in the PT. However; when the rate of Y increases rays of doublets cited above tends to merge and put in evidence decreased quadracite mesh. These figures show as a parameter undergoes an average increase of 4.6% between pure PT and PYT: 10%, then a relatively small increase of 0.4% between 10% and 30% of Y. However, the parameter c undergoes a significant decrease 19.1% between 0% and 10% of Y, then a very slow decay up to 30%. Otherwise, the quadracité c/a decreases in a brutal way, 6.07% between 0% and 10% of Y, then an almost linear manner to 30% in Y has a value close to unity (Fig. 2).
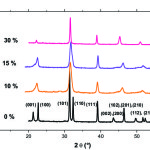 |
Figure 1: XRD spectrum of powder of pure and doped PT |
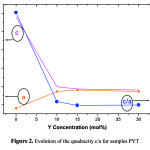 |
Figure 2: Evolution of the quadracity c/a for samples PYT |
We noted that the addition of yttrium has low concentrations (<10%) is accompanied by a significant decrease quadracite c/a. We can interpret this decrease based on the substitution of Pb2+ ions by ions of the dopant Y2+. Indeed, Y2+ and Pb2+ have the same valence, which favors the phenomenon of substitution of Pb ions by those of Y in matrix PT. However, the ionic radius of Y, r(Y) = 0.9 Å, lower than that of Pb is equal to r(Pb)=1.2 Å. This difference betwen ionic radii and electronegativity is responsible for changing the structure of PbTiO3. In the case of pure lead titanate, in accordance with the value of Goldsmith tolerance factor (t <1) 11, the structure is quadratic. In other words, the parameter c is greater than the parameter a giving more possibilities for mobility of Pb ions along the c-axis (Figure 3.a). Or when ion Y2+ substitute ion Pb2+, the distance Pb-Pb corresponding to the parameter c is transformed into distance Pb-Y, the c decreases because the radius of Y is less than that of Pb. Based on this finding and assuming that Y is always placed in the A site (Fig.3.b) we can expect is that the increase of Pb ion substitution rates by Y result in a reduction of the distances between the sites A and consequently a decrease in the parameter c. This is in good agreement with the results we have achieved for dopant concentrations up to 10% of Y from the XRD spectra PYT, the parameter c decreases sharply, while the parameter a undergoes only a small increase of a slowdown in elementary mesh and therefore an increase in coulombic force in the presence in that direction. However, when the rate of Y increases beyond 10%, c decreases slightly and tends towards the parameter a which unlike the parameter c increases slightly. It shall indicate that within this range the parameters a and c virtually no longer change, which allows to assume that part of Y2+ ions started to occupy the site (B of ABO3), Ti radius rTi= 0.69 Å and comparable in size to the radius rY of Y. From a structural point of view and considering the Ti-O distance equal to distance Y-O, changing the geometry of octahedra BO6 should be almost identical in the case of octahedra YO6 that in the case of octahedra TiO6. This suggests a saturation of incorporation are opportunities on the natural site of the ion Pb2+ (for x> 0.1) and incorporation of dopant ions on the B natural site of Ti4+ ions (Figure 3.c). It does not exist in the literature, to our knowledge, information about lead titanate ceramics doped with yttrium allowing us to confirm our model and to make a comparative study with our results. We therefore considered the obtained results with a dopant that is closest to our case study: ion Ca2+ 12-18. Indeed, the latter possesses the same valence as the Y with an ionic radius rCa = 1Å intermediate between that of the Y and Pb.
![Figure 3: Diagram of the structure PYTx [(a): x = 0 %, (b) 0< x ≤10%, and (c): x>10%]](http://www.orientjchem.org/wp-content/uploads/2017/01/Vol33No1_Stud_ABDE_fig3-150x150.jpg) |
Figure 3: Diagram of the structure PYTx [(a): x = 0 %, (b) 0< x ≤10%, and (c): x>10%] |
The interpretation of the results of the analysis of the structural properties of PYT:x, can therefore be approximated by the results of the literature in PCaT:x. Table 1 presents the results of studies of PT doped of different calcium levels prepared by different routes and placed under various forms.
Note that doping Ca reduces the lattice parameter c and the quadracite c/a, but the decrease is more significant in PYT:x (tableau 1)12-18. This difference in behavior with the two doping can be explained by the relative value of the ionic radius of Ca2+, which is greater than Y2+. Indeed, quadracite the c/a of PT:Y decreases faster when replacing Pb2+ ions by ion Y2+, indicating that the quadracite c/a is strongly correlated to the ionic radius of the dopant. However, note that the lattice parameters are very influenced by the ionic nature of atomic bonds and the physicochemical factors related to the preparation 13, 14.
Table 1: Parameters of mesh composed PT:Ca it prepared by different methods and different concentrations of Ca2+
|
% of Ca |
a (Å) |
c (Å) |
c/a |
method |
condition |
Refe. |
|
24 |
3.89 |
4.04 |
1.04 |
Sol gel |
Massif |
12 |
|
40 |
3.89 |
3.94 |
1.01 |
|||
|
50 |
3.89 |
3.89 |
1 |
|||
|
20 |
3.83 |
4.03 |
1.05 |
Sol gel |
Film |
15 |
|
24 |
3.86 |
4.02 |
1.04 |
|||
|
28 |
3.89 |
3.97 |
1.02 |
|||
|
0 |
3.884 |
4.106 |
1.057 |
Sol gel |
Film |
16 |
|
10 |
3.881 |
4.061 |
1.046 |
|||
|
20 |
3.875 |
4.022 |
1.038 |
|||
|
20 |
— |
— |
1.045 |
Conventional solid state reaction |
Massif |
17 |
|
40 |
— |
— |
1.015 |
|||
|
50 |
— |
— |
1.003 |
|||
|
0 |
3.89 |
4.14 |
1.0642 |
Sol gel |
Massif |
18 |
|
1 |
3.891 |
4.1386 |
1.0636 |
|||
|
4 |
3.8915 |
4.135 |
1.0625 |
|||
|
7 |
3.8919 |
4.13 |
1.0611 |
|||
|
10 |
3.8922 |
4.127 |
1.0603 |
|||
|
32 |
3.893 |
4.049 |
1.04 |
Figure 4 shows the Raman spectra of pure and doped PT materials. We can notice that all modes of vibration of pure PT are characteristic of the tetragonal structure. A number of these patterns persist in the Raman spectra of different compositions. Otherwise, when the concentration of Y increases to 10% (fig. 4) we can observe the disappearance of modes E(LO2) and B1+E and the gradual disappearance of mode E(TO1), accompanied by a significant decrease in intensity of the modes A1(TO1), E(TO1) and A1(TO3) and an enlargement of the other bands.
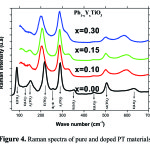 |
Figure 4: Raman spectra of pure and doped PT materials |
This expansion is the result of the disordered character of the phase and these changes can be attributed to the presence of defects created to ensure the electrical neutrality of the mesh. This result shows that the tetragonal structure of PT seems to disappear for the other samples showing the appearance of a pseudo-cubic phase. The adjustment of the Raman active modes confirms that the frequency and width a half heights modes of PYT:x are sensitive to doping Y. Indeed, Figure 5.a confirms that the frequencies of these modes vary with the concentration of Y. In particular the two modes E(TO1) and A1(TO1) no longer appear on the Raman spectra for the 30% concentration, due to the pseudo cubic structure that these compositions exhibits. Or, we know from the literature 19 these modes correspond to the vibration of ions at site A (Pb) from the octahedra BO6 (TiO6). The movements associating vibration E(TO1) and A1(TO1) modes are along the axes a and c, respectively20.
When the structure of PYT:x changes from tetragonal phase to cubic phase (following the increase in dopinz) these two Raman modes tend to become inactive. For the mode E(TO1) the change in the position is accompanied by a significant decrease of FWHM for the low concentration (x = 0.1) until complete for sample dope 30 mol% of Y( Fig. 5 ). By opposition, amortization (FWHM) of the mode A1(TO1) remains constant and decreases beyond 10% of Y. Following the experimental results and primarily that of the Raman spectroscopy, lead us to consider the load compensation phenomenon, and equations related to it, necessary to ensure the neutrality of the new structure during the introduction of the dopant. In the pure PT structure, The Pb 2+ ions are at the sites A while Ti4 + ions occupy the site B. When doping Y2+ ions for the low levels up to 10% Y2 + ions replace the Pb2 + ions in their sites (A) because they have the same valence. This affects the width at half height and hardens modes E(TO1) and A1(TO1) with increasing Y. More precisely, doping Y induces small displacements between ions site A and octahedra TiO6. The octahedra TiO6 restrict the displacement of Ti4+ ions inducing a hardening of soft modes. Substitution in PbTiO3 with a divalent ion, Y2+ sites in the occupied bivalent lead ion Pb2+ does not require load compensation until the concentration of Y is environ 10%, according to the following chemical formula:
Pb1-xYxTiO3
Although this process of substitution does not lead to the creation of the vacant site it induces lattice distortions due to the difference of the ion beam. So, this substitution process involves a change in the stiffness of the cells around the site A and then a change in the frequency of the mode with increasing Y2+ (figure 4 (a)). When the rate of Y is greater than 10%, a slight decrease in the frequency and decreased the FWHM mode A1(TO1) are observed. The Y ions thus reveal an order of the structure that can be attributed to a structural order is short. In this concentration range, we concluded that the Y2+ ions of low atomic radius compared to Pb2+, substitute has both Pb2+ and Ti4+ and therefore incorporate both the sites A and B sites of the PT structure. Consequently, beyond 10% of Y the substitution of Ti4+ by Y2+ requires cost compensation. After several models based on different loads compensation mechanisms, we propose a load compensation model based on the creation of oxygen deficiencies according to the following formula:
[Pb1 – x+ z Yx− z] [Ti 1− 3zY3z]O3(1− z)□3z
Or x corresponds to the limit concentration of Y 10% and □ is a vacancy on the oxygen site. This solution is the only valid among all the one we studied because it is the only one that corresponds to the evolution of Raman peaks associated sites occupancy various ions. Raman spectra of the powder Ba0.0975Sr0.025TiO3 calcined at various temperatures are shown in Figure 4. Between 200 and 300 cm-1, there are two modes A (LO1) and A (TO2) are respectively 218 and 247 cm-1, however the increase of the calcination temperature and causes a gradual decrease in the intensity thereof to the appearance of a single broadband 900 ° C. We observed there also a narrow band with 305 cm−1 associated with the modes B1 and E(TO3 + LO2), and a wide and asymmetrical strip with 520 cm−1 associated with the modes A1(TO3) and E(TO4) and another wide strip (not very intense) with 720 cm−1 associated with the modes A1(LO3) and E(LO4).
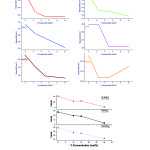 |
Figure 5: Positions and FWHM of the modes Raman for different concentration of Y in material PYT |
One notes also the increase in intensity of the mode E(LO4)/A1(LO3) by against that of E (TO3 + LO2) / B1 becomes very important. This is closely related to the significant increase in lattice parameter was that we showed earlier in Figure 2. This indicates a trend towards the tetragonal phase. Indeed, many researchers agree on the fact that the presence of E Fashion (TO3) to 305cm-1Who comes from idle F2U of the cubic phase, is a characteristic of the tetragonal phase of the mesh BT 10-11. And that the decrease of the number of Raman bands is a consequence of an increase in the lattice symmetry 9,12.
Those are the consequence of shift of frequencies of the Raman the modes. Also note the presence of new bands at 117 and 804 cm-1, which have never been mentioned in the literature, note that this band does not appear in the 900°C spectrum, may be it is closely related with the secondary phase BaCO3, This is in analogy with the observation by X-ray diffraction.
Conclusion
The sol-gel method permits the synthesis of (Pb1-xYx)TiO3 powders for concentrations up to 30 mol%. X-ray diffraction analysis showed that all has powders crystallized into the perovskite phase, it was verified that the increase in the yttrium concentration favors the PT phase transition from tetragonal to pseudo-cubic by a sharp decrease in the lattice parameter c. For 30 % the disappearance of the E(LO2), B1+E and E(TO1) modes clearly demonstrates this tendency. with the characterization by Raman spectroscopy we founded a hypothesis by considering the load compensation phenomenon. Result in the substitution of the divalent lead ion Pb2+ in PbTiO3 by a divalent ion Y2+ does not require load compensation until the concentration of Y is environ10%. By against above this threshold, the substituted yttrium has both the ions Pb2+ and Ti4+ PT structure which requires a load compensation according to the formula indicated above.
References
- Noheda, B.; Cox. D.E.; Shirane, G.; Guo, R.; Jones, B.; Cross, L.E. Physical Review. 2001, 63, . 014103, 1, 141031.
- Renault, A-E.; Dammak, H.; Calvarin, G.; Pham Thi M.; and Gaucher, P. Japanease Journal of Applied Physiscs, 2002, 41, 1.
CrossRef - Ye, Z. G.; Noheda, B.. Dong, M.; Cox, D.; and Shirane, G. Physical Review. 2001, B. 64, 18,184114.
- Paik, D.S.; Prasadarao, A.V.; Komarneni, S. Mater. Lett. 1997, 97 , 2-3,
- Calzada, M.L.; Sirera, R.; Ricote, J.; Pardo, L. J. Mater. Chem. 1998, 8, 111 Kellati, M.; Thése de la faculté des sciences Dhar Mehraz, Fes, 2002.
- Renault, A-E. ; Dammak, H. ; Gaucher, P. ; Pham Thi, M. and Calvarin, G. IEEE, ISAF Proceeding, (XIIIth International Symposium on the Applications of Ferroelectrics, 2002. 28 1(Nara, Japon))
- Castañeda-Guzmán, R. ; x Villagrán-Muniz, R. ; . Saniger-Blesa, J. M ; Pérez-Ruiz, S. J. ; and Pérez-Martı́nez, O. Appl. Phys. Lett. , 2000. 77, 3087
- Venkateswarlu, P. ; Bharadwaja, S.S.N. ; Krupanidhi, S.B. Thin Solid Films. 2001. 389,1-2, 84
CrossRef - Li, H. ; Tang, X. ; Li, Q. ; Liu, Y. ; Tang, Z. ; Zhang, Y. ; Mo, D. ; Solid State Commun.2000. 114, 6, 347.
- Shirane, G. ; Pepinsky, R. ; and Frazer, B. C. ; Acta Crystallogr. 1956. 9, 131
CrossRef - Kallati, M. ; El moudden, N. ; Kaal, A. ; Elghazouali A. and Sayouri, S. ; Annales de chimie des Sciences des Materiaux. 2002. 27, 1, 43
- Calzada, M. L. ; Bretos, I. ; Jiménez, R. ; Ricote, L. Mendiola, J. Thin Solid Films. 2004. 450, 211
CrossRef - Carmona, F. ; Calzada, M. L.; Roman, E.; Sirera, R.; Mendiola, J. 1996. Thin Solid Films, 279, 70
CrossRef - Mendiola, J. ; Ramos, P. ; Calzada, M. L. ; Phys. J. Chem. Solid. 1998. 59, 9, 1571
- Chopra, S.; Sharma, S.; Goel, T. C.; Mendiratta, R. G. Solid State communication. 2003. 127, 299
CrossRef - Tang, X.G.; Zhou, Q.F.;. Zhang, J.X. Thin Solid Films. 2000. 375, 1-2, 159
- Ganesh, R.; Goo, E.; Am. J. Ceram. Soc. 1997. (3), 653
- Elmsbahi, A.; Kherbeche, A.; Kadira, Lh.; Sayouri, S.; Lotfi, M.; Zenkouare, M.; Elaatmani, M.; Cata. J. Mat. Env.2003. 11, 51
- Freire, J.D.; Katiyar, R.S. Phys. 1988. Rev., B 37, 2074
- Dobal, P.S.; Majumder, S.B.; Bhaskar S.; and Katiyar, R.S. J. Raman Spectrosc. 1999. 30, 7, 567

This work is licensed under a Creative Commons Attribution 4.0 International License.
![]()
A New Edition of Web of Science
Journal Impact Factor
2022: 0.5
Five Year: 0.8
Journal is Indexed in

Cabells Whitelist
![]()


