Metal complexes of Proline-Azo Dyes, Synthesis, Characterization, Dying Performance and Antibacterial Activity Studies
Department of Chemistry, College of Science, University of Baghdad, Baghdad, Iraq.
Corresponding Author E-mail: rafalsalam257@yahoo.com
DOI : http://dx.doi.org/10.13005/ojc/330148
Download this article as:
![]()
The synthesis, structural spectroscopic properties of 4-(2-benzimidazolylazo)proline (BMP) and its complexes derived from [Cu(II), Ag(I) and Au(III)] salts were done. The mode of bonding for the complexes were accomplished based on elemental analysis, FTIR, UV-Vis and HNMR spectroscopy, magnetic measurement and molar conductivity. It has been found that the ligand (BMP) behaves as N,N-neutral bidentate which was forming chelates with molar ratio (1:2) (M:L) stoichiometry for [Cu(II) and Ag(I)] while Au(III) complex form molar ratio (1:1) at optimum concentration and pH as well as (λmax). The stability constant and Gibbs free energy for the prepared complexes are evaluated by spectroscopic methods. The prepared ligand (BMP) in comparison to its metal complexes, were screened for their antibacterial activity against two bacterial species, Escherichia Coli and Staphylococcus. Dying performance was also studied.
KEYWORDS:Azo dyes; azo complexes; synthesis.
Introduction
The expansions of new structure of azo compounds have been a subject of regard and much novel structure of these compounds1. Azo compounds with the hetrocyclic diazo component from colored complexes with universality metal ions2 and are an important for industry and biological system3. In addition metal chelates have been studies and attracted much attention due to their interesting electronic and geometrical features in connection with their application various fields4. This type of azo compounds which are characterized with (л-acidic) azo imine (-N=N-C-N) which giving results with good rates and great stability as well as characterized with ease of purification and deep colors which have displacements in the wavelength when they are consistent with transition metal ions5, 6. The chelate complexes that have five-membered or six-membered chelate rings are the most stable complexes7. In the fact that some drugs including discouraging the growth of germs8, 9. In addition, the important uses of these compounds are analytical reagents10-12for solvent extraction to determine some metal ions. The azo imidazole compounds have important role in spectral determination field to identify the amount of elements especially with transition metal ions because of its sensitivity and selectivity 13. In our research we were able to prepare new ligand (BMP) and its complexes with [Cu(II), Ag(I) and Au(III)] taking into account a spectral study in order to obtain optimum condition (concentration and pH) and metal to ligand ratio for preparation the complexes.
Experimental
Materials and Instruments
All elements and solvent are of best purity and used as found from the productions. Microelemental analysis (C.H.N) was gained on a (Eure EA 3000 Elemental analyzer). UV-Vis Spectra were performed in ethanol on a (Shimadz UV-160A) ultra violet-visible spectrophotometer. FTIR-spectra were recorded on a (Shimadz FTIR-8400s Fourier Transform Infrared) spectrophotometer (200-4000) cm-1 using CsI discs. The 1HNMR spectra were gained on a (1HNMR Spectrometer 4000 MHz, Avance III 400 Bruker, Germany”. The molar Conductivity for the complexes was determined in (10-3 M) DMSO at room temperature using (HANNA instruments / Conductivity Tester). pH measurement was performed using (HANNA instruments pH Tester / Pocket pH Tester). Melting points have been gained via using (Stuart Melting Point Apparatus). The percentage of metal in complexes was done by using a “GBC 933 Plus “Flam Atomic Absorption Spectrophotometer. Thermal Analysis measurements TG, DTG and DSC were performed by using (Mettler) Thermogravimetric Analyzer.
Synthesis of 4-[(2-Benzimidazolyl)azo] Proline (BMP)
This ligand was synthesized according to the method reported in the literature14 with some modifications as shown in scheme (1)
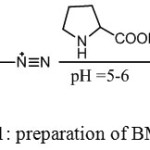 |
Scheme 1: preparation of BMP ligand |
Preparation of solutions
Ammonia acetate as a buffer solution was prepared with a range (5-9) by dissolving (0.01 M , 0.77 gm ) in one litter of deionized water. pH was detected by adding acetic acid or ammonia solution. As for standard solutions for selected metal salts and ligand were prepared by dissolving appropriate weight to the extent (1×10⁻⁵ M- 3×10⁻⁵M).
Synthesis of Complexes
Three complexes were prepared via adding regularly with stirring hot ethanolic solution of (2 mmole) ligand to stoichiometry mole ratio of (1:2) (M: L) for [(Cu(II) and (Ag(I)] and (1:1) for [Au(III)] which were dissolved in the prepared buffer solution at optimum pH. Then the mixture was heated to (60ᵒC) with stirring for (3hour), after that left to cool at room temperature. The colored precipitates were filtered, washed and desiccated in vacuum desiccator. The suggested stoichiometry structure of the prepared complexes is shown in scheme (2).
 |
Scheme 2: The suggested structure for the prepared complexes. |
Results and Discussions
The reaction of the prepared ligand (BMP) with selected transition metal ions [Cu(II), Ag(I) and Au(III)] at optimum pH and concentration, which mains to formation of the complexes with following formula [Cu(BMP)2Cl2], [Ag(BMP)2]NO3 and [Au(BMP)Cl2]Cl. The ligand (BMP) doings as N, N’-chelator, where N of (azo) and N’ of (benzimidazole). The structure of the complexes is supported via the analytical and spectral studies results. All complexes were stable in air and moisture as well as soluble in most organic solvents such as ethanol, DMSO, DMF, acetone …etc. By studying the molar conductivity of the prepared complexes which were measured at (10-3 M) in DMSO found that Cu(II) complex was non electrolyte while Ag(I) and Au(III) complexes are (1:1) electrolyte, supporting the ionic behavior for Ag(I) and Au(III) complexes, (Table (1)).
Table 1: physiochemical properties, elemental analysis, mole ratio, molar conductance for the ligand (BMP) and selected metal ions.
|
Complexes (M.wt) (gm/mol) |
pH (M:L) |
Color λ (nm) |
%Found %(Calculated) |
ᴧ (S.mol-1.cm2) |
||||
|
C |
H |
N |
M |
Cl |
||||
|
BMP (C12H13N5O2) (260.13) |
ـــــــ |
Yellow-green |
56.87 (56.907) |
5.38 (5.471) |
25.47 (25.535) |
ــــــ |
ــــــــ |
ـــــ |
|
[Cu(C24H26N10O4)Cl2] (654.8) |
7 (1:2) |
Blue-violet (610) |
44.79 (44.02) |
4.43 (3.97) |
20.77 (21.70) |
9.77 (9.70) |
10.91 (10.84) |
10 |
|
[Ag(C24H26N10O4)]NO3 (690.13) |
8.5 (1:2) |
Red (497) |
40.66 (41.73) |
4.19 (3.76) |
22.71 (22.31) |
15.60 (15.63) |
ـــــــ |
34 |
|
[Au(C12H13N5O2)Cl2]Cl (563.6) |
8 (1:1) |
Red (496) |
25.43 (25.55) |
2.19 (2.129) |
11.97 (12.42) |
34.90 (34.94) |
18.99 (18.89) |
35 |
The UV-Vis spectra of the prepared ligand (BMP) and its complexes under examination as was shown in Figures (1 and 2) were shown mainly two peaks observed in ethanol (10-4) within the range (250-1100) nm. The first peak at (339) nm for ligand (BMP) was owing to the π→π* transition of the aromatic rings. The second peak (λmax) at (449) nm ligand (BMP) was related to the π→π* this is assigned to the transition of (GT) intramolecular charge-transfer taken place through the azo moiety (-N=N-)15.
It has been saw red shift in the visible region when a competitive study between the spectra of mixing aqueous solutions for [Cu(II), Ag(I) and Au(III)] with ethanolic solutions of ligand (BMP) which ranged between (250-1100)nm. The change in the appearance color of free ligand (BMP) solution and high shift in the (λmax) gives a good sign for coordination and formation of complexes.
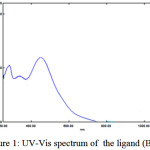 |
Figure 1: UV-Vis spectrum of the ligand (BMP). |
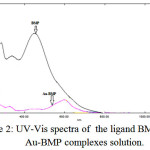 |
Figure 2: UV-Vis spectra of the ligand BMP and Au-BMP complexes solution. |
On the other hand the UV-Vis spectra were studied for mixed solutions of [Cu(II), Ag(I) and Au(III)] and ligand (BMP) within the range of concentration from (10-3M-10-6M), only 10-5 obey Lambert Beer low, while the pH sequence was from (5-9). Figure (3) was appeared best suitable straight lines, with correlation factor(r>0.989) when the absorbance plotted against molar concentration in the rang from (1×10⁻⁵M- 3×10⁻⁵M).
 |
Figure 3: Linear relationship between molar concentration and absorbance for metal ion-BMP complexes solution at optimum pH & λmax.
|
The pH effect was also examined at the range (5-9). Figure (4) was shown the absorbance-pH curves which are completed at (λmax) and various concentrations for each metal ion solution under study. A high band on the pH curves it is considered as a mark of the complex formation and acceptance as optimum pH for all preparation complexes. But the descent part of the curves may be referring to the dissociation of complex at this point. Therefore, we conclude that all prepared chelate complexes with selected metal ions are formed in neutral or basic medium16, 17:
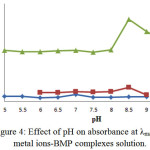 |
Figure 4: Effect of pH on absorbance at λmax for metal ions-BMP complexes solution. Click here to View Figure |
Spectrophotometry is one of the most useful tools for elucidation of the composition of complexes in solution. The power of the technique lies in the fact that quantitative absorption measurements can be performed without fear of disturbing the equilibria under consideration. Two of the most common techniques employed for identify the composition of the complexes in solution without isolation are the mole ratio procedure and continuous variations method or Job method18 (Figures (5 and 6)):
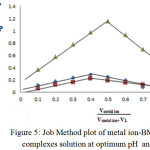 |
Figure 5: Job Method plot of metal ion-BMP ligand complexes solution at optimum pH and λmax.
|
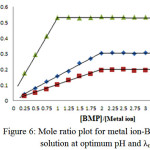 |
Figure 6: Mole ratio plot for metal ion-BMP complex solution at optimum pH and λmax. |
The two methods support same result about mole ratio of the complexes. It will be taking into account all the result we have obtained to install optimal condition to prepare the complexes of [Cu(II), Ag(I) and Au(III)] with the ligand (BMP).
Determination of Stability Constant and Gibbs free energy of Prepared Complexes
The stability constant (K) for Cu(II) and Ag(I) complexes in a mole ratio (M:L)(1:2) was computed based on the equation19:

As for the stability constant for Au(III) complex in a mole ratio (M:L) (1:1) was computed based on the equation19:
![]()
Where:
![]()
α= degree of dissociation.
Am= the absorption of solution containing the same volume of metal and excess of ligand.
As = the absorption of solution containing a stoichiometric volume of ligand and metal ion.
c = the concentration of the complex solution in mole/ L.
From Table (3) we calculated that Cu (II) and Ag (I) complexes more stable than Au (III) complex. The thermodynamic parameters of Gibbs free energy (DG) were also studied. The DG data have been calculated from the equation below20:
ΔG = -R T ln k
Where R = gas constant = 8.3 J.mol-1.K, T = absolute temperature (Kelvin).
Table (3) was shown that the formations of all prepared complexes are spontaneous.
Table 2: stability constant (K) and Gibbs free energy (∆G) for the prepared complexes
| Complexes | Am | As | α | K | Log K | ∆G |
| [Cu(BMP)2Cl2] | 0.304 | 0.155 | 0.4901 | 1.7325×10⁹ | 9.23869 | -52969.47322 |
| [Ag(BMP)2]NO3 | 0.194 | 0.100 | 0.4845 | 1.8130×10⁹ | 9.25842 | -53082.57391 |
| [Au(BMP)Cl2]Cl | 0.532 | 0.175 | 0.6710 | 2.9228×10⁴ | 4.4658 | -25604.44463 |
Electronic Spectra and Magnetic Measurement for Solid Complexes
The UV-Vis absorption spectra of the coordination compounds provide a convenient method for determining the magnitude of the effect of ligand filed on the d-orbitals of the metal ions. The UV-Vis spectrum of Cu-Complex with ligand (BMP) was shown in Figure (7) showed three absorption bands. The first band looked at (610) nm, (16393) cm-1. This is assigned to the transition (2B1g →2A1g). The second band was observed at (427) nm, (23419) cm-1 which is assigned to the transition (2B1g →2B2g). The third band at (291) nm (34362) cm-1 and was assigned to C.T transition. These three transitions characterized distorted octahedral (d9) geometry D4h21. With paramagnetic properties (Table (4)).
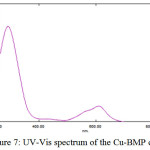 |
Figure 7: UV-Vis spectrum of the Cu-BMP complexClick here to View Figure |
As for the Ag-complexes (d10), one absorption band at (497)nm (20120)cm-1 which is related to (л→л*) (MLCT) transition (Figure(8)). These complexes are to be tetrahedral22. The magnetic properties are diamagnetic for Ag-complexes (Table (4)).
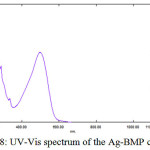 |
Figure 8: UV-Vis spectrum of the Ag-BMP complex
|
Table 3: The UV-Vis spectra for the prepared complexes at (10-4M)
|
Compounds |
λ nm |
Wave Number cm-1 |
ϵo× 104 L.mol-1.cm-1 |
Assignment |
Magnetic properties |
|
[Cu(BMP)2Cl2] |
610 427 291 |
16393 23419 34362 |
0.124 0.028 0.731 |
2B1g→2A1g 2B1g→2B2g MLCT |
Paramagnetic |
|
[Ag(BMP)2]NO3
|
497 |
20120 |
0.414 |
л→л* (MLCT) |
Diamagnetic |
|
[Au(BMP)Cl2]Cl |
980 861 653 496 |
10204 11614 15313 20161 |
0.096 0.018 0.040 1.305 |
1A1g→2A2g 1A1g→1Eg 1A1g→1A2u 1A1g→1B1g |
Diamagnetic |
Recently the UV-Vis spectrum for Au-complexes d8 low spin square planer structure, was appeared (d-d) transition. The [Au(BMP)Cl2]Cl have four absorption bands at (980, 861, 653 and 496)nm (10204, 11614, 15313 and 20161)cm-1 which are due to transition of 1A1g→2A2g, 1A1g→1Eg, 1A1g→1A2u and 1A1g→1B1g respectively as was shown in (Figure(9))23. With diamagnetic properties (Table (4)).
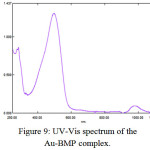 |
Figure 9: UV-Vis spectrum of the Au-BMP complex.
|
IR Spectra of Prepared Ligands and Complexes
For identification and detect the coordination site that may be involved in complexation. The FTIR spectra of all prepared complexes using CsI were compared with the prepared ligand (BMP) (Figures (10-13)). The spectra of the prepared complexes presented the bands specific to the ligand with some differences in the shape and positions of the bands mention to the formation and coordination of complex, Table ( 5) induced the main infrared spectral bands of the free ligand and its complexes. The FTIR spectrum of the ligand (BMP) has been appeared a band at (3440 cm-1 that refer to ν(O-H) of carboxylic group in proline moiety24. Another band was appeared at (3328 cm-1) refer to ʋ(N-H) group of proline moiety, these two bands stay unchanged in position in the spectra of prepared complexes mention that there were no coordination through N-H and COOH group for proline. A doublet bands was prepared at (1620 and 1591) cm-1, these bands have been refer to ʋ(C=N) in imidazole moiety which were showed changes in shape and shifted to low wave number in the spectra of all complexes due to coordination through N3 for imidazole moiety. The ligand (BMP) also showed triplet bands at (1450, 1448 and 1429) cm-1 which refer to (N=N) azo moiety25. These bands were a specific feature of azo composites. The strength of these band reduced in the complexes spectra, in spite of were shifted to lower frequency by (43) cm-1 for ligand (BMP) which is due to coordination through azo moiety. The band of (-C-N=N-C-) was appeared in the spectrum of the ligand and on complexation was showed a negative shift of order (74-23)cm-1 for ligand (BMP) with changing in intensity and shape, this another indicating the engagement of azo moiety in the coordination with the metal ion. In addition there are new set of bands do not exist in the spectrum of free prepared ligand but display in the spectra of the complexes such as ʋ(M-N)azo, ʋ(M-N)im, ʋ(M-Cl) in Cu and Au complexes and (M-NO3)26. These mention to the coordination places of the prepared ligand (BMP) with metals ion.
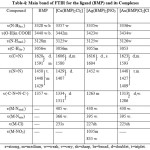 |
Table 4: Main band of FTIR for the ligand (BMP) and its Complexes Click here to View Table |
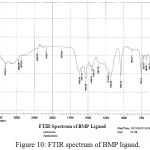 |
Figure 10: FTIR spectrum of BMP ligand. Click here to View Figure |
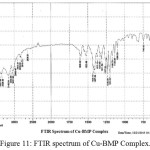 |
Figure 11: FTIR spectrum of Cu-BMP Complex. Click here to View Figure |
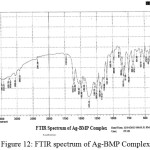 |
Figure 12: FTIR spectrum of Ag-BMP Complex. Click here to View Figure |
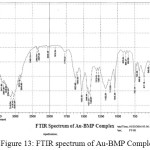 |
Figure 13: FTIR spectrum of Au-BMP Complex. Click here to View Figure |
1H NMR Spectra of Prepared Ligands and Complexes
1H NMR spectra for the prepared ligand (BMP) and its complexes with )Cu(II), Ag(I) and Au(III)( in DMSO are shown in (Figures(14-17)) and the peak assignments are explained in Table (6). A singlet peak was appeared at δ(15.3) ppm in the spectrum for ligand (BMP) which was due to one proton of free carboxyl moiety in proline27. Another singlet signal peak noted at δ(5.5) ppm in these spectrum for the ligand (BMP) owing to a proton for (NH) imidazole. These signal peaks don’t affect in coordination but stay almost without any chemical shift. The multiple signals noted in the region δ (8.4-7.2) ppm for ligand (BMP), these were denoted to aromatic proton (4H) for benzene ring in benzimidazole moiety. So little shift happen when complex formation. Furthermore a singlet signal detected in the region δ (2.6) ppm for ligand (BMP) which were attributed to (-NH) proton of proline ring27, there are no shift were looked in the position in the spectra of the complexes. Also another signal peaks were looked in the spectra of the prepared ligand (BMP) and its complexes which were described in Table (6):
Table 5 : 1HNMR spectra of BMP and its Complexes
|
Compound |
-COOH |
Ar-H |
-NH(imd.) |
-NH(Pro.) |
Aliph-H(Pro.) |
|
BMP |
15.3 |
(8.4-7.2) |
5.5 |
2.5 |
(1.1-1.0) |
|
[Cu(BMP)2Cl2]
|
15.4 |
(7.5-6.8) |
5.5 |
2.6 |
(1.2-1.0) |
|
[Ag(BMP)2]NO3
|
15.4 |
(8.1-7.0) |
5.5 |
2.6 |
(1.2-1.0) |
|
[Au(BMP)Cl2]Cl
|
15.4 |
(7.7-7.0) |
5.5 |
2.6 |
(1.15-1.0) |
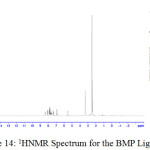 |
Figure 14: 1HNMR Spectrum for the BMP Ligand |
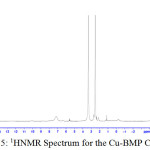 |
Figure 15: 1HNMR Spectrum for the Cu-BMP Complex. |
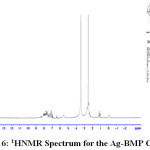 |
Figure 16: 1HNMR Spectrum for the Ag-BMP Complex. |
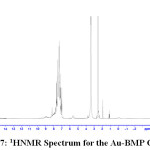 |
Figure 17: 1HNMR Spectrum for the Au-BMP Complex. |
Thermal Analysis of the Ligand (BMP)
Figure (18) have been appeared the thermo gravimetric analysis (TG and DTG) curves for the prepared ligand (BMP) at room temperature up to 900C0 under helium as inert gas and differential scanning calorimetric (DSC) curve (Figure (19)). The ligand (BMP) with the formula (C12H13N5O2), it showed three decomposition steps at the temperature range (60-800) C0. The first step of (50-310) C0 with mass loss of benzimidazole and azo moiety (60.14%) (Calculated 60.76%) indicated by the DTG peak at (273) C0 with an endothermic peak in DSC curve at (131.4) Co.The second temperature of range (310-450) C0 the decomposition step assigned to mass loss (COOH) group (18.82%) (Calculated 17.30%) and the DTG peak at temperature (370) Co and an endothermic peak at (271.73) C0 in DSC curve. And finally the third step was represented by mass loss for (C2H3•) (11.00%) (Calculated 11.15%) fragment at temperature range (450- 700) C0. The DTG peak was appeared at (555) C0 while the DSC curve was shaw exothermic peak at (527.22 Co). The residue represented the fragment (CH3N•) (10.04 %) (Calculated 10.36%).
C12H13N5O2 →C8H6N4•+COOH•+CH3N•+C2H3•.
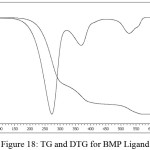 |
Figure 18: TG and DTG for BMP Ligand |
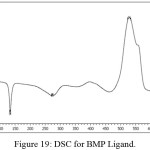 |
Figure 19: DSC for BMP Ligand. |
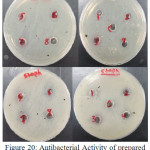 |
Figure 20: Antibacterial Activity of prepared Ligand (BMP) and its Complexes. |
Table 6: The Diameters (mm) of deactivation of two bacteria of the prepared ligand (BMP) and its complexes
|
No. |
Compound |
G+( Staph) |
G-( E-Coli) |
|
2 |
BMP |
9 |
ــــ |
|
4 |
[Cu(BMP)2Cl2]
|
10 |
ــــ |
|
6 |
[Ag(BMP)2]NO3
|
15 |
10 |
|
8 |
[Au(BMP)Cl2]Cl |
11 |
15 |
|
9 |
Ciprofloxacin |
18.15 |
18.5 |
|
10 |
Control (C) (DMSO) |
0 |
0 |
Antibacterial Activity of Prepared Ligands and its Complexes
Two types of bacteria were used in this experiment, Gram Negative Bacteria, Escherichia Coli (E-Coli) and Gram Positive Bacteria, Staphylococcus aureus (Staph) and Ciprofloxacin used as reference. The ligand (BMP) and its complexes have been appeared low antibacterial activity against Staphylococcus and no antibacterial activity against E-coli exception of Ag-complex had low activity while Au-complex had high activity when comparable with the activity for Ciprofloxacin. Generally the (ZI) mm compounds were in the following order;
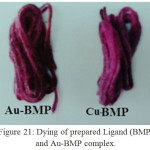 |
Figure 21: Dying of prepared Ligand (BMP) and Au-BMP complex. Click here to View Figure |
Ciprofloxacin > [Au(BMP)Cl2]Cl > [Ag(BMP)2]NO3 >>[Cu(BMP)2Cl2] > BMP>(DMSO)
The increased inhibition activity of the metal complexes can be explained on the basis of Tweedy’s chelation theory 28, Further; it increases the delocalization of π- electrons over the whole chelate ring 29, 30.
Dying performance
The dying method of the Cu-BMP and Au-BMP complex were studies and applied on acrylic fabric. These set dyes were given colors purple and brown. Figure (21) show a clear color.
Reference
- Uhood, J.; Tarik, E.; Howraa, H.; molecules, 2010, 15, 5620-5628.
- Bulent, K.; Ramazan, A.; Turk J Chem., 2008, 32: 9 – 17.
- Phatok, p.; Jolly, v.s; Sharma, k. p.; Orient. J. Chem., 2009, 16, 493 – 494.
- Kupradinun, P.; Rienkijakaru, M.; Tanyakaset, M.; Tepsuwan, A.; Kusamran, W. R.; Asian Pacific J. Cancer Prevention,2008, 3, , 55-60.
- Mehdi, R.T.; Ali, A. M.; National Journal of Chemistry, 2006, 20, 504-546.
- Al-adely, K. J.; Ali, A. M.; Mehdi, R. T.; National Journal of Chemistry, 2010, 38, 311-324.
- Weaver, M. A.; Shuttleworth, L.; Dyes and Pigments, 2007, 3, 81–121.
CrossRef - Sharma, K. P.; Jolly, V.S.; Phatak, P.; Journal ofUltra Scient. Phys. Sci.,2008, 10, 263 – 266.
- Majed, H.; Muzad, Ta.; AL-Zamili, F.; Hyder, K.S.; J.Thi.Qar. Sci., 2008, 2, 122-128.
- Dmitrienko, S. G.; Khatuntseva, L.N.; Apyari, V. V.; Zolotov, Yu.A.; Journal ofChem. Anal., 2005, 50, 327-335.
- Mirkhani, V.; Tangestaninejad, S.; Moghadam, M.; Habibi M. H.; Vartooni, A.; J. Iran. Chem. Soc., 2009, 6, 578-586.
CrossRef - Bakhsh, A.D; Rufchahi, Y.D.; Orient. J. Chem., 2009, 25, 41 – 45.
- Gavali, L. V.; Hankarep, P. P.; Journal of Physical Sciences, 2007, 11, 147-155.
- Sarkar, D.; Kumar, A.; Mandal, T.; Elsevier, 2013, 115, 421-425.
- Mohamed, G.G.; Omar, M.M.; Handy, A.N.; Turk. Journa.Chem.2006, 30, ,61-382.
- Masoud, S.; Amine, A.; Alaa, E.; Osama, K.; Journal Coord. Chem., 2006, 56,725.
- Masoud, M. S.; Mohamed, G. B.; Abdul-Razak, Y. H.; Ali, A. E.; Journal Korean. Chem. Soc., 2007, 46, 99-110.
- Mohanad, H. N.; Journal of Kerbala University, 2011, 9, 189-198.
- Jarad, A.J.; Zainab, S. K.; International Journal of Humanities, Arts, Medicine and Sciences.2015, 3, 197-210.
- Cao,H.W; Zhao,J.F.; Elsevier,2006, 76,1-6.
- Lever ABP “ Inorganic Spectroscopy“;, 2nd -Elsevier Science Publisher, Amsterdam.1984,198- 215.
- Yohannes, E.; Chandravanshi, B.S.; Gridasova, R.K.; African Journals Onlin,2005, 9, 1–8.
- Byabartta, P.; African Journal of Pure and Applied Chemistry, 2009, 3, 177-182.
- Lobana, T.S.; Sharma, R.; Bawa, G.; Khanna, G. G.; European Journal of Inorganic Chemistry,2009,253, 977-1055.
- Mahalingam, V.; Karvembu, R.; Chinnusamy, V.; Natavajar, K.; Malaysian Journal of Fundamental & Applied Sciences,2006, 64, 886-890.
- Gupta, Y.K.; Agarwal; S.C.; Madnawat, S.P.; Narain, R.; Research Journal of Chemical Sciences,2012, 2, 68 – 71.
- Silverstein, R.M.; Webster, F.X.;1996, Spectrometric identification of organic compounds 6th Ed. Wiley and Sons. New York. Tweedy , BG. J. Phytopathology. 1964 ; 55, 910–914.
- Taghreed, H. Al-Noor, Lekaa, K. Abdul Karim,”Synthetic, Spectroscopic And Antibacterial Studies Of Co(Ii),Ni(Ii),Cu(Ii),Zn(Ii),Cd(Ii)And Hg (Ii),Mixed Ligand Complexes Of Trimethoprime Antibiotic And Anthranilic Acid”,TOFIQ Journal of Medical Sciences;2016, 3,: 64-75.
- Taghreed . H. Al-Noor , Khalid F Ali , Amer J. Jarad and aliea. S .kindeel, “Synthesis, spectral and antimicrobial activity of mixed ligand complexes of Co(II), Ni(II), Cu(II) and Zn(II) with Anthranillic Acid and Tributylphosphine” , Journal of hemistry and Materials ; 2013, 3:126-139.


ISSN Online: 2231-5039

![]()


