Stability indicating RP-HPLC Method for Simultaneous Determination of L- Methyl folate and Escitalopram in Bulk and Pharmaceutical Formulation
Bhairam Bhoomaiah*1, Anireddy Jayasree2 and Danavena Rambabu3
1Centre for Chemical Sciences and Technology, Institute of Science and Technology ,Jawaharlal Nehru Technological University Hyderabad, India.
2Centre for Chemical Sciences and Technology, Institute of Science and Technology ,Jawaharlal Nehru Technological University Hyderabad, India.
3Hetero drugs Limited, Hyderabad, Telangana., India.
Corresponding Author E-mail: bhoomesh.analyst@gmail.com
DOI : http://dx.doi.org/10.13005/ojc/320643
Stabiliy indicating Reverse phase -HPLC Methodbeen described for the simultaneous estimation of L-Methyl folate and Escitalopram in combined tablet formulation form. Chromatographic separation was carried out by using reversed phase HPLC and the method was achieved on a ODS column with UV detection. The mobile phase was optimized with Acetonitrile : 0.01% H3PO4in water 35:65 (%V/V) Flow rate of 1.0ml/min and The wavelength was selected at 212nm. The drug was stressed by acidic, alkaline, oxidative, thermal and photolytic conditions and the degradation samples were analyzed by the proposed method. Degradation studies showed that all the two drugs were degraded under oxidative, acidic, alkaline and thermal conditions, Minor degradation observed under photolytic and hydrolysis condition. Analytical Method validation parameters such as specificity, linearity, accuracy, precision, Ruggedness and Robustness were determined and System suitability of all the parameters was passed. Hence this method was stability indicating method, It can be used for the routine and Stability analysis of L-Methyl folate and Escitalopram in pharmaceutical dosage forms.
KEYWORDS:RP-HPLC; L-Methyl folate; Escitalopram
Download this article as:| Copy the following to cite this article: Bhoomaiah B, Jayasree A, Rambabu D. Stability indicating RP-HPLC Method for Simultaneous Determination of L- Methyl folate and Escitalopram in Bulk and Pharmaceutical Formulation. Orient J Chem 2016;32(6). |
| Copy the following to cite this URL: Bhoomaiah B, Jayasree A, Rambabu D. Stability indicating RP-HPLC Method for Simultaneous Determination of L- Methyl folate and Escitalopram in Bulk and Pharmaceutical Formulation. Orient J Chem 2016;32(6). Available from: http://www.orientjchem.org/?p=25839 |
Introduction
Levomefolicacid(L-Methyl folate)
Levomefolic acid (fig- 1) was primary biologically active form of folic acid used at the cellular level for DNA reproduction. A-vitamin (B9) essential to human health and function. One of its most notable functions is its role in creating key neurotransmitters or brain chemicals that regulate human mood, cognitive ability and arousal. The three primary brain chemicals are dopamine, norepinephrine and serotonin. Chemically, these brain chemicals are referred to as monoamines. Abnormal amounts (either too much or too little) of these chemicals can cause various forms of mental illness and disease including depression, schizophrenia and attention deficit disorder.
Our body does not create its own supply of folic acid (also known as folate), it must be acquired from the diet by eating foods or taking supplements containing this b-vitamin. Your body then takes the dietary folic acid and uses the enzyme MTHFR (methylenetetrahydrofolatereductase) to transform it into levomefolic acid [1]. Your body can then use it to carry out a specific range of reactions and function. Levomefolic acid is used to produce the neurotransmitter nor epinephrineLevomefolic acid (and folic acid in turn) has been proposed for treatment of cardiovascular disease[2][3] and advanced cancers such as breast and colorectal cancers[citation needed] A lack (deficiency) of folate in the human body can be caused by certain diseases, by taking certain medications, or by not getting enough folate in your diet. Folate deficiency can lead to decreased red blood cells, or anemia. Folate deficiency can also cause high levels of a certain amino acid in the blood, a condition called hyperhomocysteinemia (HYE-per-HOE-moe-sis-tin-EE-mee-a).L-methylfolate is not an antidepressant or anti-psychotic medication. However, l-methylfolate may enhance the effects of antidepressant medications. Literature survey reveals that there were less number of analytical methods for L-methylfolate or in combination with other drugs including spectroscopic and chromatographic methods are reported.
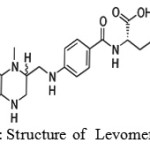 |
Figure 1: Structure of Levomefolic acid |
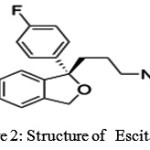 |
Figure 2: Structure of Escitalopram |
Escitalopram
Escitalopram (trade names Lexapro, Cipralex) (Fig 2) is an antidepressant of the selective serotonin reuptake inhibitor (SSRI) class. It is approved by the U.S. Food and Drug Administration (FDA) for the treatment of major depressive disorder and generalized anxiety disorder in adults; other indications include social anxiety disorder, panic disorder and obsessive-compulsive disorder. Escitalopram is the S-stereoisomer (enantiomer) of the earlier Lundbeck drug citalopram (Celexa), hence the name escitalopram. Escitalopram is noted for its high selectivity of serotonin reuptake inhibition and, as a result has fewer side effects not related to its serotonergic activity. According to a meta-analysis of 12 new-generation antidepressants, escitalopram and sertraline (Zoloft) are the best in terms of efficacy and acceptability in the acute-phase treatment of adults with major depression; however, sertraline may be a better choice because of the lower cost.escitalopram exhibits superior therapeutic properties to citalopram or merely represents an example of “ever greening” is controversial
The utility of antidepressant drugs in the treatment of mild-to-moderate depression is itself controversial. In those with very severe depression there is a large benefit[4]. The most recent Reviews concluded (with caveats in some cases) that escitalopram is modestly superior to citalopram in efficacy and/or tolerability[5]. Literature survey reveals that there were many analytical methods for escitalopram or in combination with other drugs including spectroscopic and chromatographic methods are reported Simultaneous estimation [6] of escitalopram and single estimation[7] of escitalopram has been done previously in UV and also in Colourometry[8]
Simultaneous determination of escitalopram oxalate and clonazepam in combined tablets by HPTLC[9] and RP‐HPL has also been performed.but there is no method established for the stability indicating RP-HPLC under stress for this combination.The present work describes the development of stability indicating RP-HPLC method, which can quantify these components simultaneously from a combined dosage formThe present RP-HPLC method was validated [10][11] and applied under stressed conditions according to International conference on harmonization (ICH) guidelineThere stability indicating assay methods helps in establishing the inherent stability of the drug which provides assurance on detection changes in identity, purity and potency of the product on exposure to various conditions.In the present study, Levomefolic acid, Escitalopram is exposed to a variety of stress like acidic, basic, thermal, photolytic and oxidative stress conditions[12]. According to ICH guidelines the stress testing of the drug substances helps in identifying the likely degradation products.The aim of the present work was to develop stability indicating method for determination of all the two drugs in presence of its degradation products.
Materials and methods
Chemicals and reagents
L-Methyl folate andEscitalopram standard was obtained from reputed companies,. HPLC grade Methanol, Water, Ortho phosphoric acid and Acetonitrile were purchased from Merck Pvt limited, Mumbai. 0.45μm nylon membrane filter papers were purchased from Pall Life Sciences, Mumbai. A combined dosage tablet lefodap plus was purchased from Med plus Pharmacy.
Instrumentation
In the present study Performed with Waters 2998 PDA detector and Waters Empower2 software was used Shimadzu double beam UV-Visible spectrophotometer was used for spectral analysis and the data was generated and recorded by UV probe software. Sonicator (1.5L) Ultrasonicator was used to sonicating the mobile phase and samples. Standard and sample drugs were and weighed by using Denver electronic analytical balance andsartorious analytical balanace (SI-234).
Determination of maximum absorbance
L-Methyl folate and Escitalopram standard solution was scanned in the range of 200-400 nm against mobile phase as blank. L-Methyl folate and Escitalopram shows maximum absorbance at 212nm.The wave length selected for the determination of L-Methyl folat and Escitalopram is 212nm.
Diluent
Water: Methanol (50:50)
Preparation of standard stock solution
6mg of L- Methyl folate and 8mg Escitalopramweighed in to 10ml volumetric flasks separately. Add 3/4ml of diluents, sonicated to up to dissolve the drugs and make up to the mark with diluents, finally 600μg/ml of L- Methyl folate and 800μg/ml of Escitalopram Standard stock solutions of concentration were prepared using diluent. Fromtake 1ml of standard stock solution, in to a 10ml Volumetric flask and and added dilent mixed well dilueted to get 60μg/ml of L- Methyl folate and 80μg/ml of Escitalopram with diluent.
Preparation of Tablet formulation
Taken weight of 20 tablets of lefodapplus and calculate the average weight then crush the tablets and weighted the equivalent to 1 tablet taken into a 25ml volumetric flask, added the 10ml of diluents and sonicated for 30 min, further diluetedup volume with diluent and filtered through 0.45µ filter .Then taken 2ml of above filter solution into a 10 ml volumetric flask and made upto volume with diluent. The finally sample solution concentrations of 60μg /ml of L-Methyl folate and 80µg/ml of Escitalopram was obtained.
Chromatographic conditions
The present study explains the development and validation for the estimation of L-Methyl folate and Escitalopramin Bulk and tablet forms using the most commonly employed ODS 250mm x 4.6 mm, 5m.column with UV detection. The mobile phase was optimized with Acetonitrile : 0.01% H3PO4in water 35:65 (%V/V). The wavelength was detected and selected at 212nm, Iso-absorptive point for both the drugs. Good resolution was carried out at 212nm and both drugs showed good absorbance at this wavelength with minimum interference of the other drug. Analysis was carried out at column temperature 30°C temperature. Compounds were separated with a mobile phase consisting of Acetonitrile : 0.01% H3PO4in water 35:65 (%V/V). Flow rate of 1.0 ml/min and detection of wavelength at 212nm. The mobile phase was filtered by using 0.45µm membrane filter paper and solicited and Degassed in Ultrasonicator for 10min.Optimized chromatographic conditions were shown in table-1 Standard and blank and formulation chromatograms were shown in figure no.3, 4 and 5. All parameters of method was validated as per the USFD and ICH guidelines.
Table 1: Optimized chromatographic conditions for L-Methyl folate and Escitalopram
|
S.NO |
Parameter |
Results |
|
1 |
Mobile Phase |
Acetonitrile : 0.01% H3PO4in water 35:65 (%V/V |
|
2 |
Wavelength |
212nm |
|
3 |
column |
ODS 250mm x 4.6 mm, 5m. |
|
4 |
Injection volume |
10mL |
|
5 |
Flow Rate |
1.0ml/min |
|
6 |
Pump Mode |
Isocratic |
|
7 |
Run time |
10 min |
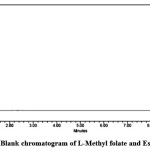 |
Figure 3: Blank chromatogram of L-Methyl folate and Escitalopram |
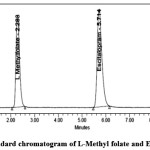 |
Figure 4: Standard chromatogram of L-Methyl folate and Escitalopram Click here to View figure |
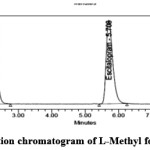 |
Figure 5: Formulation chromatogram of L-Methyl folate and Escitalopram |
Analytical Validation of the method
Assay Analytical method Validation of L-Methyl folate and Escitalopram by HPLC was carried out with respect to the following parameters.
System suitability
System suitability test was performed before each validation parameter.system suitability result shown in table-2. In the system suitability test L-Methyl folate and Escitalopram peaks were separated with good resolution, such as tailing factors, theoretical plates, and repeatability against the specifications set for the method. The tailing factor was within ≤ 2, theoretical plate number of ≥ 2000, which satisfied the acceptance criteria.
Table 2: System suitability Results forL-Methylfolate and Escitalopram
|
S.NO |
Parameter |
Results |
|
1 |
Api Concentration |
L- Methyl folate– 60 µg/ml Escitalopram – 80 µg/ml |
|
2 |
RT |
L- Methyl folate – 2.280min Escitalopram – 5.697 min |
|
3 |
Resolution |
L- Methyl folate – …….. Escitalopram -10.81 |
|
4 |
Area |
L- Methyl folate – 517514 Escitalopram – 730351 |
|
5 |
Theoretical Plates |
L- Methyl folate – 1161 Escitalopram – 4374 |
|
6 |
Tailing Factor |
L- Methyl folate – 1.32 Escitalopram -1.41 |
Linearity and range
Linearity of L-Methyl folate and Escitalopram detector response of assay method was found by injecting seven standard solutions with concentration ranging from 15µg/ml to 90µg/ml for L-Methyl folate and 20µg/ml to 120µg/ml for Escitalopram of the test concentration and a graph was plotted for concentration versus peak area. Good linear relation was observed within the concentrations and the study. Regression equation was found to be y= 8862.x + 204.1 (r2=1.000) for L-Methyl folate and y= 9273.x + 1391 (r2=0.999) for Escitalopram
Y=slope, m=intercept, c=correlation coefficient. The results were shown in Table-3,Table-4, fig-6 and fig -7
Table 3: Results for linearity of L-Methyl folate
|
No |
Concentration(µg/ml) |
Peak area |
|
1 |
0 |
0 |
|
2 |
15 |
132701 |
|
3 |
30 |
264945 |
|
4 |
45 |
400021 |
|
5 |
60 |
534130 |
|
6 |
75 |
665262 |
|
7 |
90 |
795920 |
Table 4: Results for linearity of Escitalopram
|
S.No |
Concentration (µg/ml) |
Peak area |
|
1 |
0 |
0 |
|
2 |
20 |
183208 |
|
3 |
40 |
372861 |
|
4 |
60 |
562544 |
|
5 |
80 |
745938 |
|
6 |
100 |
933617 |
|
7 |
120 |
1106405 |
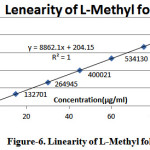 |
Figure 6: Linearity of L-Methyl folate |
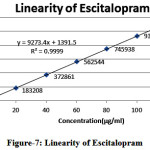 |
Figure 7: Linearity of Escitalopram |
Precision
Repeatability of results called as Precision. In this parameter injecting 6 eplicate injections of the solution 60μg/ml L-Methyl folate and 80μg/ml of Escitalopramrespectively.The%RSD was below 2.0% there found to be 0.87% and 0.79. Variability of the method was Checkedby analyzing the solution on the same day (intra-day precision) and on other different day (inter- day precision). The results were obtained for intra-day precision %RSDs were below 2.0% they were 0.87 % and 0.79 % respectively. The inter-day precisions %RSDs were 0.66% and 0.36 %, respectively it is also below 2.0%. The results were shown in table-5.
Table 5: Precision Results for of L-Methyl folate and Escitalopram
|
S.No |
L-Methyl folate |
Escitalopram |
L-Methyl folate |
Escitalopram |
|
|
|
Intraday precision |
Interday precision |
|||
|
1 |
519055 |
730022 |
510325 |
726226 |
|
|
2 |
513781 |
724488 |
509391 |
722452 |
|
|
3 |
513863 |
725274 |
506107 |
722991 |
|
|
4 |
516973 |
720769 |
502404 |
719327 |
|
|
5 |
506829 |
734154 |
511588 |
725318 |
|
|
6 |
518129 |
735207 |
509145 |
721058 |
|
|
RSD |
0.87 |
0.79 |
0.66 |
0.36 |
|
Accuracy
Accuracy of the method was Studiedby internal standard addition method. A known concentration amount of standard drug was added to the fixed amount of pre-analyzed tablet solution. Percent of recovery was calculated by comparing the area before and after the addition of the standard drug. As per ICH Guidelines Accuracy parameter performed at least 3 levels. The Recovery of method was performed at 50%, 100%and 150% levels of standard concentration for both L-Methyl folate and Escitalopram drugs. We were prepared above given 3 levels solutions in triplicate and injected as per the proposed method. % recovery was calculated for each levela found to be within the acceptance criteria of 98-102% for both drugs as per guidelines. This Resultsshowed that the recoveries of L-Methyl folate and Escitalopram by the proposed methods are satisfactory. %RSD accepted within the limit of 2.0%. The results are shown in table-6 and table-7
Table 6: Results for Accuracy ofL-Methyl folate
|
S.NO |
%Recovery |
Concentration in µg/ml |
Amount Found |
% recovery |
%RSD |
||
|
Target |
Spiked |
Total |
|||||
|
1 |
50% |
60 |
30 |
90 |
30.08 |
100.27 |
0.38 |
|
2 |
60 |
30 |
90 |
29.90 |
99.68 |
||
|
3 |
60 |
30 |
90 |
30.12 |
100.39 |
||
|
4 |
100% |
60 |
60 |
120 |
59.71 |
99.52 |
0.94 |
|
5 |
60 |
60 |
120 |
60.17 |
100.29 |
||
|
6 |
60 |
60 |
120 |
59.06 |
98.43 |
||
|
7 |
150% |
60 |
90 |
150 |
89.88 |
99.87 |
1.02 |
|
8 |
60 |
90 |
150 |
90.93 |
101.03 |
||
|
9 |
60 |
90 |
150 |
89.09 |
98.99 |
||
Table 7: Results for Accuracy of Escitalopram
|
S.NO |
%Recovery |
Concentration in µg/ml |
Amount Found |
% recovery |
%RSD |
||
|
Target |
Spiked |
Total |
|||||
|
1 |
50% |
80 |
40 |
120 |
39.40 |
98.50 |
1.49 |
|
2 |
80 |
40 |
120 |
40.55 |
101.38 |
||
|
3 |
80 |
40 |
120 |
39.71 |
99.28 |
||
|
4 |
100% |
80 |
80 |
160 |
79.70 |
99.63 |
1.14 |
|
5 |
80 |
80 |
160 |
79.16 |
98.96 |
||
|
6 |
80 |
80 |
160 |
80.94 |
101.18 |
||
|
7 |
150% |
80 |
120 |
200 |
119.22 |
99.35 |
0.90 |
|
8 |
80 |
120 |
200 |
120.17 |
100.14 |
||
|
9 |
80 |
120 |
200 |
118.03 |
98.36 |
||
Ruggedness
Ruggedness was performed by the analyst to analyst variability, % RSD) was calculated. The %RSD was below 2.0%, Cumulative %RSD both analysts also found below 2.0%. The results are shown in table-5and table-8.
Table 8: Result for Ruggedness of L-Methyl folate and Escitalopram
|
S.NO |
L-Methyl folate |
Escitalopram |
|
1 |
510325 |
726226 |
|
2 |
509391 |
722452 |
|
3 |
506107 |
722991 |
|
4 |
502404 |
719327 |
|
5 |
511588 |
725318 |
|
6 |
509145 |
721058 |
|
RSD |
0.66 |
0.36 |
Robustness
To perform the robustness of the method, Experimental Chromatographic conditions such as the Flow rate ,temperature and composition of the mobile phase.The small changes weretested The results are obtained small variations which do not effected on the results It indicates that the Analytical method was robust. The results were shown on the Table-9
Table 9: Results for robustness of the L-Methyl folate and Escitalopram
|
S.NO |
Condition |
Change |
L-Methyl folate |
Escitalopram |
||
|
Mean Area |
%RSD |
Mean Area |
%RSD |
|||
|
1 |
Standard |
…….. |
514471 |
0.9 |
730082 |
0.8 |
|
2 |
MP 1 |
40:60(%V/V) |
513547 |
1.1 |
734666 |
1.1 |
|
3 |
MP 2 |
30:70(%V/V) |
502632 |
0.9 |
725802 |
1.4 |
|
4 |
Flow-1 |
0.9 mL/min |
589325 |
1.1 |
834351 |
1.4 |
|
5 |
Flow-2 |
1.1 mL/min |
471802 |
0.9 |
675146 |
1.5 |
|
6 |
Oven Temp-1 |
25°C |
496975 |
1.2 |
709669 |
1.2 |
|
7 |
Oven Temp-2 |
35°C |
499556 |
0.7 |
713144 |
1.2 |
Limit of Detection and Quantification Limit
Determination of the Limit of Detection and Limit of Quantification was performed by standard deviation method.Standard with low concentrations of analyte with those of blank samples and establishing the minimum concentration at which the analyte can be reliably detected. Limit of Detection is generally considered acceptable 3.3*σ/slop for estimating the detection limit. The quantification limit 10.0*σ/slop is generally determined by the analysis of samples with known concentrations of analyte and by establishing the minimum level at which the analyte can be quantified with acceptable accuracy and precision. The results are shown on the table-10
Table 10: results for LOD and LOQ
|
Parameter |
L-Methyl folate (µg/ml) |
Escitalopram (µg/ml) |
|
LOD |
0.06 |
0.26 |
|
LOQ |
0.18 |
0.79 |
Formulation
We were prepared assay sample solution injected into the HPLC. The assay results were calculated against standard peak areas.the calculated % assay was found to be 99.41% for L-Methyl folate and 99.91 % for Escitalopram. Hence the method can use for the simultaneous estimation of L-Methyl folate and Escitalopram in pharmaceutical formulation and stability sample analysis. Results of the formulation analysis were shown in table -11.
Table 11: result for formulation of L-Methyl folate and Escitalopram
|
S.NO |
Drug |
Brand |
Dosage |
Amount Prepared |
Amount Found |
%Assay |
|
1 |
L-Methyl folate |
Lefodep Plus |
7.5mg |
60 |
59.65 |
99.41 |
|
2 |
Escitalopram |
10.0mg |
80 |
79.93 |
99.91 |
Solution stability
The standard and samplessolutions ofL-Methyl folate and Escitalopram does not change their concentration up to 24hrs. So standard and samples solution ofL-Methyl folate and Escitalopram Stable up to 24 hours. The results were shown in table-12.
Table 12: Results for stability
|
Time in hrs |
PeakArea |
|
|
L-Methyl folate |
Escitalopram |
|
|
0 |
502700 |
717606 |
|
24 |
508145 |
722895 |
Force Degradation Studies
Forced degradation study undertaken to demonstrate the specificity of method, when developing the stability- indicating methods, particularly when little information is available about potential degradationof products. These studies also provide information about the degradation pathways and degradation products that could form during storage period in different conditions . Forced degradation studies may help facilitate pharmaceutical development as well in areas such as formulation development manufacturing and packaging in which knowledge of chemical behavior can be used improve a drug product
Oxidative Stress
To 1 ml of sample stock solution of L-Methyl folate and Escitalopram and 1 ml of 20% hydrogen peroxide (H2O2) was added separately. The solutions were kept for 2hours at 60ºc. For HPLC Analysis , TheResultant solution was diluted to Required concentration 60µg/ml of L-Methyl folate& 80µg/ml of Escitalopram solution and injected into the HPLC system Recorded the chromatograms to assess the stability of sample
Acid Degradation Studies
To 1 ml of stock s solution L-Methyl folate and Escitalopram, 1ml of 2N Hydrochloric acid was added and refluxed for 30min at 60ºc. TheResultant solution was diluted to Required concentration 60µg/ml of L-Methyl folate& 80µg/ml of Escitalopram solution and injected into the HPLC system.Recorded the chromatograms to assess the stability of sample
Base Degradation Studies
To 1 ml of stock solution L-Methyl folate and Escitalopram, 1ml of 2N sodium hydroxide was added and refluxed for 30mins at 60ºc. TheResultant solution was diluted to Required concentration 60µg/ml of L-Methyl folate& 80µg/ml of Escitalopramsolution andinjected into the HPLC system.Recorded the chromatograms to assess the stability of sample
Thermal Degradation Studies
The thermal degradation carried out by sample solution was kept in oven at 105ºcfor 6 hours. For HPLC analysis, TheResultant solution was diluted to Required concentration 60µg/ml of L-Methyl folate& 80µg/ml of Escitalopram solution and injected into the HPLC system Recorded the chromatograms to assess the stability of sample.
Photolytic degradation studies
The photochemical degradation was also studied by exposing the tablet powder to UV Light by kept the beaker cointaining tablet powder in UV Chamber for 7days or 200 Watt hours/min in photo stability chamber. For HPLC Analysis, TheResultant solution was diluted to Required concentration 60µg/ml of L-Methyl folate& 80µg/ml of Escitalopram solution and injected into the HPLC system.Recorded the chromatograms to assess the stability of sample.
Hydrolysis Degradation Studies
Hydrolysis Degradation Study carried out by refluxing the drug in water for 6hrs at a temperature of 60ºC for HPLC analysis, TheResultant solution was diluted to Required concentration 60µg/ml of L-Methyl folate& 80µg/ml of Escitalopram solution and injected into the HPLC system recorded the chromatograms to assess the stability of sample. The Degradation results shown in table-13
Table 13: Result for Degrdation of L-Methyl folate and Escitalopram
|
Degradation |
Assay of L-Methyl folate |
Assay of Escitalopram |
|
water |
98.89 |
99.00 |
|
UV |
98.66 |
97.43 |
|
Thermal |
96.09 |
96.08 |
|
Acid |
94.08 |
94.09 |
|
Base |
93.14 |
93.35 |
|
Peroxide |
91.97 |
91.97 |
Results and Discussion
The present experiment was aimed to develop and validated stability indicating RP- HPLC method forsimultaneous estimation ofL-Methyl folate and Escitalopram.for selection of mobile phase ,After several Experiment trails with different mobile phase compositions, a Acetonitrile : 0.01% H3PO4in water 35:65 (%V/V) was found to be desired composition. This ratio was optimized for the simultaneous estimation of all the two drugs.
The analytical data obtained from the linearity parameter ,linear regression analysis showed a linear relationship in peak areas and concentration in the range of 15µg/ml to 90µg/ml for L-Methyl folate and 20µg/ml to 120µg/ml for Escitalopram of the test concentration. The method was precise, repeatable results were obtained.The %RSD values for intra-day and inter-day precision less than 2.0%. The developed method was accurate recovery obtained at each levelas per guide lines
The limit of detection ofL-Methyl folate and Escitalopram was found to be 0.06μg/mL and 0.26μg/mL ,limit of quantification was 0.18μg/mLand0.79μg/mL .While studying the robustness, the system suitability results of all the two drugs were within acceptance criteria,
The established method was robust system suitability parameter passed affected after varying the parameters like flow rate and Temparature. The assay of commercial tablets was established with present chromatographic condition developed and it was found to be more accurate and reliable. The percentage label claim present in tablet formulationwas found to be 99.41, 99.91 for L-Methyl folate and Escitalopramrespectively.
The drugs were exposed to acidic, base, oxidative, thermal and photolytic conditions and the stressed samples were analyzed by the proposed method. Degradation studies showed that all the two drugs were degraded under, thermal, Acid, Base and peroxide conditions. The drug peak areas decreased sufficiently with drastic change in the Rt values.
Thus the developed RP-HPLC Stability inicating method was found to be simple, rapid, sensitive, accurate, precise and specific for the simultaneous estimation of two drugs in bulk and pharmaceutical dosage forms and for routine analysis in stability studies of these drugs.
Conclusion
The Stability indicating RP-HPLC method was developed and validated simultaneousestmation and quantitative determination of L-Methyl folate and Escitalopramfrom in its formulation. All the validation parameters were found to be within the limits according to the ICH guidelines. The proposed method was found to be specific for the drugs of interest irrespective of the excipients present and the method was found to be suitable for the routine and stability analysis of the marketed formulation
Acknowledgements
The author, B. Bhoomaiah, expresses his sincere thanks toProf. A. Jayasree, Director of CCST, JNTU Hyderabad, for her excellence guidance and encouragement throughout the project. The author also expresses his deep sense of gratitude to AurobindoPharma Pvt Ltd, Bachually Hyderabad for giving an opportunity to work in that organization and providing facilities in the laboratory.
References
- Pietrzik, K; Bailey, L; Shane, B. Clinical Pharmacokinetics. 2010, 49(8), 535-548.
CrossRef - Fournier, J.C; DeRubeis, R.J; Hollon, S.D; Dimidjian, S; Amsterdam, J.D; Shelton, R.C; Fawcett, J.JAMA,2010, 303,47-53.
CrossRef - Sicras-Mainar,A; Navarro-Artieda, R; Blanca-Tamayo, M; Gimeno-de la Fuente, V; Salvatella-Pasant ,J. Curr Med Res Opin. 2010, 26 (12), 2757–64.
CrossRef - Willems ,Frank. F; Boers, G.H.J; Blom, H.J; Aengevaeren, W.R.M; Verheugt ,F.W.A. Br J Pharmacol .2004, 145, 825–830.
CrossRef - Fohr, I.P; Prinz-Langenoh,R.l; Brönstrup,A; Bohlmann,A.M; Nau,H; Berthold,H.K; Pietrzik,K. Am J ClinNutr. 2002,75, 275–282.
- Kakde,R.B; Satone,D. D. Indian Journal of pharmaceutical Sciences.2009. 71, 702–705.
CrossRef - Bharat, G; Chaudhari; Hetal R. Parmar. International Journal of Pharmaceutical Quality Assurance. 2010, 2, 9‐12.
- Vetrichelvan,T; Arul,K; Sumithra,K; Umadevi,K;IndianJournal of Pharmaceutical Sciences. 2010, 72, 269-271.
CrossRef - Nilesh .D; Santosh,G; Shweta, S: Kailash, B; Chromatographia .2008, 67(5), 487- 490
- Gandhi; Santosh,Vilashchand; Nilesh,Dnyandev;Jadhav; Vijay ,Yeshawantrao; , Sabnis; Shweta, Sadanand. Journal of AOAC International 2008. 91, 33-38
- ICH Q2A; Guidelines on validation of analytical procedure; Definitions and terminology, Federal Register, 60, 11260 (1995).
- ICH Q2B; Guidelines on validation of analytical procedure; Methodology, Federal Register, 60, 27464 (1996).
- ICH harmonized tripartite guideline, stability testing of new drug substances and products, Q1A (R2), 1 15 (2003).

This work is licensed under a Creative Commons Attribution 4.0 International License.


