Specific Surface Area and Porosity Measurements of Aluminosilicate Adsorbents
Department of Chemistry, University of Zambia, P.O. Box 32379, Lusaka, Zambia.
Corresponding Author E-mail: marinajowetsy@gmail.com
DOI : http://dx.doi.org/10.13005/ojc/320511
Download this article as:
![]()
Several natural low cost adsorbents such as activated carbon, flyash, clays etc have been tested for environmental applications. Adsorbent used here is the altered product of feldspar which has devitrified along with high quality silica, zeolitically transformed to tectosilicates of high surface area. Nitrogen sorption experiments are conducted before and after the loading of heavy metals. Nature of adsorption-desorption isotherms of the two samples proved the mesoporous nature of the sample. Surface area of the samples before and after the uptake of heavy metals was found out by fitting BET and Langmuir equations. Average pore diameters were calculated using the measured surface area and pore volume and is compared with that plotted using BJH cumulative pore volume.
KEYWORDS:Adsorption; isotherms; surface area; mesopores; t plot; pore size distribution
Introduction
Adsorption is the process in which matter is extracted from one phase and concentrated at the surface of a second phase. This is relatively weak, reversible, adsorption capable of multilayer adsorption. Physical gas adsorption is extensively used in the characterization of micro- and mesoporous materials and is often considered as a straightforward-to-interpret technique. One of the outstanding challenges in the field of naturally occurring porous materials is its specific surface area and pore volume. Adsorption-desorption of inert gas molecules on solid materials is the commonly used method for characterization of porous materials. Loading of heavy metals was performed on the aluminosilicate sample using an optimum adsorbent concentration of 0.12 mg/l of sewerage water to ensure maximum adsorption efficiency by providing adequate adsorption sites. Nitrogen physisorption is the method of choice to gain knowledge of mesoporous materials. The technique accurately determines the amount of gas adsorbed on a solid material, which is a direct measure for the porous properties and structure.
Experimental
The true surface area of the adsorbent includng the surface irregularties can be calculated by adsorption of an inert gas like nitrogen using a surface area analyser.The surface area analysis was conducted at 77 K using Micromeritics model Gemini 2375 porosity analyser. The samples were degassed at 150oC under vacuum condition for 24 hours. The pressure was increased until saturation was reached, at which all pores are filled with liquid so that the sample’s fine pore structure can be evaluated. The adsorptive gas pressure then was reduced incrementally, evaporating the condensed gas from the system. The data was used to construct a correlation namely adsorption and desorption isotherms. Adsorption isotherms are the representation of adsorbed amount as a function of pressure at constant tempereture.The specific surface area was determined using the Brunauer-Emmett-Teller (BET) method. Microporous volume and poresize distribution was calculated using Barnett-Joyner-Halenda (BJH) procedure.
Results and discussions
The nitrogen adsorption desorption isotherm plot for aluminosilicate before and after the uptake of heavy metals is illustrated in figure 1.
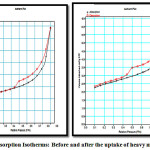 |
Figure 1: Adsorption Isotherms: Before and after the uptake of heavy metals Click here to View Figure |
It was evident from the above plots that there was a decrease in magnitudes/ or volume of nitrogen adsorbed after the loading of heavy metal. Though the isotherms are smooth they show hysteresis loop indicating first order capillary condensation transition(1). Monolayer adsorption was evident from the saturation after a limited period of contact time. The isotherm shows simultaneous presence of microspores and mesopores as indicated by the hysteresis loop at high p/po (2) (0.4 and 0.9). This is type IV isotherm as at high pressures there is increased uptake of nitrogen and inflection point occurs at the completion of monolayer. The high uptake of gas at high pressure indicates multilayer formation(3). The flat region at low pressure corresponds to monolayer formation and also the presence of micropores. Closure of the hysteris loop at 0.4 p/po indicates presence of small mesopores. The isotherm also shows hysteresis loop of type 3 assigned by the presence of interparticle mesopores created by agglomeration of small crystallites(4). The overall shapes of the adsorption desorption isotherms remained unchanged and the adsorbent was not affected on impregnation of heavy metals(5).
In order to optimize the adsorption system the most appropriate correlation for the equilibrium curves should be established. Here linearised model of Langmuir equation was used to describe the equilibrium nature of adsorption.
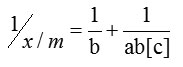
x = mass of adsorbate and m = mass of adsorbent.
[c] = concentration of adsorbate remaining in solution.Where ‘a’ is Langmuir constant related to binding energy and ‘b’ is the mass adsorption coefficient which is the adsorption affinity.
The specific surface area evaluation of materials by nitrogen multilayer adsorption measured as a function of relative pressure by Brunauer-Emmet-Teller, BET method is given in figure 2. The technique encompasses external area and pore area evaluations to determine the total specific surface area in m2/g yielding important information in studying the effects of surface porosity and particle size in many applications(6). The BET equation is commonly written as follows.
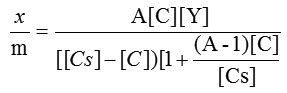
Rearranging and linearising followed by plotting of graph gives slope as
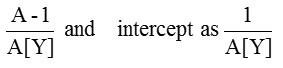
Where Y is the amount of adsorbate adsorbed in forming a complete monolayer,
and A is a constant to describe the energy of interaction
When we fit the adsorption data in the above equations we get straight lines. Large slopes indicate multilayer adsorption which is pertinent to BET.
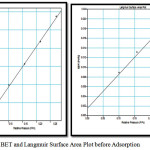 |
Figure 2: BET and Langmuir Surface Area Plot before Adsorption Click here to View Figure |
Single point surface area can be found out corresponding to a fixed relative pressure and multipoint by using a minimum of three points. The total pore volume, Vt is calculated from the amount of vapor adsorbed at a relative temperature close to unity.
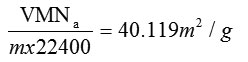
Monolayer volume, VM =

Where A= slope and I= intercept
Surface area, SBET =
Pore diameter, D =
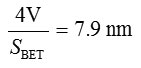
Where V= Micropore volume from t-plot.
BET do not consider micropore filling so the calculated BET surface area, SBET will be lower than Langmuir surface area. Fig 3 shows the BET and Langmuir surface area plots after adsorption of heavy metals. The corresponding surface areas calculated after the uptake of heavy is considerably lower. The results are summarised in table1.
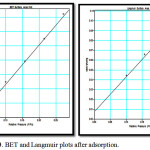 |
Figure 3: BET and Langmuir plots after adsorption. |
The experimental data was treated according to t-plot method to provide external surface area, micropore volume and total pore volume. The multi layer was modeled mathematically to calculate layer thickness, ‘t’ as a function of increaseing p/po. The thickness,’ t’ of the adsorbate layer increases as presurre increases.The experimental volume adsorbed is plotted against statistical thickness for each p/po in figure 4. The linear range lies between monolayer and capillary condensation. The initial slope of the plot gives small values of thickness, ‘t’ corresponding to small pores and slope at upper portion of plot gives the surface area of wider pores. The slope of the t plot, V/t gives the external area ie. the area of the pores which are not microporous. Micropores which have already been filled cannot contribute further to adsorption process. In the absence of micropores there is good agreement between t-area and surface area by BET.
Smicro = SBET-Sext
The t plot when extrapolated to adsorption axis will show a positive intercept which is equivalent to micropore volume
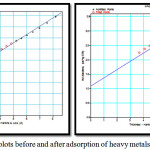 |
Figure 4: t-plots before and after adsorption of heavy metals. |
The classical pore size model developed by Barret, Joyner and Halenda (BJH), which is based on the Kelvin equation and corrected for multi-layer adsorption was used for calculations of the Pore Size Distributions, PSD over the mesopore and part of the micropore range.
BJH pore size, rp = rk + t
Where, rp is the actual radius of the pore
rk is the Kelvin radius of the pore
and t = thickness of the adsorbed film
BJH takes into account of the decrease in statistical thicknesss of the pores which was empied during desorption proces. The pore size distributions for the aluminosilicate, calculated from the desorption branches of isotherms using BJH method is shown in figure 5. It shows narrow pore size distribution centering at 37 Å although pores in micropore region are also present. This feature could be well exploited in occlusion of inorganic wastes(7). Average pore diameters calculated using the measured surface area and pore volume are 77. 9 Å and 65.5 Å respectively for samples before and after adsorption.
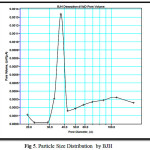 |
Figure 5: Particle Size Distribution by BJH |
Table 1: Summary of results
| Parameters | Before Adsorption | After adsorption |
| Single Point SA | 41.1407 m2/g | 8.1862 m2/g |
| BET SA | 40.1192 m2/g | 7.9672 m2/g |
| Langmuir SA | 62.0328 m2/g | 12.2948 m2/g |
| Micropore area | 17.1029 m2/g | 3.5321m2/g |
| External Surface area | 23.0163 m2/g | 4.4351 m2/g |
| Micropore volume | 0.009011 cm3/g | 0.001860 cm3/g |
| Pore diameter | 77.9151 Å | 65.5688 Å |
Conclusions
Nitrogen sorption experiments were conducted before and after the loading of heavy metals. It was evident from the above plots that there was a decrease in specific surface area of the sample after the heavy metal uptake. Nature of isotherms of the two samples proved the mesoporous nature of the sample. The hysterisis loop is of type 3 indicating aggregated crystallites with small % of micropores and slit like pores. Surface area of the samples before and after the uptake of heavy metals is found out by fitting BET and Langmuir equations. The t plots proved the presence of micropores as well. Average pore diameters are calculated using the measured surface area and pore volume and is compared with that plotted using BJH cumulative pore volume. Although pore size distribution shows hierarchical nature of adsorbent, it peaks at lower mesopore range.
Acknowledgements
National Institute of Interdisciplinary Sciences and Technology (NIIST), India.
School Of Mines, University Of Zambia.
References
- Bulgariu L; Cojocaru C; Robu B; Macavenu M; Equilibrium isotherm studies for the sorption of lead ions from the aqua solutions using Romanian peat samples, Environmental Engineering Management Journal, 2007, 6(5), 425-430.
- Peri J; Trgo M,; Medridovi NV; Removal of Zn, Cu and Pb by natural Zeolites-a comparison of adsorption isotherms, Water Research 2004, 38, 1893-1899.
- Khodakov A.Y; Zholobenko V. L; Bechara R. Durand; Microporous Mesoporous Materials. 2005, 79(1-3), 29-39.
- Chen. C; Li. T Cheng; S. Lin; Bhongale H. P; Mou C. Y; Microporous Mesoporous Materials. 2001, 39, 21-25
- Oren A. H; Kaya. A; Factors affecting adsorption characteristics of Zn2+ on natural zeolites, Journal of Hazardous Materials, 2006, 131, 59-65.
- Lowell S; Shields J.E; Thomas M.A; Thommes,M; “Characterization of Porous Solids and Powders: Surface Area, Pore Size and Density”, Kluwer Academic Publishers, Netherlands 2004.
- Sing K.; “The use of nitrogen adsorption for the characterization of porous materials”, Colloids and Surfaces : Physicochemical Engineering Aspects, 2001, 187-188, 3-9.


![]()


