Process Optimization Studies of Malachite Green dye Adsorption onto Eucalyptus (Eucalyptus globulus ) Wood Biochar using Response Surface Methodology
V. K. Singh1*, A. B. Soni1 and R. K. Singh2
1Department of Chemical Engineering, National Institute of Technology Raipur (Chhattisgarh), India.
2Department of Chemical Engineering, National Institute of Technology, Rourkela (Orissa), India.
Corresponding Author E-mail: vksingh.che@nitrr.ac.in
DOI : http://dx.doi.org/10.13005/ojc/320534
Biochar derived from Eucalyptus (Eucalyptus globulus) wood particles was utilized as an adsorbent to remove Malachite Green (MG) dye from an aqueous solution by varying the different physicochemical parameters. The adsorbent was characterized using FTIR analysis, SEM and XRD. The kinetics of the dye adsorption was analysed using pseudo-first-order and second-order model.The rate of sorption was described as a function of different experimental parameters and was modeled applying Box-Behnken Design (BBD). The results indicate that the response of MGadsorption was appreciably affected by the quadratic terms of contact time, dye concentration, temperature, pH, and adsorbent dose. The statistical analysis was carried out using ANOVA which shows a convincing relationship among the parameters under study.
KEYWORDS:Eucalyptus wood; Malachite Green; Adsorption; Isotherms; Kinetic models; BBD
Download this article as:| Copy the following to cite this article: Singh V. K, Soni A. B, Singh R. K. Process Optimization Studies of Malachite Green Dye Adsorption onto Eucalyptus (Eucalyptus globulus ) Wood Biochar using Response Surface Methodology. Orient J Chem 2016;32(5). |
| Copy the following to cite this URL: Singh V. K, Soni A. B, Singh R. K. Process Optimization Studies of Malachite Green Dye Adsorption onto Eucalyptus (Eucalyptus globulus ) Wood Biochar using Response Surface Methodology. Orient J Chem 2016;32(5). Available from: http://www.orientjchem.org/?p=21351 |
Introduction
Dyes are complex chemical compounds having stable aromatic rings combined to result in strong and persistent colour which does not degrade on exposure to light [1]. The use of natural dyes has been reduced to a large extent and almost the dyes being used presently in industries are synthetic. The annual production of these dyes is over 7*105 tonnes [2].
During the dyeing process, approximately 10 to 15% of used dyes are discharged through the effluents of the industries like cosmetics, textile, pharmaceutical, pulp and paper, paint, printing, food and carpet [3, 4].The re-establishment of biological population is prevented by the dyes, as they are toxic and non-biodegradable in nature. Also, these dyes deteriorate the quality of water permanently, resulting in allergy, skin irritation, dermatitis, cancer, dysfunction of liver, reproductive system and kidneys in humans [5, 6].
The dyes can contaminate both the surface and ground waters used for drinking and other purposes, strongly influence the photosynthetic activity of aquatic plants, and may result in oxygen deficiency in the aquatic flora and fauna due to anaerobic degradation into highly toxic substances [7, 8, 9].
The techniques employed for the treatment of dye containing effluent consist of physical, chemical and biological methods. Most of these methods are often expensive, ineffective, complicated, and time-consuming. Also, they require the services of highly-skilled workers, especially when the concentrations of dye in the effluent are up to 100 mg/L [10].
Similarly, the methods using adsorbents like activated carbons pose the problems of disposing sludge and reportedly have high costs of operation and maintenance, sludge regeneration and adsorbent [11, 12]. On the other hand, the adsorption techniques using non conventional adsorbents like biomass and biochar are comparatively cheaper, environment friendly and more efficient [13]. The utilization of biomass and biochar as adsorbent for the dye removal has advantages of effective treatment of wastewater and management of solid waste. They are characterised by high molecular weight due to the presence of components like lignin, cellulose and hemicelluloses [14]. In recent past, many agricultural wastes like rice husks, plum kernels, bagasse, nut shells, fruit peels and shells, corncob, leaf powders, spent tea leaves and sawdust were studied for their adsorption properties with regard to dye removal and found to be low cost and effective adsorbents [15].
Biochar, an effective adsorbent derived from biomass, has been frequently employed for the removal of different pollutants, including dyes, heavy metals and pesticides from effluents [16]. It is obtained through the pyrolysis of biomass at the temperatures in the range of 300 to 1000 °C in absence of oxygen. Thermal decomposition also results in biofuel (liquid products) and fuel gas (non-condensable vapours).The liquid fuel obtained can also be upgraded into quality fuels, added to petroleum refinery feedstock or various value added chemicals can be recovered economically.
Eucalyptus (Eucalyptus globulus) wood was used as biomass for producing biochar because it is abundantly available. The Eucalyptus plant grows quickly and wildly in many areas of India and even an infertile soil can be used for its plantation [17]. The present study aims (i) to produce the biochar from the eucalyptus wood and characterize it (ii) to examine the effect of relevant key parameters on the dye adsorption, kinetic constants, and equilibrium concentration of the biochar and (iii) to conduct process optimization using the Response Surface Methodology (RSM).
RSM is a compilation of mathematical and statistical methods and it is helpful in analyzing the effects of several parameters on response [18]. It consists of mainly three steps (i) to perform statistically designed experiments (ii) to estimate the coefficients in a mathematical model and (iii) to predict the response and to check the model adequacy [19]. It has the major advantage of reducing the number of experiments needed to evaluate interactions of multiple parameters [20].
The effects of key operating variables on Malachite Green (MG) dye adsorption were determined by employing Box- Behnken model. Also, the model was used to find the combination of variables ensuing maximum efficiency of dye adsorption. The variables were contact time (A), temperature (B), dye concentration (C), pH (D) and adsorbent dose (E). Design Expert Software 7.0 with five variables at three levels was used to apply this design.
Materials and Methods
Eucalyptus wood was obtained from the campus of National Institute of Technology Raipur Chhattisgarh (India). The dye, MG, was purchased from local market.
Preparation of adsorbent (Biochar)
The raw Eucalyptus wood was first cleaned with fresh water to remove the soil, sand and any other undesirable material and then, kept in sunlight for seven days. It was cut into small pieces, dried at 50°C in an air oven for 24 h. and further reduced to small size particles through grinding. These particles were pyrolysed in a pit type furnace with reactor. The temperature was raised upto 4500C at a rate of 10 0C per min. and it was maintained for 1 hour. The produced char was stored in an air tight container and labelled as EWBC.
Preparation of dye stock solution
MG (C23H25ClN2) is a dye used traditionally for dyeing silk, leather, cotton, bamboo, linen and paper. A dye stock solution of 1000 ppm was made and diluted to get the solutions of desired concentrations. A calibration curve was plotted by analysing the different concentrated MG dye solutions using UV-Visible spectrophotometer at 617nm.
Characterisation of biochar
Pellet of EWBC was prepared from its mixture with KBr for Fourier transform infrared spectrum (FTIR) analysis. The pellet, thus obtained, was analysed in the frequency range of 400 to 4000 cm-1 by averaging 16 scans for each spectrum. The X-ray diffraction (XRD) data were collected on a PANalytical 3 kW X’pert Powder diffractometer using Cu Kαl radiation.
Batch adsorption experiment
The experiments were conducted using 100 ml conical flasks wherein 50 ml of the dye solution having different initial concentrations ranging from 50 to 200 mg/l was taken for each experiment. Accurately weighed quantity of EWBC was added to the dye solutions and the flasks were kept in an orbital shaker at 30 ±1 ◦C for 3 hours to attain equilibrium of the solid-solution mixture. The solution pH was measured using pH meter of Eutech scientific instruments and it was adjusted with the solution of 0.1N HCL or 0.1 N NaOH. Similar procedure was followed with second set of flasks containing the same dye concentration but without biochar, to be utilised as a blank. The samples were filtered before the analysis to minimize the interference of the fine carbon particles with the solution and the filtrate was analyzed by UV/VIS spectrophotometer at 617nm. The experiments were repeated under the same conditions and the percentage removal of the dye and adsorption capacity of EWBC was calculated by the following formulas:
 where Ci and Cf are the initial and the final concentrations of dye (mg/ L). qe is the adsorption capacity (mg/ g), V is the volume of the solution(L) and m is the mass of adsorbent.
Design of experiments
RSM using BBD was used for the process parameters optimization. The five parameters considered for optimizations were dye concentration, contact time, temperature, adsorbent dose and pH while the response variable was percent removal of adsorbate. The BBD recommends 50 experiments for a five factor design. The upper, centre and lower limits of the factors respectively are contact time (min.) – (0,60,120), temperature (0C) – (30,40,50), initial dye concentration (mg/L) – (20,22.5,25), pH – (3,6,9), adsorbent dose (g/L) – (1,3,5) represented as “+1” , “0” and “-1” respectively. An empirical second degree polynomial equation which correlates the response to the process variables was used as mentioned below.

Where, Y = predicted response, β0 = constant, βi = linear coefficient, βij = interaction coefficient, βii = quadratic coefficient, and Xi, Xj = coded values of the process variables.
Results and Discussion
Characterisation of adsorbent
FTIR analysis and X-ray diffraction
Fig.1 (a) shows the FTIR spectrum for the prepared biochar. Each peak in the spectrum corresponds to different bond of different functional groups. Peaks at 3446.04 cm-1 indicates the presence of O-H stretch bonds of alcohols and phenols. Presence of H-C stretch bond of alkenes is represented by peaks at 2923.35 cm-1. Peaks at 1748.85 indicate the C=O stretch bond of esters. Peak at 1698.47 indicates the presence of C=O stretch bonds of α, β–unsaturated aldehydes and ketones. Small peaks at 1019.65, 1117.66 and 1163.06 cm-1 represent C-O stretch bonds of alcohols and carboxylic acids whereas peaks at, 874.60, 751.90 and 669.72 indicate the presence of =C-H bend bond of alkenes. XRD pattern of EWBC is given in Fig. 1(b). There is no sharp peak in the graph which shows the absence of inorganic material in the sample. The prepared biochar has amorphous structure represented by the broad nature of peaks.
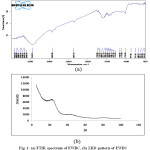 |
Figure 1: (a) FTIR spectrum of EWBC, (b) XRD pattern of EWBC |
Scanning electron microscopy
SEM is extensively used to know the structural features and to study the surface characteristics of the adsorbent. Fig. 2(a) and 2(b) show the SEM micrographs of EWBC before adsorption at 1.0 and 1.5 K magnification. The number of macropores is seen on the surface of EWBC which infer that the biochar will facilitate adsorption.
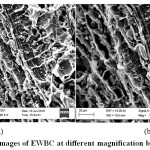 |
Figure 2: (a) SEM images of EWBC at different magnification before adsorption
|
Batch adsorption studies
Effect of adsorbent dose
The quantity of adsorbent dose was varied from 1g to 5g per litre of the dye solution. Adsorption was found to increase upto an optimum adsorbent dose of 3 g/L there after it became constant. The variation is given in Fig. 3 (a). The dye removal percentage increased with incremental dose because of increase in available active sites due to enhanced surface area. After the optimum dose, the adsorption remains constant. This is because the initial dye concentration is kept constant while increasing the adsorbent dose i.e. the amount of dye to be removed remains the same.
Effect of pH
pH of the solution has a vital role in the dye adsorption process. The change in percentage removal with pH is shown in Fig. 3 (b). It is clear that at acidic pH, percentage removal is low and found to increase when the pH was basic. The percentage removal increased from 24% to 85 % as the pH increases from 3 to 9. A similar trend was seen in MG dye removal by treated ginger waste 21. At low pH, high concentration of H+ ions competes with the cations of MG dye 22. Also, the surface of adsorbent gets protonated at low pH which develops an electrostatic repulsive force between positively charged adsorbent surface and MG dye cations. At basic pH, more OH– ions on the surface of the biochar increase the attractive force between cationic dye molecule and the surface which tends to increase the amount of the adsorption23.
Effect of initial dye concentration
Effect of dye concentration was studied by varying the dye concentration as 25, 50, 75 and 100 mg/L at different temperatures. Percentage removal and hence the amount of dye adsorbed was observed to increase with increasing initial dye concentration [Fig.3 (c)]. At the temperature 303K, the amount of the dye adsorbed was found 20.94 mg/g of the adsorbent for 25 mg/L of dye concentration, whereas for 100 mg/L of dye concentration it was increased to 75.48 mg/g of adsorbent. The same trend was observed at other temperatures also. The reason behind this increased amount of the dye adsorption is that, as initial concentration increases, driving force for adsorption increases and also, the more amounts of dye remains available.
Effect of contact time and kinetic studies
Variation in dye percentage removal with contact time is shown in Fig.3 (d). The dye removal percentage was found to augment with increasing contact time. At earlier stages, percentage removal and hence, the amount of dye adsorbed is high compared to the end of the process. This is due to the reason that initially the concentration difference (driving force) is maximum but it decreases with time. After 60 min, the percentage removal reaches a constant value of 76%, 84% and 91% corresponding to temperatures 303.15K, 313.15K and 323.15K respectively. So, the optimum time needed for 50mg/L of the dye solution was 60 min and this time was considered for further experiments.
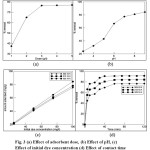 |
Figure 3 (a): Effect of adsorbent dose, (b) Effect of pH, (c) Effect of initial dye concentration (d) Effect of contact time. |
Kinetic studies are important since it gives the uptake rate of solute, which decides the residence time needed for completion of the adsorption process. Also, the kinetic information may reveal the scale of an adsorption apparatus. Generally speaking, adsorption kinetics is the basis for determining the performance of fixed-bed or any other systems 24. First, the adsorption kinetics was analysed using pseudo first order model by Lagergren as mentioned below .
![]()
whereqe = amounts of MG dye adsorbed (mg/g) at equilibrium, qt= amounts of MG dye adsorbed (mg/g) at time t (min), and k1 = rate constant adsorption (min-1). Values of k1 and qe were calculated from the slope and intercept of plot ln(qe – qt) versus t and tabulated in Table 3. The calculated values of qe as obtained from the linear plot did not match with the experimental values.
On the other hand, pseudo-second-order equation can be written as

where k2 = pseudo-second-order rate constant (g/mg-min). A linear plot of t/qt and t (Fig 5) gives a good value of R2 above 0.99 and the calculated qevalues (Table 1) are in agreement with the experimental values. This is an indication of the applicability of pseudo-second-order model to the MG dye adsorption. Similar results were also observed during the adsorption of methylene blue onto palm oil fibre char 25 and kenaf fibre char 26.
Table 1: Kinetic constants for MG adsorption on EWBC
| Pseudo-first-order | Pseudo-second-order | ||||||||
| Temp.(K) | qe,exp(mg/g) | qe,calc(mg/g) | k1(per min) | R2 | Error | qe,calc(mg/g) | k2(mg/g-min) | R2 | Error |
| 303 | 38.437 | 18.684 | 0.041 | 0.967 | 51.4 % | 37.594 | 0.0064 | 0.993 | 2.2% |
| 313 | 42.116 | 19.471 | 0.059 | 0.959 | 53.8% | 43.103 | 0.0067 | 0.995 | 2.3 % |
| 323 | 45.699 | 33.398 | 0.123 | 0.871 | 28.1% | 48.077 | 0.0073 | 0.996 | 5.2% |
Intra-particle diffusion model is also studied in order to find out whether the rate limiting step is intra-particle diffusion, film diffusion, or mass action. The mass action is a very fast step in physical adsorption; hence it can be neglected 24. The intra-particle diffusion model by Weber-Moris can be written as follows,

Fig. 4 shows the plots of qt versus t1/2. The value of the slope correlates to intra-particle diffusion constant (kd,i) and the intercept value (Ci) at an approximate value of the boundary layer thickness. The data at three different temperatures show two stages of linearity. The first stage is the instantaneous adsorption, completed well within the initial 40 min, and the second stage is the gradual adsorption where the rate limiting step is intra-particle diffusion. Both the linear lines, not passing through the origin, suggest that the intra-particle diffusion was not the only limiting mechanism in the process of adsorption 24. Table 2 shows the values of kd,i , Ci and R2 obtained for the plots. The R2 values are lower than predicted values by the pseudo-second-order model, showing that the qexp values are not in agreement with the intra-particle diffusion model.
Table 2: Intra-particle diffusion models
|
Temp. (K) |
First linear portion |
Second linear portion |
||||
|
R2 |
kd,1 (mg/g min.) |
I1(mg/g) |
R2 |
kd,2 (mg/g min.) |
I2(mg/g) |
|
|
303.15 |
0.950 |
2.870 |
27.59 |
0.880 |
0.035 |
45.30 |
|
313.15 |
0.952 |
2.914 |
22.05 |
0.928 |
0.055 |
41.48 |
|
323.15 |
0.950 |
2.870 |
16.79 |
0.921 |
0.051 |
37.85 |
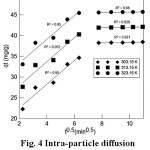 |
Figure 4: Intra-particle diffusion model
|
Adsorption isotherms
The isotherms which correlate the adsorbate concentration in the bulk and the adsorbed amount at the interface are represented as below
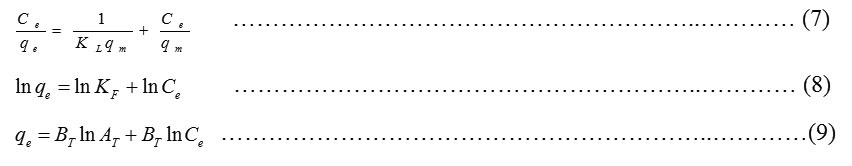
whereCe= any liquid phase concentration of the dye in equilibrium with the adsorbent, qe = equilibrium adsorption capacity of the adsorbent, qm = monolayer capacity, qe = theoretical monolayer saturation capacity of adsorbent (mg/g), KL= Langmuir adsorption constant, KF= Freundlich constant for relative adsorption capacity of adsorbent, AT= Temkin isotherm equilibrium binding constant (L/g), BT = Temkin heat of adsorption27. Three isotherms Langmuir, Freundlich and Temkin were analysed using experimental data obtained from the adsorption of MG dye on EWBC. The plots of the isotherms are shown in Fig.4. The linear regression coefficient, values as mentioned in Table 3, clearly show that the experimental values best fit with the Langmuir model.
Table 3: Isotherm coefficients for the MG dye adsorption.
| Langmuir isotherm | Freundlich isotherm | Temkin isotherm | |||||||
|
Temp. K |
R2 |
qm (mg/g) |
KL |
R2 |
n |
KF (L/g) |
R2 |
BT (J/mol) |
AT (L/mg) |
|
303.15 |
0.9999 |
156.25 |
0.0328 |
0.9740 |
1.3916 |
7.8959 |
0.9640 |
30.172 |
0.4631 |
|
313.15 |
0.9896 |
158.73 |
0.0446 |
0.9840 |
1.3887 |
8.9269 |
0.9790 |
31.317 |
0.5249 |
|
323.15 |
0.9877 |
163.93 |
0.0660 |
0.9610 |
1.4341 |
12.7116 |
0.9750 |
32.133 |
0.7901 |
RSM modelling
Regression analysis was carried out to fit the percentage adsorption of MG. The regression model developed correspond to the responses as function of contact time, temperature, dye concentration, pH and adsorbent dose. An empirical relationship between response and input variables is expressed by the under mentioned response surface reduced cubic model equation (in coded terms as mentioned in Table 4):

The implication of model terms included in the equations was evaluated by the F–test for analysis of variance (ANOVA). The lower P-value or higher F or T value indicates more significance of the model parameters [28]. The response analysis is shown in Table 4. Prob> F values for the models less than 0.05 show that the model terms are statistically significant.
Table 4: Analysis of Variance (ANOVA) results
| Source | Sum of squares |
df |
Mean squares | F value |
P-value Prob> F |
| Mode l |
53489.93 |
12 |
4457.49 |
540.57 |
<0.0001 |
| A-Contact Time |
28868.42 |
1 |
28868.42 |
3500.95 |
<0.0001 |
| B-Temperature |
25.20 |
1 |
25.20 |
3.06 |
<0.0887 |
| C-Dye Concentration |
31.33 |
1 |
31.33 |
3.80 |
<0.0589 |
| D-pH |
1193.95 |
1 |
1193.95 |
144.79 |
<0.0001 |
| E-Adsor. Dose |
3753.96 |
1 |
3753.96 |
455.25 |
<0.0001 |
| AC |
26.79 |
1 |
26.79 |
3.25 |
<0.0796 |
| AD |
1065.37 |
1 |
1065.37 |
129.20 |
<0.0001 |
| AE |
3236.50 |
1 |
3236.50 |
392.50 |
<0.0001 |
| DE |
57.14 |
1 |
57.14 |
6.93 |
<0.0123 |
| A2 |
3189.33 |
1 |
3189.33 |
386.78 |
<0.0001 |
| D2 |
140.03 |
1 |
140.03 |
16.98 |
<0.0002 |
| E2 |
386.69 |
1 |
386.69 |
46.89 |
<0.0001 |
| Residual |
305.10 |
37 |
8.25 |
||
| Lack of Fit |
38.33 |
30 |
9.48 |
3.19 |
0.0577 |
The three-dimensional (3D) response surface plots as resulted by changing two factors and keeping all other factors constant, are helpful in understanding the interaction effects of these two factors [29]. The corresponding contour plots, as emerged in the X-Y plane, give a straight forward determination of the effects of the independent variables on the dependent variables [30].
The 3D response surface plots and associated contour plots obtained from the analysis are presented in Fig. 5(a) -adsorbate removal vs contact time and pH, 5(b) -adsorbate removal vs contact time and dye concentration, 5(c) -adsorbate removal vs contact time and adsorbent dose and 5(d) – adsorbate removal vs pH and adsorbent dose respectively.
From each response surface plot, the optimum values of the variable factors, such as the initial MG concentration (Ci) and the contact time (t) can be analyzed through the determination of the maxima formed by the X and Y-coordinates. The normal probability plot given in Fig. 6 (a) indicates the normal distribution of errors, as all the points lie close to diagonal line.
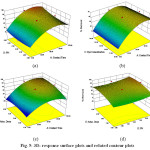 |
Figure 5: 3D- response surface plots and related contour plots |
Process optimization
The optimum process conditions were estimated with the optimizer tool provided in the Design Expert. They are contact time-120 min, temperature- 50 0C, dye concentration – 20 mg/L, pH – 9 and adsorbent dose – 5 g/ L to achieve maximum removal. Fig. 6 (b) shows the comparison of predicted removal with experimental removal of the adsorbate. The linear regression correlation coefficient (R2) value 0.994, which is close to unity, indicates that regression equation follows the experimental data with good accuracy.
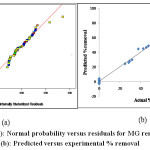 |
Figure 6 (a): Normal probability versus residuals for MG removal, (b): Predicted versus experimental % removal |
Conclusion
Eucalyptus wood biochar (EWBC) was prepared by pyrolysis and used as an adsorbent for removal of MG dye. The functional groups on the adsorbent are given by FTIR. Analysis of X-ray diffraction pattern shows its crystalline structure whereas SEM shows its porosity. The percentage removal was observed to increase with increasing adsorbent dose, temperature, contact time and pH. The pseudo-first-order, second-order, and intra-particle diffusion models were employed to investigate the adsorption process. The kinetic studies illustrate that the adsorption kinetics was more accurately described by pseudo-second-order model. The equilibrium data were in best agreement with Langmuir isotherm model, demonstrating maximum monolayer adsorption capacity of 163.93mg/g of adsorbent. The optimum process conditions estimated are contact time -120 min, temperature – 50 oC, dye concentration – 20 mg/L, pH – 9 and adsorbent dose – 5g/L to obtain maximum removal.
Acknowledgment
The researchers are grateful to the administration of National Institute of Technology Raipur; Chhattisgarh, India for providing necessary infrastructure and laboratory facilities for carrying out the research works in the different laboratories of the Institute.
References
- E.I. Unuabonah, K.O. Adebowale and F.A. Dwodu, J. Hazard. Mater.,2008.157, 397-409
- B. Zohra, K. Aicha, S. Fatima, B. Nourredin and D. Zoubir, Chem. Eng. J., 2008. 136, 295-305
CrossRef - V. Gómez, M.S. Larrechi and M.P. Callao, Chemosphere, 2007. 69, 1151-1158
CrossRef - V.K. Gupta, R. Kumar,T.A. SalehNayak, and M.A. Barakat, Adv Colloid Interfac,2013.193-194, 24-34
- E. Bulut, M. Ozcar and I.A. Sengil, J Hazard Mater,2008.154, 613-622
- A.S. Ozcan and A. Ozcan,,J Colloid InterfSci, 2004.276, 39-46
- B. Acemioğlu, J Colloid InterfSci,2004.,274, 371-379.
CrossRef - M.K. Purkait, A. Maiti, S. Das Gupta and S. De, J Hazard Mater,2007.,145, 289-295.
CrossRef - Y.L. Song, J.T. Li and H. Chen, J ChemTechnolBiot,2009. 84, 578-583
CrossRef - C. Liu, H.H. Ngo and W. K. Guo, BioresourceTechnol,2012.119, 349-354
- S.V. Yadla, V. Sridevi and M.V.V.C. Lakshmi., Journal of Chemical, Biological and Physical Sciences,2012.2, 1585-1593
- F. Gonen, and D.S. Serin., African Journal of Biotechnology,2012.11, 1250-1258
- M.B. Ibrahim and S. Sani, Open Journal of Physical Chemistry,2014.,4, 139-146
CrossRef - M.A.M. Salleh, D.K. Mahmoud, W.A. Karim and A. Idris, Desalination, 2011.280, 1-13
- N. Sharma, D.P. Tiwari and S.K. Singh, International Journal of Scientific & Engineering Research, 2012.3, 1-10
- Dinesh Mohan, AnkurSarswat , Yong Sik Ok and Charles U. Pittman Jr., BioresourceTechnol, 2014.160 191–202
- Khalid Elyounssi , François-Xavier Collard , Jean-aimeNgolloMateke and Joel Blin, Fuel,2012.96 161–167
- ZaidaRahayu Yet and MohdZulkhairi Abdul Rahim, The Malaysian Journal of Analytical Sciences, 2014.18, 3, 592 – 603
- Y.Liu, Y.Zheng and A.Wang, AdsorptSciTechnol,2010.28,913-922
- Ramakrishna Gottipati and Susmita Mishra,Res.J.Chem.Sci ,2012.2, 40-48
- R. Ahmad and R. Kumar, J Environ Manage, 2000.91, 1082-1088
- M. A. Ackacha and M Drmoon, International Conference on Transport, Environment and Civil Engineering (ICTECE’2012). Kuala Lumpur (Malaysia).
- 23.K. Reena, M. Goyal, M. Bhagat, G. R. Chaudhary and M. L. Sharma, Indian J ChemTechn, 2013.20, 87-94
- H. Qiu, L. Lv, B.C. Pan, Q.J. Zhang, W.M. Zhang and Q.X. Zhang, Journal of Zhejiang University Science A,2009. 10 (6), 716-724
CrossRef - A. W. Tan, B. H. Hameed and A. L. Ahmad, Chem Eng J,2007.127, 111-119
- D. K. Mahmod, M. A. SAlleh Mohmd, W. A. Karim, A. Idris and Z. Z. Abidin,. ChemEng J,2012.181-182, 449-457
- B.K. Suyamboo and R.S. Perumal, Iranica Journal of Energy & Environment,20123, 23-34.
- Y. Liu Zheng and A. Wang,2010. 28, 913-921
- K. Adinarayana, and P. Ellaiah, J. Pharm Pharm Sci. 2002.5,272
- D. Wu, J. Zhou, and Y. Li, Chem. Eng. Sci.2009.64,198

This work is licensed under a Creative Commons Attribution 4.0 International License.
![]()
A New Edition of Web of Science
Journal Impact Factor
2022: 0.5
Five Year: 0.8
Journal is Indexed in

Cabells Whitelist
![]()


