Phytochemical Properties of Processed Chickpea Varieties of Haryana (India)
Savita Rani and M. Khabiruddin
Department of Chemistry and Biochemistry, CCS Haryana Agricultural University, Hisar, India.
Corresponding Author E-mail: savita0129@gmail.com
DOI : http://dx.doi.org/10.13005/ojc/320556
In present study, we investigated the nutraceutical potential of seed coat, dehulled raw dal, cooked dal, whole seed of dark coloured desi chickpea and light coloured kabuli chickpea. Locally grown varieties of Haryana (India) named HC-1 and KC-1 were under investigation. Total phenolic content, o-dihydric phenols, hydrophilic and hydrophobic phenols, flavonoid contents were determined in methanolic extracts of both cultivars. Free radical scavenging efficiencies were estimated by adoption of DPPH (2, 2-diphenyl-1-picrylhydrazyl) assay method. Similarly, antioxidant activities in terms of peroxide inhibition were measured by using ferric thiocyanate solution. Results concluded that phenolic contents varied widely in seed parts as well as in cooked cotyledons and correlated (p<0.05) significantly with antioxidant properties in most of the extracts. Desi chickpea genotype was found to be better source as nutraceutical food than that of kabuli chickpea.
KEYWORDS:Chickpea; antioxidant; flavonoids; phenolics; free radical scavenging activity
Download this article as:| Copy the following to cite this article: Rani S, Khabiruddin M. Phytochemical Properties of Processed Chickpea Varieties of Haryana (India). Orient J Chem 2016;32(5). |
| Copy the following to cite this URL: Rani S, Khabiruddin M. Phytochemical Properties of Processed Chickpea Varieties of Haryana (India). Orient J Chem 2016;32(5). Available from: http://www.orientjchem.org/?p=22608 |
Introduction
Various antioxidants such as tert-butylhydroquinone (TBHQ), butylatedhydroxytoluene (BHT), propyl gallate and butylatedhydroxyanisole (BHA) are synthetically produced and found to have scavenging properties suitable enough for the treatment of various ailments. However, due to their wide range of toxicity their application in the medical science have not been appreciated so much. Therefore, the screening of medicinal and food plants for antioxidant properties have been performed efficiently for the last few decades. Polyphenols found in fruits, grains, vegetable and legumes possess different bioactivities like antioxidation, anticancer, antiaging, cardiovascular protection, inhibition of unnecessary cell prolification (Miller et al., 2000; Anderson et al., 1999). Chickpea (CicerarietinumL.) is an important leguminous crop and has been extensively grown in parts of north and east Africa, southern Europe, middle eastern countries and India as their major pulse crop (Iqbal et al., 2006). In south Asian subcontinent, two morphologically different forms of chickpea are being grown which are different in size, shape and color. One produce small seeds having angular surface and yellowish-brown to dark brown in color and popularly known as the desi variety whereas the other produce relatively large seeds having round surface and yellowish-white to light-brown color and popularly known as the kabuli variety. Temperate environmental conditions are more favoured by the Kabuli chickpea whereas semi-arid climate is conducive for desi chickpea. The coats of colorful seeds varieties viz. pink, red and black are rich in anthocyannin pigments, phenolic compounds and antioxidant (Mazza and Miniata, 1993). Reviewing the existing literature confirms that few research has been done to measure phenolic activity and antioxidant potential of desi chickpea seeds (Zia-Ul-Haqet al., 2008; Segevet al, 2011). But in India, pulses are processed and cooked in a number of ways. These different treatments and cooking methods can alter the physical characteristics and chemical compositions of the food. Some common reports state that thermally cooked foods have less nutritional value as compared to fresh foods due to decline in specific physicochemical features (Barros, 2011; Zhang, 2004). While other studies conclude that cooking enhances antioxidant activities by dissolving antioxidantcompounds from insoluble and bounded parts of food (Turkmanet al., 2005; Dewantoet al., 2006). However, taken together, studies on effect of processing on chickpea local varieties developed in Haryana (India), no information is available in the literature regarding phytochemical constituents and their antioxidant properties. After thorough investigation and considering above facts and information this study was undertaken to measure the chemical composition of whole seeds, seed coats, decoated raw dal and cooked dal of desi and kabuli chickpea as well as to analyse the anti-oxidant and anti-radical activity of the methanolic extracts of the samples. Studying such local legume will furnish information to the consumers and manufacturers of value added foods for betterment of human health.
Materials and Methods
Seed Material
For experimental analysis healthy seeds of desi chickpea var. Haryana chana-1 (HC-1) and kabuli chickpea var. kabuli chana-1 (KC-1) were provided by the Pulses section, Department of Genetics and Plant Breeding, CCS Haryana Agricultural University (India). These seeds were cleaned to remove foreign materials, damaged seeds and immature seeds. After sorting, major portion of seeds from each variety were dehusked to obtain seed coat and dal. Dehusked dal was divided into two sets. The first set was kept for extraction which constitutes intact dehusked seeds and second part was cooked using distilled water in 1:10 (w/v) ratio at 100◦C, dried at 55◦C. Thus, we obtained four samples of desi chickpea and four samples of kabuli chickpea, 100 g each for further analysis.
Preparation of Extracts
For the preparation of extracts the samples were ground using electric grinder and converted into fine powder. Powdered samples were then extracted separately by reflexing for six hours using methanol. Extracts produced after refluxing were filtered and the filtrates were concentrated under reduced pressure on rotating evaporator at 40◦C. These concentrated filtrates were stored at 5◦C for analyses of phytoconstituents.
Determination of Total Phenolic Content
Determination of total phenolic content was done by Folin- Ciocalteu reagent using gallic acid as standard (Shahidi and Naczk, 2001).To a 50 ml volumetric flask 1.0 ml extract, 1.0 ml Folin–ciocalteau reagent (50% v/v) and 2.0 ml of Na2CO3 (20%w/v) were added and mixed and final volume was made to 50 ml. The mixture was allowed to settle for 30 minutes and then centrifuged at 6000 rpm for 5-7 minutes. After centrifugation, solution was measured colorimetrically at 730 nm using Shimadzu UV-Vis spectrophotometer (UV-2600). A blank was also prepared by following same aforementioned procedure without sample. After multiplication with the dilution factor the concentration of phenolic content was expressed as equivalent to milligrams of gallic acid per gram of extract (mg GAE/g) by using standard plot.
Determination of Hydrophilic and Hydrophobic Phenolic Contents
For the determination of hydrophilic and hydrophobic phenolic contents 50 ml of crude extract was fractionated to obtain constituting hydrophilic and hydrophobic components. It was done by mixing the extract with deionised water and n-butanol (100ml each) in separating funnel as per Wettasinghe’s method (2000).The mixture was then allowed to stand until separate layers visible. Separated layers were then concentrated using rotavapor at 40◦Ctemperature. After measuring the weight of each fraction the phenolic contentof each fraction was determined as per Shahidi and Naczk method.
Preparation of Standard Curve of o-dihydric Phenols
Preparation of standard curve was done by estimating o-dihydric phenols in methanol extracts by Arnow’s method (Kim et al., 2003) using catechol as standard. 0.4 ml of extracted solutions were added to 1 ml 0.5N HCl, 1 ml Arnow’s reagent and 2 ml 1N NaOH. Final volume was made to 10 ml using double distilled water. The intensity of resulting orange red colour was measured colorimetrically at 515 nm using spectrophotometer. Standard curve was made by plotting absorbance against amount of catechol used (mg). A blank was also prepared by following same aforementioned procedure without extract.
Determination of Flavonoids
The aluminium chloride colorimetric assay, as described by Zhishenet al. (1999) with modification was used. Briefly, 1 ml of diluted (1:4) extracts was added. A blank solution using doubled distilled water was prepared. Then 0.3 ml 5% NaNO2 was added to the testing samples, followed by 0.3 ml 10% AlCl3, 2 ml of 1M NaOH and the total volume was made10ml with dilution and mixed thoroughly. Then the absorbance was measured at 510 nm against blank. Total flavonoid contents were expressed as mg catechin equivalent per gram of the extract (mg CAE/g).
2, 2’-Diphenyl-1-picrylhydrazyl (DPPH) Free Radical Scavenging Assay
2, 2’-Diphenyl-1-picrylhydrazyl (DPPH) free radical scavenging assay was used to evaluate the antioxidant activity of the both the genotypes. The antioxidant response of extracts against DPPH free radical was estimated by method of Hatanoet al, 1988. Methanol treated extracts were dried completely and weighed. The dried mass of methanol extracts was redissolved in required volume of methanol to make the stock solution (5 mg/ml).
Different concentrations (for desi chickpea 0.5 to 3 mg/ml and for kabuli chickpea 0.5 to 4 mg/ml) were made by appropriate dilutions with 100% methanol from the stock solution. In extracts of different concentrations, 2.0 ml of DPPH solution (0.025 g L-1 in 50% methanol) was added and the mixture was shaken and absorbance was measured at 515 nm at every 5 minutes interval until the reaction subsided. After 2 hours the percent absorbance was declined corresponding to the percentage of DPPH scavenged which was an expression of antioxidant activity. During this process butylatedhydroxylanisole (BHA) and butylatedhydroxyltoulene (BHT) with conc. 0.1-1.0 mg/ml were used as standard solutions having same preparatory method. Similarly, a control sample was also prepared. By using Microsoft Excel Software, a quadratic regression equation (y = ax2+bx+c) was obtained. By putting y = 50% in the equation y = ax2+bx+c; it was converted to the form ax2+bx+c = 0. IC50 was calculated from the equation ax2+bx+c = 0 by using the formula:
where, x = IC50 (mg/ml)
Calculation
The calculation for DPPH scavenged (% DPPH*sc) was done by following formulae:
Where Acontrol and Asample is the absorbance of control and the sample. Based on the results obtained after calculation a graph was made by plotting percent DPPH free radical scavenging activity or inhibition percentage (y-axis) against extract concentration (x-axis).
Ferric Thiocyanate (FTC) Method
The FTC method was given by Kikuzaki and Nakatani (1993). This method was used for the evaluation of antioxidant activity of the extracts under study. After making required dilutions with methanol, 0.5 to 3 mg/ml of desi chickpea and 0.5 to 4 mg/ml kabuli chickpea samples were made. After that, samples were mixed with 5 ml of linoleic acid emulsion and final volume was madeto 10 ml using 0.2 M phosphate buffer (pH 7.0) and incubation was done at 37◦C for 96 hours (4 days). After incubation aliquots of 0.1 ml were drawn from the incubated mixture after 24 hours interval and mixed with 30% ammonium thiocyanate, 20 mM ferrous chloride in 3.5% HCl and final volume was made to 10 ml with 75% ethanol and allowed to stand for 10 minutes. The color developed was measured colorimetrically at 500 nm using spectrophotometer. For this experiment butylatedhydroxylanisole (BHA) and butylatedhydroxyltoulene (BHT) were used as standard solutions and by using quadratic regression equation (y = ax2+bx+c) calculations were done as described earlier. A control mixture was prepared simultaneously following same procedure without the test sample.
Calculation: observed antioxidant activity was expressed as:
Antioxidant activity (%) = {1- (increase in abs. of sample/ increase in abs. of control)} x 100
Statistical analysis
Four replications of each sample were used for statistical analysis for minimising random experimental error. Values obtained were expressed as mean± S.E. Both one way and two way analysis of variance (ANOVA) and F-test were carried out to asses significant differences in between means (p<0.05). Correlation analyses of polyphenolic composition and their antioxidant activities were carried out using Pearson correlation programme in Online Statistical Analysis (OPSTAT www.hau.ernet.in).
Result and Discussion
Extract yield of all the four treatments of each pulse crop varied widely. In case of desichickpea, seed coat extract had highest yield (7.01) followed by whole seed extract (6.87), raw dal extract (5.89) and cooked dal extract (4.60) in g/100g seed. Similarly kabuli chickpea had also highest extract yield in case of seed coat extract (8.34) but least in case of raw dal extract (3.10). As per Nithiyananthamet al, 2012, the percentage of extract yield of chickpea seeds when processed differentially was in range from 1.33 to 28.06%.The variation in yields of different extracts of Haryana chana-1 and Kabuli chana-1 is attributed to polarities of various compounds present in various seed parts and analogous differences have been explained in literature (Jayaprakashaet al., 2001 and Hasmidaet al. 2014).
As per results analysed for estimation of total phenolic content in desi chickpea extracts, seed coat contained highest amount of total phenolics i.e. 25.24 mg GAEg-1. Desi chickpea whole seed extract contained 18.72 mg GAE g-1 which were similar to those found in the literature (Xu and Chang, 2008) i.e. 14.4 mg GAE/g and Nithiyananthamet al, 2012 19.42 mg GAEg-1, but lower than those noted in other legumes faba bean (major and minor) 30.93 mg GAEg-1, 42.44 mg GAEg-1 respectively. Rest of the extracts contained significantly reduced amount. Raw dal extract contained 8.07 mg GAEg-1, cooked dal extract contained 7.60 mg GAEg-1.Similarly, in kabuli chickpea genotype, phenolic content was highest in seed coat (6.82 mg GAEg-1). Corresponding value for total phenolics in raw dal, cooked dal, whole seed extract was 1.85, 1.72, 5.45 mg GAEg-1. Raw dal and cooked dal phenolic contents were statistically at par with each other. According to studies done so far it has been found that the function of seed coat is to protect the cotyledon by acting as a protective barrier which is composed of phenolic compounds in high concentrations (Shahidiet al., 2002; Troszynskaet al., 1997).
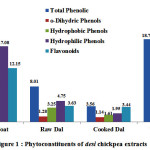 |
Figure 1: Phytoconstituents of desi chickpea extracts
|
In desi chickpea variety, for 100 g sample, the o-dihydric phenols were observed as 0.013 % in seed coat extract, 0.007% in raw dal extract, 0.005% in cooked dal extract and 0.012 % in whole seed extract while inKabuli genotype order follows as: seed coat (0.56%) > whole seed (0.45%) > raw dal (0.057%)~ cooked dal (0.056%). Lopez-Amoroset al. in 2006 stated that chickpea possess varying concentrations of hydroxybenzoic phenolic compounds, vanillic acid, p-hydroxybenzoic, protocatechuic, trans-ferulic acid, cis and trans p-coumaric acid.
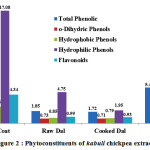 |
Figure 2: Phytoconstituents of kabuli chickpea extracts
|
Segevet al., (2011) stated that the kabuli chickpea cotyledon has very less phenolic content and consists mainly hydroxybenzoic acids, free and combined hydroxycinnamic acids and (+)-catechin. Graphical representation for various phytochemical contents in desi and kabuli chickpea extracts is given in Fig. 1 and Fig. 2 respectively.
In desichickpea extracts, it was observed that total phenolics reported in seed coat extract was 25.24 mg GAEg-1 and it consisted of 32% (w/w) and 68% (w/w) of hydrophobic and hydrophilic phenols (ratio of approx. 1: 2, w/w) respectively (Fig. 1).In case of, raw dal extract, it contained 3.25 mg GAEg-1 hydrophobic and 4.75 mg GAEg-1 hydrophilic phenols which constituted 41% (w/w) and 59% (w/w) of total phenolics (8.01 mg GAEg-1). Similarly, cooked dal extract possessed 1.61 mg GAEg-1 hydrophobic (73%, w/w) and 1.95 mg GAEg-1 hydrophilic phenols (27%, w/w). Whole seed methanolic extract had total phenol with the value of 18.72 mg GAEg-1and it exhibited 66% and 34% (w/w) for hydrophilic (12.39 mg GAEg-1) and hydrophobic (6.32 mg GAEg-1) phenol respectively
Hydrophobic and hydrophilic phenols of all the four treatments of kabuli chickpea varied widely (Fig.2). In seed coat extracts, hydrophobic and hydrophilic phenols were 2.48 mg GAEg-1 and 4.34 mg GAEg-1 which exhibited 36% and 64% of total phenolics respectively. In case of raw dal and cooked dal extract hydrophobic phenols were (46% of total phenol) 0.85 mg GAEg-1 and (46% of total phenol) 0.79 mg GAEg-1 while hydrophilic phenols were (54% of total phenol) 0.96 mg GAEg-1 and (54% of total phenol) 0.94 mg GAEg-1respectively. Similarly, in whole seed extract 37% and 63% of total phenols was constituted by hydrophobic and hydrophilic phenols.
In present studies, total phenolics including o-dihydric phenols, hydrophobic and hydrophilic phenols were observed to be decreased on cooking. Segevet al., 2011, reported 85% decrease in total phenolics by cooking in kabuli chickpea. Similarly, Hwang et al., 2012, found that boiling and steaming significantly decreased the ascorbic acid content, total phenolics, and anti-oxidant potential as compared with the other cooking methods. Reduced total phenolics in boiled or steamed foods have been attributed to the solvation of phenolic constituents into the cooking water (Zhuanget al., 2012). Therefore, fractions of hydrophilic phenols were high in some extracts while few extracts (mainly cooked dal) were having high hydrophobic phenolic content. Also, extraction ability of phenolic compounds is a function of polymerization of phenolic compounds, interaction of phenolics with various food constituents, type of solvent, solvent polarity, temperature and time of reaction(Maratheet al., 2011; Oomahet al., 2011).
In desi chickpea extracts, it was observed that flavonoid content was highest in seed coat (12.15 mg CAEg-1) analogous with result obtained for total phenolics. Corresponding values for flavonoid content in raw dal, cooked dal, whole seed extracts were 3.63, 3.44, 12.25 mg CAEg-1 Flavonoids in raw dal and cooked dal were statistically at par with each other. Similarly, in kabuli genotype, the methanolic extract of seed coat showed maximum flavonoid content (3.13 mg CAEg-1) followed by whole seed extract (1.90 mg CAEg-1), raw dal extract (1.18 mg CAEg-1) and minimum in cooked dal extract (1.08 mg CAEg-1). As reported by Sharma et al., 2013, the total flavonoid content in selected desi and kabuli chickpea cultivars ranged from 0.15 mg QE g-1 of flour to 0.36 mg QE g-1 of flour. Total flavonoid content of the desi cultivar was found significantly higher than kabuli cultivars of chickpea which is in conformity to current studies. Ladjal and Chinabe (2015) reported that total flavonoid content of the chickpea (12.7 mg QEg-1) and pea (12.5 mg QEg-1) extracts was found significantly (p<0.05) less as compared to the lentil extract (25.9 mg QEg-1). Whereas, concentrations of glycosides of quercetin, luteolin and apigenin was found significantly (p<0.05) higher in the seed coat of both peas as reported by Duenaset al. (2006).
Basically two methods were used for evaluation of antioxidant activities which are known as 2, 2’-diphenyl-1-picrylhydrazyl radical (DPPH) method and ferric thiocyanate (FTC) method. In both the experimental technique (DPPH as well as FTC method) for measuring antioxidant activities, butylatedhydroxyltoulene (BHT) and butylatedhydroxyanisole (BHA) were used as standards. IC50 value obtained for BHT and BHA solutions by DPPH method was 0.41 and 0.60 respectively (Fig.10). Corresponding (%) antioxidant activity or scavenging efficiency was 86.00% and 75.00%. Similarly by FTC method, IC50 value observed for BHT and BHA solutions was 0.63 and 0.70 respectively. Inhibition percentage in terms of antioxidant activity by FTC method was 76.00% in BHT and 66.60% in BHA. IC50 values obtained by DPPH method in desi chickpea extracts were 0.95, 1.32, 1.34, 1.14 mg/ml for seed coat, raw dal, cooked dal, whole seed respectively. The corresponding maximum antioxidant activity (%) at 3 mg/ml was 72.50, 64.20, 63.00, 67.60. But the % of inhibition or antioxidant activity of methanolic extracts by ferric thiocyanate method in cooked dal, raw dal, whole seed, seed coat was 58.00, 60.00, 63.20 and 67.00 respectively. Corresponding IC50 values for all extracts were 2.07, 2.08, 1.77, 1.58 mg/ml. Analogous to results obtained for total phenolics, antioxidant activities were highest in seed coat extracts and lowest in cooked dal extracts.
As per the results obtained by DPPH method for kabuli chickpea, the % of inhibition of methanolic extracts in ascending order is: cooked dal (53.80) < raw dal (56.00) < whole seed (60.30) <seedcoat (67.00) while order for free radical scavenging efficiency of different extracts of kabuli chickpea follows: seed coat (62.50%) > whole seed (59.00%) > raw dal (52.00%) ~cooked dal (51.00) by FTC method. Xu and Chang, (2008) reported that free radical scavenging capacity and antioxidant activity had been found significantly (p<0.05) reduced after boiling in cool season edible legumes. The data for antioxidant activities is in accordance with the study of other research workers. Greenish brown seed coat of lentil had shown strong antioxidant activity and possessed high phenolic content whereas kabulichickpea being made up of light colored seed coat shown relatively weak antioxidant activity and comparatively less phenolic content.This result was also concluded by Maratheet al. (2011) for various legumes. Similar relationship between chemical structure of flavonoids and their antioxidant activities had been analysed by Aroraet al., 1998. They investigated the anti-oxidant properties of genistein and daidzein which help inhibit peroxidation of lipid in a liposomal system. According to them, presence of hydroxyl substituents on flavonoid skeleton boosts activity. However, different phenolics show different antioxidant activity ranging from strong antioxidant to weak antioxidant and due to this varying antioxidant activity strength they act as antagonists or synergists with themselves or with the other constituents of the extracts. (Moran et al., 1997; Leinet al., 1999). Therefore, different phenolic compounds respond differently toward antioxidant assays.
Correlation studies are used to study the interaction between polyphenolic compounds such as total phenolics, o-dihydric phenols, hydrophobic phenols, hydrophilic phenols, flavonoids and their corresponding antioxidant activities. Correlation studies had shown positive and prominent correlation between total phenolics, antioxidant activities and flavonoids. According to Shahidi (2002) it was stated that positive and prominent correlation existed between catechin content and antioxidant activity in beach pea seed coats. As per finding of Sancho et al., 2013, some hydrophilic phenols and lipophilic phenols showed contribution towards total antioxidant activity in papaya fruit while others showed antagonistic effect. In conformity to the above results Yao et al., 2010 explained the existence of positive correlation in between total phenolics and antioxidant activity in seven different colored grains.
Free-radical scavenging activity was observed in combined and free hydroxycinnamic compounds to a greater extent as compared to analogous hydroxybenzoics. It has also been found that few o-dihydric phenols, hydrophobic phenols and hydrophilic phenols were found to be non-significant and negatively correlated with each other. Extraction of different components of pulses can be done by adopting various processing methods such as cooking and soaking (Mubarak, 2005). Furthermore, it has been found that various components of phenolic substances were responsible for their contribution to antioxidant activity of varying degrees. Moreover, it was found that presence of various phenolic substances complex in the extract was responsible for synergistic effect whereas negative correlation existed when phenolic compounds are correlated in different modes in various assay systems. Hence, the results showed that inspite of cooking effect, the phytochemical constituents and antioxidant activity in seedcoat as well as cotyledon of chickpeas were strongly linked. The present study has highlighted the impact of solvent used for extraction, method of extraction, cultivar and its processing. Therfore, it can be concluded that raw and processed desi chickpeas are an important source of antioxidant compounds than that of kabuli genotype.
Acknowledgement
Authors are thankful to the Hon’ble Vice Chancellor, CCS HAU, Hisar, for providing financial assistance. Seeds were obtained from Dr. Rajesh Yadav, Pulses Section,CCS HAU, is highly acknowledged.
References
- Miller, H.E.; Rigelhof, F., Marquart, L.; Prakash, A.; Kanter, M. Whole-grain products and antioxidants.Cereal Foods World, 2000, 45, 59–63.
- Anderson, J.W.; Smith, B.M.; Washnock, C.S. Cardiovascular and renal benefits of dry bean and soybean intake.American Journal of Clinical Nutrition, 1999, 70, 464S– 474S.
- Iqbal A.; Ateeq N.; Khalil I.A.; Perveen S.; Saleemullah S. Physicochemical characteristics and amino acid profile of chickpea cultivars grown in Pakistan. J. Foodservice, 2006, 17: 94-101.
- Mazza, G. and Miniati, E. Anthocyanins in Fruits, Vegetables and Grains.1993, CRC Press, London.
- Zia-Ul-Haq, M.; Iqbal, S.; Ahmad, S.; Bhanger, M.I.; Wiczkowski, W.; Amarowicz, R. Antioxidant Potential of desi chickpea varieties commonly consumed in Pakistan.J. Food Lipid, 2008, 15, 26-342
- Segev,A.; Hana, Badani ;Galili, Liel ; Ran, Hovav ; Yoram, Kapulnik , Shomer, Ilan; Galili, Shmuel. Total phenolic content and antioxidant activity of chickpea (cicerarietinum L.) as affected by soaking and cooking conditions.food and nutrition sciences, 2011, 2, 724-730.
- Barros, L., Baptista, P.; Correia, D.M.; Morais, J.S.; Perreira, I.C.F.R. Effects of conservation treatment and cooking on the chemical composition and antioxidant activity of portuguese wild edible mushrooms. J Agric Food Chem. 2007, 55, 4781–4788.
- Zhang, D.L.; Hamauzu, Y.; Phenolics, ascorbic acid, carotenoids and antioxidant activity of broccoli and their changes during conventional and microwave cooking. Food Chem. 2004, 88, 503–509.
- Turkmen, N.; Sari, F.; Velioglu, Y.S. The effect of cooking methods on total phenolics and antioxidant activity of selected green vegetables. Food Chem,2005, 93, 713-718.
- Dewanto, V.; Wu, X.; Adom, K.K.; Liu, R.H. Thermal processing enhances the nutritional value of tomatoes by increasing total antioxidant activity. J Agric Food Chem, 2002, 50, 3010-3014.
- Shahidi, F.; Chavan, U.D.; Naczk, M. and Amarowicz, R. Nutrient distribution and phenolic antioxidants in air-classified fractions of beach pea (Lathyrusmaritimus L.).Journal of Agricultural and Food Chemistry, 2001, 49, 926-933.
- Wettasinghe, M.; Shahidi, F. Scavenging of reactive-oxygen species and DPPH free radicals by extracts of borage and evening primrose meals. Food Chemistry, 2000, 70, 17-26.
- Kim, J.K.; Kim, E.H.; Lee, O.K.; Park, S.Y.; Lee, B.; Kim, S.H.; Park, I. and Chang, I.M. Variation and correlation analysis of phenolic compounds in mungbean (Vignaradiata L.) varieties. Food Chemistry, 2013, 141, 2988-2997.
- Zhishen, J.; Mengcheng, T. and Jianming, W. Determination of flavonoid contents in mulberry and their scavenging effects on superoxide radicals.Food Chemistry, 1999, 64, 555- 559.
- Hatano, T., Kagawa, H., Yasahara, T. and Okuda, T. Two new flavonoids and other constitnents in licorice root: Their relative astringency and radical scavenging effects. Chem. Pharm. Bull., 1988, 36, 2090–2097.
- Nithiyanantham, S.; Selvakumar, S. and Siddhuraju, P. Total phenolic content and antioxidant activity of two different solvent extracts from raw and processed legumes, CicerarietinumL. and Pisumsativum L. Journal of Food Composition and Analysis, 2012, 27(1), 52-60.
- Kikuzaki, H.; Nakatani, N. Antioxidant effects of some ginger constituents.Journal of Food Sciences 1993, 58, 1407-1410.
- Jayaprakash, G.K.; Singh, R.P. and Sakariah, K.K. Antioxidant activity of grape seed extracts on peroxidation models in vitro. Journal of Agricultural and Food Chemistry, 2001, 55, 1018-1022.
- Hasmida, M.N.; Nursyukriah, A.R.; Liza, M.S. and Mohd, Azizi, C.Y. Effect of different extraction techniques on total phenolic content and antioxidant activity of Quercusinfectoria galls. International Food Research Journal, 2014, 21(3), 1075-1079.
- Xu, B.J., and Chang, S.K.C.Effect of soaking, boiling, and steaming on total phenolic content and antioxidant activities of cool season food legumes. Food Chemistry, 2008, 110(1), 1-13.
- Shahidi, F. Food phenolics and their role in antioxidation and health promotion. In: Polyphenols communications , 2002, 1, 257–258.
- Troszynska, A.; Bednarska, A.; Latosz, A.; Kozlowska, H. Polyphenolic compounds in the seed coat of legume seeds.Polish Journal of Food Nutrition Science, 1947, 6, 37-45.
- Lopez-Amoros, M.L.; Hernrndez, T.; Estrella, I. Effect of germination on legume phenolic compounds and their antioxidant activity.Journal of Food Composition and Analysis, 2006, 19, 277-283.
- Hwang, I.G.; Shin, Y.J.; Lee, S.; Lee, J.;Yoo, S.M. Effects of different cooking methods on the antioxidant properties of red pepper (Capsicum annuumL.). Prev. Nutr. Food Sci., 2012, 17, 286–292.
- Zhuang, Y.; Chen, L.; Sun, L.; Cao, J. Bioactive characteristics and antioxidant activities of nine peppers.J. Funct. Foods.,2012, 4, 331–338.
- Marathe, S.A.; Rajalakshmi, V.; Jamdar, S.N.; Sharma, A. Comparative study on antioxidant activity of different varieties of commonly consumed legumes in India.Food and Chemical Toxicology, 2011, 49(9), 2005-2012.
- Oomah, B., Dave, C.F., Malcolmson, J., Linda, B.; Anne, S. Phenolics and antioxidant activity of lentil and pea hulls.Food Research International, 2011, 44, 436-441.
- Sharma, S.; Yadav, N.; Singh, A.; Kumar, R.Antioxidant activity, nuetraceutical profile and health relevant functionality of nine newly developed chickpea cultivars (CicerarietinumL.).International Journal of Natural Products Research, 2013, 3(2), 44-53.
- Ladjal, Ettoumi, Y.; Chibane, M.Some physicochemical and functional properties of pea, chickpea and lentil whole flours.International Food Research Journal, 2015, 22(3), 987-996.
- Duenas, M.; Hernandez, T.; Esbella I. Assessment of in-vitro antioxidant capacity of seed coat and the cotyledon of legumes in relation to their phenolic contents.Food Chemistry, 2006, 98, 95-103.
- Arora, A.; Nair, M., G.; Strasburg, G., M. Structure-activity relationships for antioxidant activities of a series of flavonoids in a liposomal system.Free Radical Biol. Med., 1998, 24, 1355-1363.
- Moran, J.F.; Klucas, R.V.; Grayer, R.J.; Abian, J.; Becana, M. Complexes of iron with phenolic compounds from soybean nodules and other legume tissues: prooxidant and antioxidant properties. Free Radical Biol. Med., 1997, 22(5), 861-870.
- Lein, E.J.; Ren, S., Bui, H.H.; Wang, R. Quantitative structure activity relationship analysis of phenolic antioxidants.Free Radical Biol. Med., 1999, 26, 285-294.
- Sancho, L. E. G. G.; Yahia, E. M.; González-Aguilar, G. A. Contribution of major hydrophilic and lipophilic antioxidants from papaya fruit to total antioxidant capacity. Food and Nutrition Sciences, 2013, 4, 93-100.
- Yao, Y.; Sang, W.; Zhou, M.; Ren, G.X. Phenolic composition and antioxidant activities of eleven celery cultivars. Journal of Food Science, 2010, 75, C9-C13.
- Mubarak, A. E. Nutritional composition and antinutritional factors of mung bean seeds (Phaseolusaureus) as affected by some home traditional processes.Food Chemistry, 2005, 89, 489–495.

This work is licensed under a Creative Commons Attribution 4.0 International License.
![]()
A New Edition of Web of Science
Journal Impact Factor
2022: 0.5
Five Year: 0.8
Journal is Indexed in

Cabells Whitelist
![]()


