Optimisation of Arsenic (III) by Colorimetric Incorporated with Image Processing Technique
Jin Hoong Leong1, Keat Khim Ong2*, Wan Yunus Wan Md Zin3, Fitrianto Anwar4, Ummul Fahri Abdul Rauf2, Chin Chuang Teoh5, Hussin Abdul Ghapor3 and Mohd Junaedy Osman2
1Faculty of Engineering, Universiti Pertahanan Nasional Malaysia, Kem Sungai Besi, 57000 Kuala Lumpur, Malaysia.
2,3Centre for Defence Foundation Studies, Universiti Pertahanan Nasional Malaysia, Kem Sungai Besi, 57000 Kuala Lumpur, Malaysia.
4Faculty of Science, Universiti Putra Malaysia, 43400 UPM Serdang, Selangor, Malaysia.
5Malaysian Agricultural Research and Development Institute Headquarter, G. P.O. Box 12301, 50774 Kuala Lumpur, Malaysia.
Corresponding Author E-mail: ongkhim@upnm.edu.my
DOI : http://dx.doi.org/10.13005/ojc/320512
Inorganic arsenic contamination has caused a remarkable impact on the contamination of soil and groundwater in many counties. Consequently, determination of inorganic arsenic on site is very crucial especially arsenic (III) which is more toxic than arsenic (V). Thus, a more rapid, simple and ecofriendly approach was developed in this study to determine arsenic (III) by incorporation of image processing technique into colorimetric method. The effects of various factors were evaluated by a 24 full factorial design with a blocking factor. The mass ratio of sulfamic acid to zinc powder was the most significant factor affected red, green and blue (RGB) color values and followed by reaction period. The optimum conditions for the detection were found to be using 1 g of sulfamic acid and 0.5 g of zinc powder at 5 minutes. This work also demonstrates that the developed method is able to detect arsenic (III) rapidly and easily.
KEYWORDS:Arsenic (III); Colorimetric; Factorial design analysis; Image Processing; Optimisation
Download this article as:| Copy the following to cite this article: Leong J. H, Ong K. K, Zin W. Y. W. M, Anwar F, Rauf U. F. A, Teoh C. C, Ghapor H. A, Osman M. J. Optimisation of Arsenic (III) by Colorimetric Incorporated with Image Processing Technique. Orient J Chem 2016;32(5). |
| Copy the following to cite this URL: Leong J. H, Ong K. K, Zin W. Y. W. M, Anwar F, Rauf U. F. A, Teoh C. C, Ghapor H. A, Osman M. J. Optimisation of Arsenic (III) by Colorimetric Incorporated with Image Processing Technique. Orient J Chem 2016;32(5). Available from: http://www.orientjchem.org/?p=22309 |
Introduction
Inorganic arsenic contamination has caused a remarkable impact on the contamination of soil and groundwater in many countries of the world1. Arsenic occurs in nature water in various forms of inorganic and organic2 and mainly found in two inorganic forms i.e. As3+ and As5+, whereby As (III) is more toxic than As (V)3. According to Shen et. al (2013)4, As (III) is able to bind to a specific protein which could alter the protein’s conformation, leading to a deterioration in cellular functions. In addition, based on the report by Bednar et al. (2004)5 determination of each inorganic arsenic species is crucial due to the extensive variation in the toxicology, mobility, and absorptivity of each species.
Although laboratory analysis provides a highly accuracy and precision technique to measure arsenic in water samples, however due to time and cost constraints. Various test kit have been developed based on colorimetric method, but the results is normally based on comparison of the color formed on the test strip with a reference color scale which is rather subjective and operator-dependent. Thus there is a need for improvement for in-situ analysis of arsenic. According to Wang et al. (2011)6, an ideal field deployable sensor would be able to detect low µg/L concentration of analyte directly on-site with little or no sample preparation as well as persistence to interference ions. In fact, colorimetric methods can provide results nearly as accurate and reliable as those from analytical laboratories when the reaction is automatically evaluated by means of a color detector7. An electronic device for measuring color has been introduced to minimize human error in interpreting the color with naked eyes for determination of arsenic. For example, Anderson et al. (2008)8 measured reflectance of the developed color spot and convert it to digital signal by an electronic transducer which requires 30 to 40 minutes to detect of arsenic.
Thus, a more rapid, simple and ecofriendly approach was developed in this study to determine arsenic (III) by incorporation of image processing technique into colorimetric method. The effects of different factors were investigated by a 24 full factorial design with a blocking factor. The effects consists of weight load used for drying silver nitrate-impregnated filter paper, drying period of silver nitrate-impregnated filter paper, mass ratio of sulfamic acid to zinc powder and reaction period between arsine gas generated and silver nitrate which were evaluated at two levels to determine the significant factors before optimize the detection of arsenic (III).
Materials and Methods
Reagents and Materials
Arsenic (III) stock solution containing 1,000 mg As (III)/L (Merck, Germany) was used to prepare As (III) working standard solutions. Sulfamic acid, silver nitrate and zinc powder were also obtained from Merck (Germany). All the chemicals used in this study were of analytical grade.
Preparation of As (III) working standard solutions
As (III) working standard solutions containing 0 to 300 µg/L of As (III) were freshly prepared from the As (III) stock solution by proper dilutions using ultrapure water.
Preparation of 5% (w/v) silver nitrate solution
A 5% solution of silver nitrate was prepared by dissolving the silver nitrate using ultrapure water in a 100 mL volumetric flask.
Preparation of silver nitrate-impregnated filter paper
Whatman filter paper No.3 was cut into a 2.5 cm (diameter) round-shaped piece of the paper. It was then dipped into the silver nitrate solution for period of 2 seconds and followed by drying it between two pieces of dry Whatman filter papers which was pressed using a 100 or 500 g load for 20 or 60 seconds. This silver nitrate-impregnated filter paper was used as arsine sensor paper.
Colored complex formation
Minitab software (version 17.0) (USA) was utilized to randomize the ninety-six experimental runs with all possible combinations of factors in duplicates at high and low levels to investigate the effect of weight load (100 or 500 g) used for drying silver nitrate-impregnated filter paper (DW), drying period of silver nitrate-impregnated filter paper (DP) (20 or 60 s), mass ratio of sulfamic acid to zinc powder (MSZ) (1.0 g: 0.5 g or 4.0 g: 2.0 g), and reaction period (RP) (5 or 10 minutes).
Table 1: Low and High Levels of Factors
|
Factor |
Low level (-1) |
High level (+1) |
|
Weight load used for drying silver nitrate-impregnated filter paper (DW)(X1), g |
100 |
500 |
|
Reaction period (RP)(X4), min. |
5 |
10 |
|
Mass ratio sulfamic acid to zinc powder (MSZ)(X3) |
1:0.5 |
4:2 |
|
Drying period of silver nitrate-impregnated filter paper (DP)(X2), s |
20 |
60 |
A 60 mL of polypropylene bottle was filled with 50 mL of arsenic (III) working standard solution. To the solution, desired amount of sulfamic acid was added and swirled before adding zinc powder and swirled again to ensure homogeneity of the mixture. The arsine sensor paper was then inserted inside the cap of the bottle before close the bottle with cap. The bottle was swirled gently before stand for the selected reaction period. Each experiment was performed in duplicates at 25 ºC and at the levels as presented in Table 1. As soon as the reaction period was over, the colored arsine sensor paper was removed from the cap and used for image analysis.
Color image processing
For each colored arsine sensor paper, two images were captured by a digital camera (Sony Cyber-shot, DSC-W610) at the distance of 15 cm. All conditions including distance, lighting conditions (automatic mode) and camera setting were kept constant for all experiments. The color (red, green and blue) of the images were transformed into digital readings from 0 to 225 using Image J software and used for further statistical analysis.
Statistical Analysis
To determine significant factors, Analysis of Variance (ANOVA), Student’s t-analysis, correlation between response variables, linear regression analysis were carried out. Main and interaction effects plots were also formed for each color value. All these data analysis was performed using Minitab software (version 17.0) (USA). Besides that, normal probability and residual versus fitted value plots were also formed using the software.
Optimisation of detection
Optimisation plot was constructed to suggest the optimum conditions of arsenic (III) detection using the Minitab software. Validation of the suggested optimum conditions was performed by conducting the detection experiments at the suggested conditions in 5 replications. The experiments was carried out similar to the procedure as mentioned in the section of Colored complex formation at the suggested optimum conditions.
Data Analysis
To determine the significant factors that affect the detection of arsenic (III), all data analysis including linear regression analysis, Analysis of Variance (ANOVA), Student’s t-analysis and correlation between response variables were implemented using the Minitab software version 17.0 (Minitab Inc., PA, USA). Main effects plot was also developed for each color value for significant contribution factors.
Results and Discussion
Colorimetric method used in this work was based on modification of the methods developed by Cherukuri and Anjaneyulu (2005)9 and later by Ong et al. (2015)10.
Table 2: Experimental results for detection of arsenic (III)
|
DW (g) |
DP (s) |
MSZ |
RP (min) |
Arsenic (III) Concentration (µg/L) |
Color value |
Std Order |
Run Order |
Center Pt |
||
|
Red |
Green |
Blue |
||||||||
|
100 |
20 |
1 |
5 |
0 |
134.929 |
153.018 |
147.315 |
1 |
1 |
1 |
|
100 |
20 |
1 |
5 |
10 |
133.998 |
151.394 |
145.087 |
2 |
2 |
1 |
|
100 |
20 |
1 |
5 |
50 |
132.183 |
149.634 |
141.730 |
3 |
3 |
1 |
|
100 |
20 |
1 |
5 |
100 |
114.965 |
117.107 |
83.968 |
4 |
4 |
1 |
|
100 |
20 |
1 |
5 |
200 |
81.996 |
75.166 |
37.681 |
5 |
5 |
1 |
|
100 |
20 |
1 |
5 |
300 |
69.744 |
60.594 |
29.444 |
6 |
6 |
1 |
|
100 |
20 |
4 |
5 |
0 |
130.952 |
149.481 |
141.914 |
7 |
7 |
1 |
|
100 |
20 |
4 |
5 |
10 |
129.994 |
148.549 |
139.079 |
8 |
8 |
1 |
|
100 |
20 |
4 |
5 |
50 |
128.233 |
142.955 |
119.901 |
9 |
9 |
1 |
|
100 |
20 |
4 |
5 |
100 |
109.984 |
107.052 |
54.206 |
10 |
10 |
1 |
|
100 |
20 |
4 |
5 |
200 |
76.035 |
66.674 |
39.770 |
11 |
11 |
1 |
|
100 |
20 |
4 |
5 |
300 |
62.758 |
54.816 |
25.165 |
12 |
12 |
1 |
|
100 |
20 |
1 |
10 |
0 |
127.595 |
146.614 |
140.348 |
13 |
13 |
1 |
|
100 |
20 |
1 |
10 |
10 |
126.131 |
143.815 |
136.440 |
14 |
14 |
1 |
|
100 |
20 |
1 |
10 |
50 |
124.349 |
139.430 |
125.608 |
15 |
15 |
1 |
|
100 |
20 |
1 |
10 |
100 |
94.167 |
90.073 |
46.823 |
16 |
16 |
1 |
|
100 |
20 |
1 |
10 |
200 |
66.920 |
57.250 |
27.520 |
17 |
17 |
1 |
|
100 |
20 |
1 |
10 |
300 |
55.009 |
47.087 |
26.081 |
18 |
18 |
1 |
|
100 |
20 |
4 |
10 |
0 |
127.838 |
145.430 |
139.492 |
19 |
19 |
1 |
|
100 |
20 |
4 |
10 |
10 |
124.303 |
140.702 |
130.960 |
20 |
20 |
1 |
|
100 |
20 |
4 |
10 |
50 |
116.619 |
127.183 |
88.124 |
21 |
21 |
1 |
|
100 |
20 |
4 |
10 |
100 |
81.522 |
79.398 |
31.002 |
22 |
22 |
1 |
|
100 |
20 |
4 |
10 |
200 |
63.480 |
56.726 |
23.869 |
23 |
23 |
1 |
|
100 |
20 |
4 |
10 |
300 |
45.391 |
43.210 |
22.024 |
24 |
24 |
1 |
|
100 |
60 |
1 |
5 |
0 |
136.792 |
153.882 |
147.563 |
25 |
25 |
1 |
|
100 |
60 |
1 |
5 |
10 |
132.738 |
149.684 |
140.869 |
26 |
26 |
1 |
|
100 |
60 |
1 |
5 |
50 |
129.333 |
142.622 |
127.591 |
27 |
27 |
1 |
|
100 |
60 |
1 |
5 |
100 |
120.250 |
130.602 |
104.074 |
28 |
28 |
1 |
|
100 |
60 |
1 |
5 |
200 |
112.361 |
111.685 |
71.303 |
29 |
29 |
1 |
|
100 |
60 |
1 |
5 |
300 |
106.105 |
100.668 |
51.942 |
30 |
30 |
1 |
|
100 |
60 |
4 |
5 |
0 |
127.069 |
144.288 |
133.833 |
31 |
31 |
1 |
|
100 |
60 |
4 |
5 |
10 |
126.768 |
143.310 |
131.752 |
32 |
32 |
1 |
|
100 |
60 |
4 |
5 |
50 |
128.274 |
144.533 |
127.201 |
33 |
33 |
1 |
|
100 |
60 |
4 |
5 |
100 |
111.125 |
115.634 |
66.637 |
34 |
34 |
1 |
|
100 |
60 |
4 |
5 |
200 |
92.451 |
81.186 |
44.570 |
35 |
35 |
1 |
|
100 |
60 |
4 |
5 |
300 |
71.154 |
59.406 |
30.447 |
36 |
36 |
1 |
|
100 |
60 |
1 |
10 |
0 |
133.098 |
152.654 |
148.877 |
37 |
37 |
1 |
|
100 |
60 |
1 |
10 |
10 |
126.638 |
145.583 |
142.822 |
38 |
38 |
1 |
|
100 |
60 |
1 |
10 |
50 |
112.648 |
129.302 |
127.987 |
39 |
39 |
1 |
|
100 |
60 |
1 |
10 |
100 |
95.679 |
89.897 |
45.293 |
40 |
40 |
1 |
|
100 |
60 |
1 |
10 |
200 |
63.582 |
55.871 |
24.001 |
41 |
41 |
1 |
|
100 |
60 |
1 |
10 |
300 |
49.367 |
42.740 |
22.007 |
42 |
42 |
1 |
|
100 |
60 |
4 |
10 |
0 |
122.400 |
139.719 |
133.587 |
43 |
43 |
1 |
|
100 |
60 |
4 |
10 |
10 |
127.090 |
143.890 |
135.080 |
44 |
44 |
1 |
|
100 |
60 |
4 |
10 |
50 |
121.196 |
130.382 |
89.783 |
45 |
45 |
1 |
|
100 |
60 |
4 |
10 |
100 |
84.055 |
82.267 |
28.763 |
46 |
46 |
1 |
|
100 |
60 |
4 |
10 |
200 |
68.112 |
62.123 |
21.130 |
47 |
47 |
1 |
|
100 |
60 |
4 |
10 |
300 |
54.150 |
47.651 |
21.993 |
48 |
48 |
1 |
|
500 |
60 |
1 |
10 |
0 |
136.793 |
155.491 |
152.644 |
49 |
49 |
1 |
|
500 |
60 |
1 |
10 |
10 |
131.622 |
149.281 |
146.564 |
50 |
50 |
1 |
|
500 |
60 |
1 |
10 |
50 |
135.405 |
151.637 |
146.537 |
51 |
51 |
1 |
|
500 |
60 |
1 |
10 |
100 |
114.595 |
121.003 |
93.401 |
52 |
52 |
1 |
|
500 |
60 |
1 |
10 |
200 |
104.155 |
98.945 |
52.794 |
53 |
53 |
1 |
|
500 |
60 |
1 |
10 |
300 |
94.655 |
86.561 |
43.278 |
54 |
54 |
1 |
|
500 |
60 |
1 |
5 |
0 |
133.138 |
149.563 |
141.373 |
55 |
55 |
1 |
|
500 |
60 |
1 |
5 |
10 |
132.178 |
148.875 |
140.904 |
56 |
56 |
1 |
|
500 |
60 |
1 |
5 |
50 |
125.615 |
139.866 |
117.701 |
57 |
57 |
1 |
|
500 |
60 |
1 |
5 |
100 |
113.730 |
115.078 |
64.876 |
58 |
58 |
1 |
|
500 |
60 |
1 |
5 |
200 |
101.051 |
94.947 |
39.514 |
59 |
59 |
1 |
|
500 |
60 |
1 |
5 |
300 |
83.001 |
73.410 |
26.479 |
60 |
60 |
1 |
|
500 |
20 |
1 |
5 |
0 |
128.106 |
145.621 |
139.839 |
61 |
61 |
1 |
|
500 |
20 |
1 |
5 |
10 |
130.079 |
147.265 |
140.111 |
62 |
62 |
1 |
|
500 |
20 |
1 |
5 |
50 |
130.201 |
145.643 |
129.774 |
63 |
63 |
1 |
|
500 |
20 |
1 |
5 |
100 |
102.316 |
102.132 |
63.249 |
64 |
64 |
1 |
|
500 |
20 |
1 |
5 |
200 |
70.654 |
61.166 |
29.168 |
65 |
65 |
1 |
|
500 |
20 |
1 |
5 |
300 |
59.520 |
50.683 |
24.021 |
66 |
66 |
1 |
|
500 |
20 |
4 |
5 |
0 |
131.697 |
150.428 |
147.854 |
67 |
67 |
1 |
|
500 |
20 |
4 |
5 |
10 |
125.379 |
141.680 |
131.462 |
68 |
68 |
1 |
|
500 |
20 |
4 |
5 |
50 |
96.648 |
106.171 |
70.494 |
69 |
69 |
1 |
|
500 |
20 |
4 |
5 |
100 |
76.423 |
71.536 |
25.635 |
70 |
70 |
1 |
|
500 |
20 |
4 |
5 |
200 |
49.939 |
45.328 |
22.642 |
71 |
71 |
1 |
|
500 |
20 |
4 |
5 |
300 |
46.059 |
42.446 |
25.182 |
72 |
72 |
1 |
|
500 |
20 |
1 |
10 |
0 |
130.418 |
148.622 |
145.224 |
73 |
73 |
1 |
|
500 |
20 |
1 |
10 |
10 |
131.638 |
148.659 |
144.986 |
74 |
74 |
1 |
|
500 |
20 |
1 |
10 |
50 |
126.705 |
143.390 |
138.145 |
75 |
75 |
1 |
|
500 |
20 |
1 |
10 |
100 |
119.817 |
124.719 |
91.182 |
76 |
76 |
1 |
|
500 |
20 |
1 |
10 |
200 |
90.857 |
88.574 |
55.037 |
77 |
77 |
1 |
|
500 |
20 |
1 |
10 |
300 |
78.105 |
70.236 |
32.173 |
78 |
78 |
1 |
|
500 |
20 |
4 |
10 |
0 |
128.167 |
144.262 |
137.551 |
79 |
79 |
1 |
|
500 |
20 |
4 |
10 |
10 |
129.817 |
146.586 |
140.104 |
80 |
80 |
1 |
|
500 |
20 |
4 |
10 |
50 |
123.058 |
136.867 |
119.304 |
81 |
81 |
1 |
|
500 |
20 |
4 |
10 |
100 |
114.697 |
115.249 |
65.165 |
82 |
82 |
1 |
|
500 |
20 |
4 |
10 |
200 |
89.996 |
81.248 |
30.444 |
83 |
83 |
1 |
|
500 |
20 |
4 |
10 |
300 |
72.356 |
60.805 |
23.572 |
84 |
84 |
1 |
|
500 |
60 |
4 |
5 |
0 |
135.358 |
153.436 |
148.180 |
85 |
85 |
1 |
|
500 |
60 |
4 |
5 |
10 |
131.337 |
149.016 |
143.035 |
86 |
86 |
1 |
|
500 |
60 |
4 |
5 |
50 |
127.215 |
142.622 |
128.297 |
87 |
87 |
1 |
|
500 |
60 |
4 |
5 |
100 |
109.072 |
108.769 |
62.776 |
88 |
88 |
1 |
|
500 |
60 |
4 |
5 |
200 |
82.429 |
69.917 |
27.049 |
89 |
89 |
1 |
|
500 |
60 |
4 |
5 |
300 |
56.139 |
48.689 |
21.712 |
90 |
90 |
1 |
|
500 |
60 |
4 |
10 |
0 |
132.673 |
150.651 |
143.491 |
91 |
91 |
1 |
|
500 |
60 |
4 |
10 |
10 |
116.933 |
131.173 |
112.984 |
92 |
92 |
1 |
|
500 |
60 |
4 |
10 |
50 |
121.582 |
124.256 |
70.959 |
93 |
93 |
1 |
|
500 |
60 |
4 |
10 |
100 |
83.550 |
74.764 |
26.496 |
94 |
94 |
1 |
|
500 |
60 |
4 |
10 |
200 |
66.479 |
55.596 |
19.859 |
95 |
95 |
1 |
|
500 |
60 |
4 |
10 |
300 |
47.531 |
41.547 |
21.623 |
96 |
96 |
1 |
Red, green and blue (RGB) color values are the responses in this work which produced by a change in the level of a factor. The regression analysis of red, green and blue color values are displayed in Table 3, 4 and 5, respectively. The results revealed that the main effects of mass ratio of sulfamic acid to zinc powder (MSZ) and reaction period (RP) were significant at a 5% of probability level (p < 0.05) for all color values. However, for interaction effect, drying weight-drying period of silver nitrate-impregnated filter-paper-reaction period (DW x DP x RP) interaction and drying weight-mass ratio of sulfamic acid to zinc powder -reaction period (DW x MSZ x RP) interaction were significant at a 5% of probability level (p < 0.05) for red and green. However, such interaction effects do not exist in blue color.
Table 3: Statistical Parameters for 24 full factorial design of red color value
|
Term |
Effects |
Coefficients |
Standard Error |
T-value |
P-value |
|
Constant |
– |
103.04 |
1.21 |
122.11 |
0.000 |
|
DW |
1.820 |
0.910 |
0.862 |
1.06 |
0.295 |
|
DP |
1.798 |
0.899 |
0.862 |
1.04 |
0.301 |
|
MSZ |
-7.607 |
-3.803 |
0.862 |
-4.41 |
0.000 |
|
RP |
-16.106 |
-8.053 |
0.862 |
-9.34 |
0.000 |
|
DW x DP |
-2.091 |
-1.046 |
0.862 |
-1.21 |
0.229 |
|
DW x MSZ |
0.232 |
0.116 |
0.862 |
-0.80 |
0.429 |
|
DW x RP |
0.096 |
0.048 |
0.862 |
0.06 |
0.956 |
|
DP x MSZ |
0.232 |
0.116 |
0.862 |
-0.80 |
0.429 |
|
DP x RP |
1.034 |
0.517 |
0.862 |
0.60 |
0.551 |
|
MSZ x RP |
-1.000 |
-0.500 |
0.862 |
-0.58 |
0.564 |
|
DW x DP x MSZ |
1.060 |
0.530 |
0.862 |
0.61 |
0.541 |
|
DW x DP x RP |
4.532 |
2.266 |
0.862 |
2.63 |
0.010 |
|
DW x MSZ x RP |
-3.982 |
-1.991 |
0.862 |
-2.31 |
0.024 |
|
DP x MSZ x RP |
1.974 |
0.987 |
0.862 |
1.14 |
0.256 |
|
DW x DP x MSZ x RP |
-1.438 |
-0.719 |
0.862 |
-0.83 |
0.407 |
Table 4: Statistical Parameters for 24 full factorial design of green color value
|
Term |
Effects |
Coefficients |
Standard Error |
T-value |
P-value |
|
Constant |
– |
110.910 |
0.950 |
116.73 |
0.000 |
|
DW |
1.281 |
0.640 |
0.950 |
0.67 |
0.502 |
|
DP |
1.482 |
0.741 |
0.950 |
0.78 |
0.438 |
|
MSZ |
-9.366 |
-4.683 |
0.950 |
-4.93 |
0.000 |
|
RP |
-17.673 |
-8.836 |
0.950 |
-9.30 |
0.000 |
|
DW x DP |
-2.944 |
-1.472 |
0.950 |
-1.55 |
0.125 |
|
DW x MSZ |
-1.874 |
-0.937 |
0.950 |
-0.99 |
0.327 |
|
DW x RP |
-0.383 |
-0.192 |
0.950 |
-0.20 |
0.841 |
|
DP x MSZ |
-0.820 |
-0.410 |
0.950 |
-0.43 |
0.668 |
|
DP x RP |
0.414 |
0.207 |
0.950 |
0.22 |
0.828 |
|
MSZ x RP |
-0.260 |
-0.130 |
0.950 |
-0.14 |
0.892 |
|
DW x DP x MSZ |
0.922 |
0.461 |
0.950 |
0.49 |
0.629 |
|
DW x DP x RP |
4.410 |
2.205 |
0.950 |
2.32 |
0.023 |
|
DW x MSZ x RP |
-4.283 |
-2.141 |
0.950 |
-2.25 |
0.027 |
|
DP x MSZ x RP |
1.739 |
0.869 |
0.950 |
0.92 |
0.363 |
|
DW x DP x MSZ x RP |
-1.803 |
-0.902 |
0.950 |
-0.95 |
0.346 |
Table 5: Statistical Parameters for 24 full factorial design of blue color value
|
Term |
Effects |
Coefficients |
Standard Error |
T-value |
P-value |
|
Constant |
86.74 |
1.18 |
73.81 |
0.000 |
|
|
DW |
0.05 |
0.02 |
1.18 |
0.02 |
0.985 |
|
DP |
0.20 |
0.10 |
1.18 |
0.08 |
0.934 |
|
MSZ |
-15.74 |
-7.87 |
1.18 |
-6.70 |
0.000 |
|
RP |
-17.01 |
-8.51 |
1.18 |
-7.24 |
0.000 |
|
DW x DP |
-2.95 |
-1.48 |
1.18 |
-1.26 |
0.213 |
|
DW x MSZ |
-2.32 |
-1.16 |
1.18 |
-0.99 |
0.327 |
|
DW x RP |
-0.20 |
-0.10 |
1.18 |
-0.09 |
0.932 |
|
DP x MSZ |
-1.58 |
-0.79 |
1.18 |
-0.67 |
0.503 |
|
DP x RP |
-1.03 |
-0.51 |
1.18 |
-0.44 |
0.664 |
|
MSZ x RP |
-0.36 |
-0.18 |
1.18 |
-0.15 |
0.877 |
|
DW x DP x MSZ |
0.79 |
0.40 |
1.18 |
0.34 |
0.737 |
|
DW x DP x RP |
1.87 |
0.93 |
1.18 |
0.80 |
0.429 |
|
DW x MSZ x RP |
-1.45 |
-0.73 |
1.18 |
-0.62 |
0.539 |
|
DP x MSZ x RP |
-0.34 |
-0.17 |
1.18 |
-0.14 |
0.887 |
|
DW x DP x MSZ x RP |
-1.60 |
-0.80 |
1.18 |
-0.68 |
0.498 |
Equations 1, 2 and 3 indicate the models that relate the levels of parameter and red, green and blue color values, respectively.
Red color value
103.04 + 0.910X1 + 0.899X2 -3.803X3 -8.053X4 – 1.046X1X2 + 0.116X1X3 + 0.048X1X4 +0.116X2X3 + 0.517X2X4-0.500X3X4 + 0.530X1X2X3 + 2.266X1X2X4 -1.991X1X3X4 + 0.987X2X3X4 -0.719 X1X2X3X4 (1)
Green color value
110.910 +0.640X1 + 0.741X2 -4.683X3 -8.836X4 – 1.472X1X2 – 0.937X1X3 -0.192X1X4 – 0.140X2X3 + 0.207X2X4 -0.130 X3X4 + 0.461X1X2X3 + 2.205X1X2X4 -2.141X1X3X4 +0.869 X2X3X4 -0.902 X1X2X3X4 (2)
Blue color value
86.74 + 0.02X1 + 0.10X2 -7.87X3 -8.51X4 – 1.48X1X2 – 1.16X1X3 -0.10X1X4 – 0.79X2X3– 0.51X2X4-0.18X3X4 + 0.40X1X2X3 + 0.93X1X2X4 -0.73X1X3X4 -0.17X2X3X4 -0.80X1X2X3X4 (3)
A factor that positively significant can be seen from the color value decreases as the change from low to high level or vice versa, while if the colors are red, green and blue formed a high level of the same factors, it is negative effect. Figures 1, 2 and 3 illustrate the main effects of the factors for red, green and blue color values.
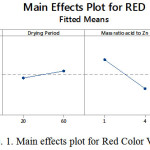 |
Figure 1: Main effects plot for Red Color Value
|
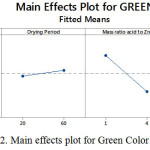 |
Figure 2: Main effects plot for Green Color Value
|
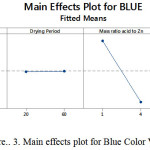 |
Figure 3: Main effects plot for Blue Color Value
|
Tables 6, 7 and 8 show the results of Analysis of Variance for three response colors, respectively. The sum of squares used to estimate the factors’ effects and F-ratios are also presented in the tables. The results revealed that the main effects of MSZ and RP are highly significant (at 5% level of significance). However, the MSZ and RP interaction are not significant and most of the interaction effects are insignificant as compared to other effects accepts for DW x DP x RP and DW x MSZ x RP. Therefore, recalculation of regression coefficients, standard error, t and p-values were conducted and the results are shown in Tables 9, 10 and 11 for red, green and blue color values, respectively.
In equations 4, 5 and 6, respectively, shows a reduced model equation with resultant coefficients for red, green and blue color values.
Red color value = 103.04 -3.803X3 -8.053X4 + 2.266X1X2X4 -1.991X1X3X4 (4)
Green color value = 110.910 – 4.683X3 -8.836X4 + 2.205X1X2X4 -2.141X1X3X4 (5)
Blue color value = 86.74 -7.87X3 -8.51X4 (6)
Table 6: Analysis of Variance (ANOVA) for red color value
|
Term |
Degrees of Freedom |
Sum of Squares (SS) |
Mean Square (MS) |
F-value |
P-value |
|
BLOCKS |
6 |
– |
– |
– |
– |
|
DW |
1 |
79.5 |
79.5 |
1.11 |
0.295 |
|
DP |
1 |
77.6 |
77.6 |
1.09 |
0.301 |
|
MSZ |
1 |
1388.6 |
1388.6 |
19.45 |
0.000 |
|
RP |
1 |
6226.0 |
6226.0 |
87.18 |
0.000 |
|
DW x DP |
1 |
104.9 |
104.9 |
1.47 |
0.229 |
|
DW x MSZ |
1 |
45.2 |
45.2 |
0.63 |
0.429 |
|
DW x RP |
1 |
0.2 |
0.2 |
0.00 |
0.956 |
|
DP x MSZ |
1 |
1.3 |
1.3 |
0.02 |
0.894 |
|
DP x RP |
1 |
25.7 |
25.7 |
0.36 |
0.551 |
|
MSZ x RP |
1 |
24.0 |
24.0 |
0.34 |
0.564 |
|
DW x DP x MSZ |
1 |
26.9 |
26.9 |
0.38 |
0.541 |
|
DW x DP x RP |
1 |
492.9 |
492.9 |
6.90 |
0.010 |
|
DW x MSZ x RP |
1 |
380.5 |
380.5 |
5.33 |
0.024 |
|
DP x MSZ x RP |
1 |
93.5 |
93.5 |
1.31 |
0.256 |
|
DW x DT x MSZ x RP |
1 |
49.6 |
49.6 |
0.69 |
0.407 |
|
Error |
75 |
5355.9 |
71.4 |
– |
– |
|
Total |
96 |
74467.4 |
– |
– |
– |
S = 8.45055 R-sq = 92.81% R-sq(adj) = 90.89%
Table 7: Analysis of Variance (ANOVA) for green color value
|
Term |
Degrees of Freedom |
Sum of Squares (SS) |
Mean Square (MS) |
F-value |
P-value |
|
BLOCKS |
6 |
– |
– |
– |
– |
|
DW |
1 |
39 |
39.4 |
0.45 |
0.502 |
|
DP |
1 |
53 |
52.7 |
0.61 |
0.438 |
|
MSZ |
1 |
2105 |
2105.2 |
24.29 |
0.000 |
|
RP |
1 |
7496 |
7495.7 |
86.49 |
0.000 |
|
DW x DP |
1 |
208 |
208.1 |
2.40 |
0.125 |
|
DW x MSZ |
1 |
84 |
84.3 |
0.97 |
0.327 |
|
DW x RP |
1 |
4 |
3.5 |
0.04 |
0.841 |
|
DP x MSZ |
1 |
16 |
16.1 |
0.19 |
0.668 |
|
DP x RP |
1 |
4 |
4.1 |
0.05 |
0.828 |
|
MSZ x RP |
1 |
2 |
1.6 |
0.02 |
0.892 |
|
DW x DP x MSZ |
1 |
20 |
20.4 |
0.24 |
0.629 |
|
DW x DP x RP |
1 |
467 |
466.7 |
5.39 |
0.023 |
|
DW x MSZ x RP |
1 |
440 |
440.2 |
5.08 |
0.027 |
|
DP x MSZ x RP |
1 |
73 |
72.6 |
0.84 |
0.363 |
|
DW x DP x MSZ x RP |
1 |
78 |
78.0 |
0.90 |
0.346 |
|
Error |
75 |
6500 |
86.7 |
– |
– |
|
Total |
96 |
140097 |
– |
– |
– |
S = 9.30933 R-sq = 95.36% R-sq(adj) = 94.12%
Table 8: Analysis of Variance (ANOVA) for blue color value
|
Term |
Degrees of Freedom |
Sum of Squares (SS) |
Mean Square (MS) |
F-value |
P-value |
|
BLOCKS |
6 |
– |
– |
– |
– |
|
DW |
1 |
0 |
0.1 |
0.00 |
0.985 |
|
DP |
1 |
1 |
0.9 |
0.01 |
0.934 |
|
MSZ |
1 |
5947 |
5947.2 |
44.85 |
0.000 |
|
RP |
1 |
6944 |
6944.2 |
52.37 |
0.000 |
|
DW x DP |
1 |
209 |
209.2 |
1.58 |
0.213 |
|
DW x MSZ |
1 |
129 |
129.3 |
0.98 |
0.327 |
|
DW x RP |
1 |
1 |
1.0 |
0.01 |
0.932 |
|
DT x MSZ |
1 |
60 |
60.2 |
0.45 |
0.503 |
|
DT x RP |
1 |
25 |
25.3 |
0.19 |
0.664 |
|
MSZ x RP |
1 |
3 |
3.2 |
0.02 |
0.877 |
|
DW x DP x MSZ |
1 |
15 |
15.1 |
0.11 |
0.737 |
|
DW x DP x RP |
1 |
84 |
83.8 |
0.63 |
0.429 |
|
DW x MSZ x RP |
1 |
51 |
50.5 |
0.38 |
0.539 |
|
DP x MSZ x RP |
1 |
3 |
2.7 |
0.02 |
0.887 |
|
DW x DP x MSZ x RP |
1 |
62 |
61.6 |
0.46 |
0.498 |
|
Error |
75 |
9946 |
132.6 |
– |
– |
|
Total |
96 |
239449 |
– |
– |
– |
S = 11.5157 R-sq = 95.85% R-sq(adj) = 94.74%
Table 9: Statistical parameters for 24 full factorial design of red color value for reduced model
|
Term |
Effects |
Coefficients |
Standard Error |
T-value |
P-value |
|
Constant |
– |
103.04 |
0.844 |
124.75 |
0.000 |
|
MSZ |
-7.607 |
-3.803 |
0.844 |
4.50 |
0.000 |
|
RP |
-16.106 |
-8.053 |
0.844 |
-9.54 |
0.000 |
|
DW x DP x RP |
4.532 |
2.266 |
0.844 |
2.68 |
0.009 |
|
DW x MSZ x RP |
-3.982 |
-1.991 |
0.844 |
-2.36 |
0.021 |
Table 10: Statistical parameters for 24 full factorial design of green color value for reduced
|
Term |
Effects |
Coefficients |
Standard Error |
T-value |
P-value |
|
Constant |
– |
110.910 |
0.926 |
119.76 |
0.000 |
|
MSZ |
-9.366 |
-4.683 |
0.926 |
-5.06 |
0.000 |
|
RP |
-17.673 |
-8.836 |
0.926 |
-9.54 |
0.000 |
|
DW x DP x RP |
4.410 |
2.205 |
0.926 |
2.38 |
0.019 |
|
DW x MSZ x RP |
-4.283 |
-2.141 |
0.926 |
-2.31 |
0.023 |
Table 11: Statistical parameters for 24 full factorial design of blue color value for reduced
|
Term |
Effects |
Coefficients |
Standard Error |
T-value |
P-value |
|
Constant |
86.74 |
1.12 |
77.48 |
0.000 |
|
|
MSZ |
-15.74 |
-7.87 |
1.12 |
-7.03 |
0.000 |
|
RP |
-17.01 |
-8.51 |
1.12 |
-7.60 |
0.000 |
Table 12, 13 and 14 illustrate the output following the removal of the insignificant main effects and interactions. The results of ANOVA for reduced models of red, green and blue color values are shown in Table 12, 13 and 14, respectively. From the results, we have sufficient evidence to conclude that reaction period (RP) was the strongest effect of the overall contributed to the three color intensities. The reduced model now contains only the main effects MSZ, RP and the DW x DP x RP and DW x MSZ x RP interactions. The X4 coefficient was found to be the largest negative coefficient for the three models (5), (6) and (7), showing that the longer the reaction period, three color values decreased accordingly. The mass ratio of sulfamic acid to zinc powder (MSZ) was the second important factor. Third and fourth significant factors which significantly contributed for red and green color values were drying weight-drying period of silver nitrate-impregnated filter-paper-reaction period (DW x DP x RP) interaction and drying weight-mass ratio of sulfamic acid to zinc powder -reaction period (DW x MSZ x RP) interaction, respectively.
Table 12: Analysis of Variance (ANOVA) of Red Color Value for reduced model
|
Term |
Degrees of Freedom |
Sum of Squares (SS) |
Mean Square (MS) |
F |
P |
|
BLOCKS |
6 |
– |
– |
– |
– |
|
MSZ |
1 |
1388.6 |
1388.6 |
20.29 |
0.000 |
|
RP |
1 |
6226.0 |
6226.0 |
90.99 |
0.000 |
|
DW x DP x RP |
1 |
492.9 |
492.9 |
7.20 |
0.009 |
|
DW x MSZ x RP |
1 |
380.5 |
380.5 |
5.56 |
0.021 |
|
Error |
87 |
5884.3 |
68.4 |
– |
– |
S = 8.27180 R-sq = 92.10% R-sq(adj) = 91.27%
Table 13: Analysis of Variance (ANOVA) of Green Color Value for reduced model
|
Term |
Degrees of Freedom |
Sum of Squares (SS) |
Mean Square (MS) |
F |
P |
|
BLOCKS |
6 |
– |
– |
– |
– |
|
MSZ |
1 |
2105 |
2105.2 |
25.57 |
0.000 |
|
RP |
1 |
7496 |
7495.7 |
91.04 |
0.000 |
|
DW x DP x RP |
1 |
467 |
466.7 |
5.67 |
0.019 |
|
DW x MSZ x RP |
1 |
440 |
440.2 |
5.35 |
0.023 |
|
Error |
87 |
7081 |
82.3 |
– |
– |
S = 9.07367 R-sq = 94.95% R-sq(adj) = 94.42%
Table 14: Analysis of Variance (ANOVA) of Blue Color Value for reduced model
|
Term |
Degrees of Freedom |
Sum of Squares (SS) |
Mean Square (MS) |
F |
P |
|
BLOCKS |
6 |
– |
– |
– |
– |
|
MSZ |
1 |
5947 |
5947.2 |
49.43 |
0.000 |
|
RP |
1 |
6944 |
6944.2 |
57.71 |
0.000 |
|
Error |
88 |
10589 |
120.3 |
– |
– |
|
Total |
96 |
239449 |
– |
– |
– |
|
BLOCKS |
6 |
– |
– |
– |
– |
S = 10.9693 R-sq = 95.58% R-sq(adj) = 95.23%
Figures 4, 5 and 6 present the interaction effects of red, green and blue color values, respectively. It is evident that, the effects of both MSZ and RP were more observable at high levels for all color as shown in the interaction plots of Figures 4, 5 and 6.
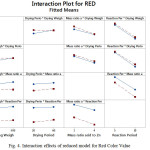 |
Figure 4: Interaction effects of reduced model for Red Color Value |
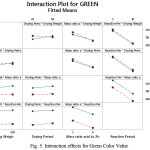 |
Figure 5: Interaction effects for Green Color Value
|
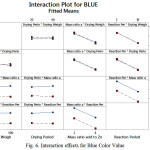 |
Figure 6: Interaction effects for Blue Color Value
|
Normal distribution plot
The estimate values for all response colors showed that the experimental data are normally distributed as the experimental points were reasonably aligned, as shown in Figures 7, 8 and 9 of the normal probability plots of residual values. The residual plots showed outliers are occurred (Fig. 10, 11 and 12). However, the results showed that there were no outlier between the ranges of +25 to -15 for red color value while the ranges for green and blue color values are between +25 to – 20 and +25 to -30 respectively.
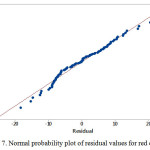 |
Figure 7: Normal probability plot of residual values for red color value
|
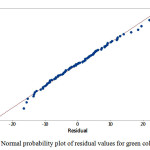 |
Figure 8: Normal probability plot of residual values for green color value |
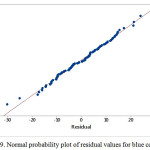 |
Figure 9: Normal probability plot of residual values for blue color value |
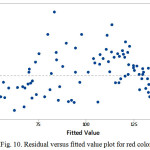 |
Figure 10: Residual versus fitted value plot for red color value
|
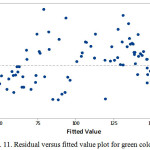 |
Figure 11: Residual versus fitted value plot for green color value
|
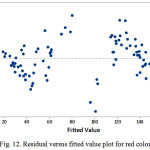 |
Figure 12: Residual versus fitted value plot for red color value
|
Main effect of reaction period
Figures 1 to 3 show that red, green and blue values decreased by 15.79%, 14.29% and 17.89%, respectively, when the reaction period increased from 5 minutes to 10 minutes. The results from Tables 9 to 11 also exhibited that the reaction period also plays a significant role on color values. This can be explained by the fact that more arsenic (III) is reduced to arsine gas which will react with silver ions and produce darker color compound on the impregnated filter paper when longer reaction period was used.
Main effect of mass ratio of sulfamic acid to zinc powder
As it can be seen from Figures 4 to 6, the mass ratio of sulfamic acid to zinc powder is the most significant factor as indicated by an increase in the mass ratio of sulfamic acid to zinc powder from 1 g: 0.5 g to 4 g: 2 g, caused decrease in the RGB values with the highest decrease in color values of 17.02%, 7.83%, 6.42%, for blue, green and red color values, respectively, as shown in Figures 1 to 3. This is due to the formation of darker color complex on the silver nitrate impregnated filter paper when higher mass ratio of sulfamic acid to zinc powder was applied which resulted in more production of arsine gas which reacts with silver nitrate on the impregnated filter paper. Thus, it can be said that the effect of mass ratio of sulfamic acid to zinc powder is negative in color values, but it is positive effect in detection of arsenic (III) as darker color has lower color value. Interaction effect of drying weight-drying period of silver nitrate-impregnated filter- paper-reaction period (DW x DP x RP) interaction and drying weight-mass ratio of sulfamic acid to zinc powder -reaction period (DW x MSZ x RP) interaction. Apart from main effect, interaction effects between the parameters were also investigated in this study and results are presented in Figures 7 to 9. Among all the interaction effects, there were only two of the three interaction effects i.e. drying weight-drying period of silver nitrate-impregnated filter- paper-reaction period (DW x DP x RP) interaction and drying weight-mass ratio of sulfamic acid to zinc powder-reaction period (DW x MSZ x RP) interaction were significantly affect all color values except blue color value on the production of color compunds on the silver nitrate-impregnated filter paper.
Optimisation of Arsenic (III) Detection
Experiments with various mass ratio of sulfamic acid to zinc powder (MSZ) i.e. 1.0 g: 0.5 g; 2.5 g: 1.25 g and 4.0 g: 2.0 g, and different reaction periods (RP) (5 minutes, 7.5 minutes and 10 minutes) were conducted to validate the optimum conditions by optimisation plot using Minitab software version 17, whereas the weight load used for drying silver nitrate-impregnated filter paper (DW) and drying period of silver nitrate-impregnated filter paper (DP) were fixed at low levels i.e. 100 g and 20 seconds, respectively, as both were found to be insignificant factors. The optimization plot (Fig. 13) shows the effect of each factor on the responses or composite desirability. The vertical red lines on the graph represent the current factor settings. The numbers displayed in bracket show the current factor level settings (in red). Both horizontal blue dash lines and numbers indicated by y which represents the responses for the current factor level. The plot displays the optimum mass ratio of sulfamic acid to zinc powder (MSZ) and the optimum reaction period (RP).
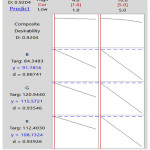 |
Figure 13: Optimization plot for Arsenic (III) detection
|
Conclusion
In this work, various effects were investigated using 24 full factorial design for detection of arsenic (III) by colorimetric incorporated with image processing technique. The mass ratio of sulfamic acid to zinc powder was the most significant factor affected RGB color values and followed by reaction period. Drying weight-drying period of silver nitrate-impregnated filter-paper-reaction period (DW x DP x RP) interaction as well as drying weight-mass ratio of sulfamic acid to zinc powder-reaction period (DW x MSZ x RP) interaction significantly affected red and green color values, thus significantly influenced the detection. The optimum conditions for detection of arsenic (III) were found to be using 1 g of sulfamic acid and 0.5 g of zinc powder at 5 minutes. The present work also demonstrates that the developed method can be used to detect arsenic (III) rapidly and easily.
Acknowledgments
The authors thank to Ministry of Higher Education for financing this work via research grant (PRGS/1/2012/STWN01/UPNM/02/1) and Universiti Pertahanan Nasional Malaysia for providing the research facilities.
References
1. Kathleen, M. M.; Hoang, T. H.; Kyoung-Woong, K. Rev. Environ. Health. 2011, 26(1), 71–78.
2. Cullen W. R.; Reimer K. J. Chem. Rev. 1989, 89(4), 713–64.
3. Mizumura, A.; Watanabe, T.; Kobayashi, Y.; Hirano, S. Toxicol. Appl. Pharmacol. 2010, 242(2), 119–125.
4. Shen, S.; Li, X.-F.; Cullen, W.R.; Weinfeld, M.; Le, X.C. Chem. Rev. 2013, 113(10), 7769-7792.
5. Bednar, A.J.; Garbarino, J.R.; Burkhardt, M.R.; Ranville J.F.; Wildeman T.R. Water Res., 2004, 38, 355–364.
6. Wang, Y.; Pan., G.; Wang, K.Q. Nanotech 2011: Technical Proceedings of the 2011 NSTI Nanotechnology Conference and Expo, Boston, MA, 2011, 3, 521-524.
7. Safarzadeh-Amiri, A.; Fowlie, P.; Kazi, A.I.; Siraj, S.; Ahmed, S.; Akbor, A. Sci. Total Environ. 2011, 409, 2662–2667.
8. Anderson, R.D.; McNeill, L.S.; Edwards, M.; Morton, S.C. J. Environ. Eng. 2008, 134(5), 382-388.
9. Cherukuri, J.; Anjaneyulu, Y. Int. J. Environ. Res. Public Health. 2005, 2(2), 322 – 327.
10. Ong, K. K.; Zainuddin, M.; Teoh, C. C.; Yusof, N. A.; Wan Yunus, W. M. Z.; Mohd Azmi, A. F. Environ. Eng. Manag. J. 2015, 14(8), 1963-1968.

This work is licensed under a Creative Commons Attribution 4.0 International License.
![]()
A New Edition of Web of Science
Journal Impact Factor
2022: 0.5
Five Year: 0.8
Journal is Indexed in

Cabells Whitelist
![]()


