Inhibition Studies of Rosmarinus Officinalis on The Pitting Corrosion Resistance 439LL Ferritic Stainless Steel in Dilute Sulphuric Acid
Roland Tolulope Loto* and Eboh Oghenerukewe
Department of Mechanical Engineering, Covenant University, Ota, Ogun State, Nigeria.
Corresponding Author E-mail: tolu.loto@gmail.com
DOI : http://dx.doi.org/10.13005/ojc/320557
The electrochemical effect of NaCl concentrations (1-5 wt.%) on the corrosion, pitting potential and passivation characteristics of type 439LL ferritic stainless steels was studied in 1 M and 3 M H2SO4 solutions under the inhibiting action of Rosmarinus officinalis through potentiodynamic polarization resistance technique and IR spectroscopy. Results showed that the pitting potential decreased with significant increase in corrosion rates as the concentration of NaCl increased in the absence of Rosmarinus officinalis. Increase in pitting potential, passivation characteristics with significant decrease in corrosion rate was observed with increase in Rosmarinus officinalis concentrations. The average inhibition efficiency of 85 % was obtained. IR spectroscopy showed the presence of alkenes, amines, carboxylic acids, aromatics, alkanes, alkynes and alkyl halides functional groups responsible for the formation of stable complex with the iron constituents. The results obtained establish the dynamic relationship between Rosmarinus officinalis concentrations and the corrosion behavior of the ferritic stainless steel.
KEYWORDS:corrosion; ferritic stainless steel; inhibitor; sodium chloride; sulphuric acid
Download this article as:| Copy the following to cite this article: Loto R. T, Oghenerukewe E. Inhibition Studies of Rosmarinus Officinalis on The Pitting Corrosion Resistance 439LL Ferritic Stainless Steel in Dilute Sulphuric Acid. Orient J Chem 2016;32(5). |
| Copy the following to cite this URL: Loto R. T, Oghenerukewe E. Inhibition Studies of Rosmarinus Officinalis on The Pitting Corrosion Resistance 439LL Ferritic Stainless Steel in Dilute Sulphuric Acid. Orient J Chem 2016;32(5). Available from: http://www.orientjchem.org/?p=22786 |
Introduction
Pitting corrosion is one of the most dangerous forms of localized corrosion of stainless steel alloys, and generally exists in a wide variety of corrosive environments. The chloride ion is the most common corrosive anion present in most industrial environments1. Pitting is generally focused on a small area of metal surface, and always causes the devices to fail by perforation, or initiates stress corrosion cracks2, 3. Flaws, scratches, breakages and cracks on the passive film lead to pit formation on the metal surface especially in regions or sites of inclusions or impurities 4, 5. These sites become anodic while an unknown but potentially vast area becomes cathodic. The corrosion propagates autocatalytically penetrating the metal insidiously6. Pits initiates microscopically and tends to be shielded by the products of the redox corrosion process, making pitting corrosion one of the more hazarduous forms of corrosion of metallic alloys7, 8. Resistance to pitting corrosion is subject to the chloride ion concentration, period exposure, temperature and presence of oxygen. The aggressiveness and ability of ions to initiate pitting are well known9-11. Ferritic stainless steels belong to the group of alloys which are magnetic and have a martensitic structure. The basic alloy contains 11% chromium and 1% manganese. They have certain useful corrosion properties, such as resistance to chloride stress-corrosion cracking, corrosion in oxidizing aqueous media, oxidation at high temperatures and pitting and crevice corrosion in chloride media. The high corrosion resistance of the ferritic stainless steel is attributable to the presence of thin and invisible passive film characterized by stability, durability, adherence, and self-repairing, but they can suffer pitting corrosion in chloride environments, however they are subject to both uniform and non-uniform attack in aggressive environments where the rate of repassivation of the protective film is lower than the rate of destruction of the anionic species responsible for corrosion12-14. The incubation time for non-uniform attack in chloride containing environments is very short, often only hours or a few days. In this study, the pitting corrosion behavior and inhibition of Type 439LL stainless steel in dilute sulphuric acid at specific concentrations of sodium chloride and Rosmarinus officinalis has been investigated. The mechanism of pitting corrosion of in these solutions has been discussed on the basis of these results.
Materials and Methods
Material
Commercially available Type 440 ferritic stainless steel was used for all experiments with average nominal composition of 0.014% C, 1% Si, 1% Mn, 0.040% P, 0.030% S, 17%Cr and 0.50% Ni, the rest being Iron and other trace elements. The material is of rectangular dimension with an exposed surface area of 1.5cm2.
Inhibitor
Rosmarinus officinalis (ROS) a golden, translucent, oily liquid is the inhibiting compound used. Its major compositions are p-cymene (44.02%), linalool (20.5%), gamma-terpinene (16.62%), thymol (1.81%), beta-pinene (3.61%), alpha-pinene (2.83%) and eucalyptol (2.64%). It is also composed of monoterpenic hydrocarbons, oxygenated monoterpenes and sesquiterpene hydrocarbons15. The main chemical composition of rosemary oil is a phenolic compound16. ROS was prepared in volumetric concentrations of 2.5%, 5%, 7.5%, 10%, 12.5% and 15% respectively per 200 ml of the acid media at 2% NaCl concentration.
Test Media
1M and 3M H2SO4 with 1-5% recrystallized NaCl of analar grade without ROS was used as the corrosion test media to study the effect of increase in NaCl concentrations while 1M and 3M H2SO4 with 2.5-15% ROS addition at 2% NaCl concentration was also studied.
Preparation of Steel Samples
The ferritic stainless steels alloys were machined into predetermined number of samples with a mean dimension of 1cm by 1.5cm. The exposed surfaces of each of the samples were metallographically prepared with silicon carbide abrasive papers of 80, 320, 600 and 1000 grits, distilled water, acetone, dried and desiccator for linear voltammetry test.
Linear Voltammetry Test
Linear voltammetry test was done on a rectangular steel sample immersed in resin plastic mounts with an exposed surface area of 1.5cm2 at mean temperature of 25oC with the aid of DIGI-IVY DN 2311 potentiostat consisting of an electrode cell with 200 ml of the prepared corrosive media, in the presence and absence of ROS compound. The counter electrode is a platinum rod, while Ag/Ag/Cl electrode was used as the reference electrode. The potentiostat was cursorily examined from -1.5V to +1.5V versus at a scan rate of 0.002V/s. The corrosion current (jcr) density (Jcr), pitting potential (Epit), passivation potential (Epp), passivation range, nucleation resistance (NR) and the corrosion potential (Ecr) were determined from the Tafel plots of potential versus log current. The corrosion rate (C), the degree of surface coverage (θ) and the inhibition efficiency (ɲ) were calculated as follows
Where Jcr is the current density in μA/cm2, D is the density in g/cm3; Eq is the specimen equivalent weight in grams.
The inhibition efficiency (ɲ) was determined from corrosion rate data with equation 2 below.
where C1and C2 are the corrosion rates in absence and presence of inhibitors, respectively.
IR Spectroscopy
The ROS liquid compound was exposed to a range of infrared ray beams. The transmittance and reflectance of the infrared rays at different frequencies was translated into an IR absorption plot consisting of spectra peaks. The spectral pattern was analyzed and matched according to IR absorption table to identify the functional group contained in the compound.
Results and Discussion
Polarization Studies
The effect of the addition of NaCl and ROS on the polarization plots (Figs. 1-4) of ferritic stainless steel in 1M and 3 M H2SO4 solutions with 1-5% NaCl addition was studied at ambient temperature of 25 °C as shown in Tables (1-4). The corrosion rates in Tables 1 & 2 increased progressively with increase in NaCl concentration due to the action of the chloride and sulphate ions in destroying the passive film of the steel and accelerating the rate of corrosion. Observation of the corrosion rates in both Tables show the severe deteriorating effect of the acid chloride solution. The corrosion rate increased from 0.452mm/yr to 0.978mm/yr in 1M H2SO4 compared to 3M H2SO4 solution whose corrosion rate increase from 0.232 to 0.416 at 1-3% NaCl, from 4% NaCl they are comparable in value. The increase in corrosion rate is accompanied by a progressive decrease in polarization resistance and increase in corrosion current density in both solutions. The corrosion rates depict severe active deterioration of the steel specimens in the test media. The intensity of deterioration increases with increase in chloride ion concentration.
The combined electrochemical action of chloride and sulphate ions undoubtedly resulted in anodic dissolution of the ferritic stainless steel17. The capacity of the steel’s passive film to heal itself was significantly minimized, the consequence of which results in the initiation and propagation of corrosion pits through autocatalytic mechanism. Previous research suggests that deterioration of stainless steel is as a result of the selective dissolution of the chromium metal and accumulation of Cr2O3 without the passive film18. The potentiodynamic polarization plot in Figs. 1 and 2 displays a differential passive film i.e the passive film varies with respect to concentration of the ionic species. Breakdown occurs at higher potentials causing the growth of stable pits in the transpassive region of the polarization plots. This observation is accompanied by a significant increase in corrosion current. The increase in current is due to the breakdown of protective layer on the steel surface and initiation of pitting corrosion. Breakdown of the protective layer on the steel causes the electrolytic transport of Cl– and SO42-anions through the passive layer to the oxide–metal interface; this is accompanied by an increase in the migration of metal cations from the passive film to the acid chloride solution. The rate of growth of corrosion pits is subject to the diffusion of the dissolving metal cations from within the pit interior19.
The corrosion rate values in Tables 3 & 4 decreased with increase in ROS concentrations due to its influence on the electrochemical reactions between the ferritic steel and the acid solutions. Decrease in corrosion rate is accompanied by a decrease in corrosion current. The corrosion inhibition behavior of ROS is directly proportional to the value of its concentrations, acting through adsorption onto the steel surface as shown in the Tables. Increased ROS concentration results in progressive increase in inhibition efficiency due to the presence of more ROS molecules to inhibit the actions of the corrosive species and block the active sites on the alloy surface. The inhibition action is due to the presence of active organic components such as carnosol, carnosic acid, rosmadial, rosmanol, epirosmanol, and methyl carnosate20. Organic compounds with O, S, or N or their combination have been proven as efficient corrosion inhibitor for metals in acidic media by adsorption21-23. The adsorption of these compounds on the metal surface reduces the available area for the attack of aggressive ions such as SO42− or Cl−. Results obtained shows that ROS retarded the electrochemical process responsible for corrosion. The anodic and cathodic potentials were significantly influenced in the presence of ROS.
The adsorbed protective film prevents the diffusion of the aggressive anions causing a significant decrease in corrosion rate. The major composition of ROS contains polyphenolic compounds which readily form complexes with di- and trivalent metal ions24. The presence of significant number of active centers in the chemical structure of ROS increases the surface coverage and consequently the inhibition efficiency. The corrosion potential values in Table 1 & 2 shifted towards more negative potentials as the concentration of NaCl concentration increases, depicting greater cathodic activity of hydrogen evolution and oxygen reduction reactions with increase in corrosion rate. In Table 3 the corrosion potential shifted to more negative potentials with increase in ROS concentration showing cathodic inhibition in 1M H2SO4 solution however the cathodic and anodic potentials shows general redox electrochemical process. This mechanism is also can be attributed to deposition of ROS ionized molecules on the alloy as a result of interaction between the inhibitor and the oxidized metal surface which effectively seals the surface against further reaction; however the cathodic process predominates over the anodic.
Table 1: Data obtained from polarization resistance measurements for ferritic stainless steel in 1M H2SO4 at (1-5%) NaCl without ROS
| Solution Concentration | Corrosion Potential (Ecorr) | Corrosion Current (icorr) | Corrosion Current density (Icorr) | bc | ba | Polarization Resistance (Rp) | Corrosion Rate (mm/year) |
| 1M H2SO4 + 1% NaCl | -0.154 | 6.34E-05 | 4.23E-05 | -8.907 | 8.700 | 786.5 | 0.451 |
| 1M H2SO4 + 2% NaCl | -0.155 | 7.63E-05 | 5.65E-05 | -8.873 | 8.689 | 201.3 | 0.603 |
| 1M H2SO4 + 3% NaCl | -0.167 | 7.71E-05 | 7.34E-05 | -9.223 | 9.071 | 234.6 | 0.783 |
| 1M H2SO4 + 4% NaCl | -0.161 | 1.26E-04 | 8.39E-05 | -8.802 | 8.561 | 172.0 | 0.896 |
| 1M H2SO4 + 5% NaCl | -0.172 | 1.37E-04 | 9.17E-05 | -9.296 | 9.115 | 99.9 | 0.978 |
Table 2: Data obtained from polarization resistance measurements for ferritic stainless steel in 3M H2SO4 at (1-5%) NaCl without ROS
| Solution Concentration | Corrosion Potential (Ecorr) | Corrosion Current (icorr) | Corrosion Current density (Icorr) | bc | ba | Polarization Resistance (Rp) | Corrosion Rate (mm/year) |
| 3M H2SO4 + 1% NaCl | -0.156 | 3.26E-05 | 2.17E-05 | -9.298 | 9.150 | 275.2 | 0.232 |
| 3M H2SO4 + 2% NaCl | -0.202 | 3.93E-05 | 2.91E-05 | -10.46 | 10.309 | 124.8 | 0.310 |
| 3M H2SO4 + 3% NaCl | -0.205 | 4.09E-05 | 3.90E-05 | -6.808 | 6.470 | 106.9 | 0.416 |
| 3M H2SO4 + 4% NaCl | -0.208 | 1.26E-04 | 8.37E-05 | -8.587 | 8.368 | 54.5 | 0.893 |
| 3M H2SO4 + 5% NaCl | -0.227 | 1.70E-04 | 1.13E-04 | -10.07 | 9.973 | 24.9 | 1.211 |
Table 3: Data obtained from polarization resistance measurements for ferritic stainless steel in 1M H2SO4 + 2% NaCl at (2.5-10%) ROS
| Solution Concentration | Corrosion Potential (Ecorr) | Corrosion Current (icorr) | Corrosion Current density (Icorr) | bc | ba | Polarization Resistance (Rp) | Corrosion Rate (mm/year) | Inhibition Efficiency (%) |
| 1M H2SO4 + 0% Ros | -0.153 | 9.03E-05 | 6.02E-05 | -8.873 | 8.699 | 201.32 | 0.643 | 0 |
| 1M H2SO4 + 2.5% Ros | -0.189 | 3.46E-05 | 2.56E-05 | -7.440 | 7.106 | 84.76 | 0.274 | 57.4 |
| 1M H2SO4 + 5% Ros | -0.192 | 2.27E-05 | 2.16E-05 | -7.115 | 6.481 | 80.78 | 0.231 | 64.1 |
| 1M H2SO4 + 7.5% Ros | -0.193 | 1.77E-05 | 1.18E-05 | -6.808 | 5.752 | 38.57 | 0.126 | 80.4 |
| 1M H2SO4 + 10% Ros | -0.199 | 1.35E-05 | 9.02E-06 | -7.377 | 7.149 | 31.40 | 0.096 | 85.0 |
Table 4: Data obtained from polarization resistance measurements for ferritic stainless steel in 3M H2SO4 + 2% NaCl at (2.5-10%) ROS
| Solution Concentration | Corrosion Potential (Ecorr) | Corrosion Current (icorr) | Corrosion Current density (Icorr) | bc | ba | Polarization Resistance(Rp) | Corrosion Rate (mm/year) | Inhibition Efficiency (%) |
| 3M H2SO4 + 0% Ros | -0.202 | 3.93E-05 | 2.62E-05 | -10.46 | 10.24 | 261.0 | 0.310 | 0 |
| 3M H2SO4 + 2.5% Ros | -0.191 | 1.50E-05 | 1.11E-05 | -8.091 | 7.500 | 308.8 | 0.119 | 61.6 |
| 3M H2SO4 + 5% Ros | -0.131 | 8.26E-06 | 7.87E-06 | -8.548 | 8.010 | 395.2 | 0.084 | 72.9 |
| 3M H2SO4 + 7.5% Ros | -0.103 | 8.91E-06 | 5.94E-06 | -9.388 | 9.288 | 425.6 | 0.063 | 79.6 |
| 3M H2SO4 + 10% Ros | -0.153 | 6.18E-06 | 4.12E-06 | -8.104 | 7.662 | 492.1 | 0.044 | 85.8 |
Corrosion potentials in Table 4 generally shifted to less negative values indicating anodic inhibition which involves surface coverage and inhibition of the alloy dissolution process. In 1M H2SO4 the maximum displacement in Ecr value is -45 mV in the cathodic direction, thus it is a mixed type inhibitor with greater tendency for inhibition of the hydrogen evolution process in the acid solution, however in 3M H2SO4 the maximum displacement in Ecr value is 199mV in the anodic direction thus it is an anodic type inhibitor25, 26. Deviation in corrosion potentials is most probably due to competition between the anodic and the cathodic inhibiting reactions.
Pitting Corrosion Evaluation
Observation of Table 5 & Fig. 5 shows the linear relationship between the pitting potential values and NaCl concentration. The pitting potential is the potential at which pitting corrosion stabilizes and grows leading to failure of the metallic alloy. The lower the pitting potential, the greater the corrosion resistance of the material to localized corrosion 27, 28. Increase in NaCl concentration leads to a decrease in pitting potential value thus less resistance and greater susceptibility of the steel to corrosion attack. The passivation range value also reduces; the greater the passivation range, the greater the ability of the passive protective film of chromium oxide to reform and protect the steel surface in the presence of the chloride ions, thus the ability of the stainless steel to repair its film when partially destroyed. Passive metals are susceptible to localized attack by pitting when polarized above a certain potential in the electrolyte solution. The chloride ions destroy the passive layer by preferential adsorption. These ions are attracted to the metal, and compete with oxygen and any other passivating agent, for adsorption on the metal surface29, 30. This process results in substitution of adsorbed oxygen.
Chlorides being anions with high diffusivity and very reactive penetrates easily through the protective films of stainless steels when induced through applied potentials. The electrolytic transport of the chlorides into the nucleated and rapidly growing pits is to maintain electrical neutrality and hydrolysis of the corrosion products within the pits leading to acidification. This inhibits the formation of the protective passive layer on steels31. The reaction process is self-propagating due to corrosion of the metal alloys within the pits resulting in the accumulation of metal cations within the pit32. The corrosion in the pits facilitates the reaction of the metallic ions with water to form a hydroxides and hydrogen ions which accelerates the corrosion reactions.
The pitting potential and passivation range continues to decrease until sample B5 (Table 5) where the sample exhibits no passivation but completely fails. The pitting potential values and passivation range in Table 6 contrasts the values in Table 5 due to the presence of ROS inhibitor. Increase in inhibitor concentration causes a significant increase in pitting potential as shown in Fig. 6 and passivation range of the steel in 1M & 3M H2SO4 solution. The inhibitor delays the formation of pits hence reduces the susceptibility of the steel to corrosion through adsorption onto the steel surface. Sample B5 in Table 6 shows a remarkable difference from the same sample in Table 5, the presence of passivation range attests to the capacity of ROS to enhance the pitting corrosion resistance and service life of ferritic steel.
The polarization curves in Figs. (1-4) shows a spontaneously passive material. Pit creation is occurs at preferential sites associated with flaws or inclusion on the alloy surface in two phases (nucleation of pits and collapse of passivity) leading to metastable pitting which ceases when the alloy repassivates at the onset of the passivation potential. In the case of the polarization plots in Fig. 2(e) metastable pitting develops and the process moves almost immediately to the stage of stable pit growth i.e. pit propagation. During upward scanning, breakdown occurs, and a stable pit starts to grow at the pitting potential in the transpassive region of the polarization curve. At this point the current increases sharply from the passivation current values. Comparison of the plots in Fig. 5 and Fig. 6 shows the difference in pitting potential values with respect to NaCl and ROS concentration. In Fig. 5(a) the pitting potential decreased sharply with increase in NaCl concentration, this contrasts the plot in Fig. 5(b) where there was a negligible decrease in pitting potential up to 4% NaCl concentration, after which the pitting potential declined sharply. Addition of ROS compound as shown in Fig. 6(a & b) caused an increase in the pitting potential up till 3% ROS concentration after which ROS had no positive impact on the pitting corrosion resistance of the steel.
Table 5: Potentiostatic values of ferritic Stainless Steel in 1 & 3M H2SO4 at specific concentrations of NaCl without ROS
| Sample | Solution Concentration | Pitting Potential (V) | Passivation Potential (V) | Passivation Range (V) | Current at Pitting Potential |
| A1 | 1M + 1% | 0.978 | 0.111 | 0.867 | 5.87E-05 |
| A2 | 1M + 2% | 0.970 | 0.108 | 0.862 | 6.12E-05 |
| A3 | 1M + 3% | 0.941 | 0.101 | 0.840 | 1.07E-04 |
| A4 | 1M + 4% | 0.932 | 0.093 | 0.839 | 5.58E-05 |
| A5 | 1M + 5% | 0.943 | 0.119 | 0.824 | 7.12E-05 |
| B1 | 3M + 1% | 1.030 | 0.124 | 0.906 | 7.32E-05 |
| B2 | 3M + 2% | 0.985 | 0.140 | 0.845 | 9.81E-05 |
| B3 | 3M + 3% | 0.977 | 0.162 | 0.815 | 1.07E-04 |
| B4 | 3M + 4% | 0.821 | 0.386 | 0.435 | 6.64E-05 |
| B5 | 3M + 5% | 0 | 0 | 0 | 0 |
Table 6: Potentiostatic values of ferritic Stainless Steel in 1 & 3M H2SO4 + 2% NaCl at specific concentrations of ROS
| Sample | Solution Concentration with 2% NaCl | Pitting Potential (V) | Passivation Potential (V) | Passivation Range (V) | Current at Pitting Potential |
| A1 | 1M + 0% ROS | 0.97 | 0.108 | 0.862 | 6.12E-05 |
| A2 | 1M + 2.5% ROS | 1.02 | 0.099 | 0.925 | 9.24E-05 |
| A3 | 1M + 5% ROS | 1.06 | 0.043 | 1.017 | 1.86E-04 |
| A4 | 1M + 7.5% ROS | 1.05 | 0.003 | 1.047 | 1.46E-04 |
| A5 | 1M + 10% ROS | 1.04 | -0.093 | 1.133 | 1.18E-04 |
| B1 | 3M + 0% ROS | 1.00 | 0.123 | 0.872 | 9.40E-05 |
| B2 | 3M + 2.5% ROS | 1.04 | 0.062 | 0.978 | 1.10E-04 |
| B3 | 3M + 5% ROS | 1.10 | 0.107 | 0.993 | 1.60E-04 |
| B4 | 3M + 7.5% ROS | 1.11 | 0.127 | 0.983 | 7.10E-05 |
| B5 | 3M + 10% ROS | 1.07 | 0.156 | 0.904 | 1.45E-04 |
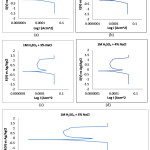 |
Figure 1: Polarization Curve of ferritic stainless steel (a) 1M H2SO4 + 1% NaCl, (b) 1M H2SO4 + 2% NaCl, (c) 1M H2SO4 + 3%NaCl, (d) 1M H2SO4 + 4%NaCl, (e) 1M H2SO4 + 5% NaCl |
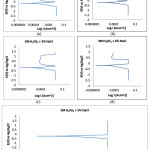 |
Figure 2: Polarization Curve of ferritic stainless steel (a) 3M H2SO4 + 1% NaCl, (b) 3M H2SO4 + 2% NaCl, (c) 3M H2SO4 + 3%NaCl, (d) 3M H2SO4 + 4%NaCl, (e) 3M H2SO4 + 5% NaCl Click here to View Figure |
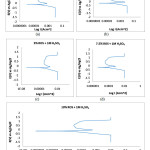 |
Figure 3: Polarization Curve of FSS (a) 1M H2SO4 + 0% ROS, (b) 1M H2SO4 + 2.5% ROS, (c) 1M H2SO4 + 5% ROS (d) 1M H2SO4 + 7.5%ROS (e) 1M H2SO4 + 10%ROS Click here to View Figure |
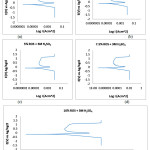 |
Figure 4: Polarization Curve of FSS (a) 3M H2SO4 + 0% ROS, (b) 3M H2SO4 + 2.5% ROS, (c) 3M H2SO4 + 5%ROS, (d) 3M H2SO4 + 7.5% ROS, (e) 3M H2SO4 + 10% ROS Click here to View Figure |
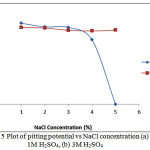 |
Figure 5: Plot of pitting potential vs NaCl concentration (a) 1M H2SO4, (b) 3M H2SO4 Click here to View Figure |
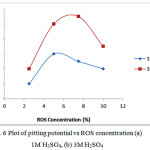 |
Figure 6: Plot of pitting potential vs ROS concentration (a) 1M H2SO4, (b) 3M H2SO4 |
Adsorption Isotherm
The mechanism of the corrosion inhibition process can be further understood from the organo-metallic interaction of ROS molecules on the metal surface due to the formation of bonds between the inhibitor molecule and the metal33. An organic compound with a high surface coverage on the metal has a strong chemical bond between its molecules and the metal atom which is quite stronger than the one for water molecules/corrosive anions which can either be electrostatic or covalent bonding. Langmuir, Frumkin and Freundlich adsorption isotherms were applied to describe the adsorption mechanism for the inhibiting compounds in acid solutions, as they best fit the experimental results.
The isotherms have the general formula shown below;
f (θ, x) exp(− 2aθ) = K (3)
where f(θ, x) is the conformation factor which is subject to the physical model and premise fundamental to the derivative of the isotherm, θ is the surface coverage, C is the concentration of the organic compound, x is the size ration, ‘a’ is the molecular interaction parameter and K is the adsorption equilibrium constant.
The general form of the Langmuir equation is,
and rearranging gives
where θ is the degree of coverage on the metal surface, C is ROS concentration in the electrolyte, and Kads is the equilibrium constant of the adsorption process.
Langmuir isotherm suggests the following;
a) The interaction between inhibitor molecules on the metal surface is fixed.
b) The Gibbs free energy is independent of the surface coverage values.
c) The effect of lateral interaction between the inhibitor molecules on the Gibbs free energy is negligible.
Frumkin isotherm assumes unit coverage at high inhibitor concentrations and that the electrode surface is inhomogeneous i.e. the lateral interaction effect is not negligible. In this way, only the active surface of the electrode, on which adsorption occurs, is taken into account. Frumkin adsorption isotherm can be expressed according to equation 6. K is the adsorption-desorption constant and α is the lateral interaction term describing the interaction in adsorbed layer
![]()
Freundlich isotherm states the quantitative relationship of the inhibiting compound and the molecular concentration of inhibitor molecules absorbed onto the steel which varies at specific concentrations34, according to equation 7 and 8.
θ = KadsCn (7)
log θ = nlog C + log Kads (8)
n is a constant subject to the properties of the adsorbed molecule, where 0 < n < 1,Kads is the adsorption-desorption equilibrium constant connoting the interaction strength within the adsorbed layer. Absolute and higher results of Kads suggest strong interaction between the organic molecule and the metal surface. The results of the Gibbs free energy (ΔGads) for the adsorption mechanism can be calculated from the equilibrium constant of adsorption with the following below.
ΔGads= – 2.303 RT log [55.5Kads] (9)
55.5 is the molar concentration of water in the solution, R is the universal gas constant, T is the absolute temperature and Kads is the adsorption equilibrium constant. Kads is related to surface coverage () according to equation 10.
Fig. 7-9 shows the isotherm models of the molecular interaction of ROS interaction on the ferritic stainless steel surface in 1M & 3M H2SO4 acid chloride solution in the presence of ROS concentrations. The deviation of the slopes from unity in the figures is due to the molecular interaction between ROS molecules on the metal surface and changes in the values of the Gibbs free energy relative to the surface coverage.
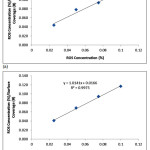 |
Figure 7: Langmuir isotherm model ROS concentrations (a) in 1M H2SO4 (b) in 3M H2SO4. |
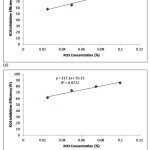 |
Figure 8: Freunlich isotherm model ROS concentrations (a) in 1M H2SO4 (b) in 3M H2SO4. |
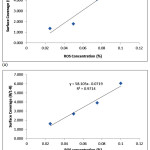 |
Figure 9: Frumkin isotherm model ROS concentrations (a) in 1M H2SO4 (b) in 3M H2SO4. |
The deviation of the slopes from unity in Figure 10 is attributed to the molecular interaction among the ROS molecules on the metal surface and changes in the values of the Gibbs free energy relative to the surface coverage.
Thermodynamics of the Corrosion Process
The values of Gibbs free energy (ΔGads) for the adsorption process can be evaluated from the equilibrium constant of adsorption using the following equation as shown in Table 6.
The data shown in Table 7 confirms minimal divergence from ideal condition of the Langmuir model from the values of Free energy of Adsorption (ΔGads) as the surface coverage (θ) values increases. This is due to the heterogeneous property (presence of dislocations, vacancies, micro-distortions of crystal lattice, etc) of the steel surface. Not all sites on the surface are equivalent thus the varying energy of adsorption.
Table 7: Results of Gibbs free energy, Surface coverage and equilibrium constant of adsorption at specific concentrations of ROS in 1M and 3M H2SO4.
| ROS Concentration (%) | Surface Coverage (θ) | Equilibrium Constant of Adsorption (K) | Gibbs Free Energy (∆G) |
| 1M + 0% ROS |
0 |
0 | 0 |
| 1M + 2.5% ROS |
0.574 |
362671.0 | -41.67 |
| 1M + 5% ROS |
0.641 |
240294.7 | -40.65 |
| 1M + 7.5% ROS |
0.804 |
368035.1 | -41.71 |
| 1M + 10% ROS |
0.85 |
381310.0 | -41.80 |
| 3M + 0% ROS |
0 |
0 | 0 |
| 3M + 2.5% ROS |
0.616 |
431777.5 | -42.11 |
| 3M + 5% ROS |
0.729 |
362025.2 | -41.67 |
| 3M + 7.5% ROS |
0.796 |
350083.9 | -41.59 |
| 3M + 10% ROS |
0.858 |
406583.2 | -41.96 |
The ΔGads data shows the ability of ROS to strongly adsorb to the steel in the acid chloride media. The negative sign on ΔGads data shows that the adsorption is spontaneous. The values of ΔGads determined varied from between 40.65 kJ mol-1 to 4.80 kJ mol-1 in 1M H2SO4 solution while in 3M H2SO4 solution it varies between 41.67 kJ mol-1 to 42.11 kJ mol-1. Values of ΔGads of about -20 kJ/mol or below depicts with weak molecular interaction whereas values of ΔGads of about -40 kJ/mol or above involve the formation of a covalent type of bond35, 36. The value of ΔGads calculated in the present study shows that the adsorption mechanism of ROS compound on ferritic stainless steel is through chemisorption mechanism.
IR Spectroscopy
IR spectroscopy was used to investigate the nature and center of adsorption of ROS compound. Observation of the spectra peaks and comparing it to the Table of characteristic IR absorptions 37, the extracts are shown in Table 8. The peaks at 2957, 2921 and 2878 cm−1 shows the presence of C-H single bond groups referring to alkanes. Peaks at 1745, 1685 corresponds to C=O stretch of the carbonyl group. Peaks at 1447, 1417, 1375 and 1363 corresponds also C-H single bond groups referring to alkanes. The peaks at 1323 and 1305 refer to N–O symmetric stretch consisting of nitro compounds. 1274, 1234, 1215, 1166, 1125, 1079, 1051 and 1017 refers to C–N and C-O single bonds which consists of aromatic amines, alcohols, carboxylic acids, esters and ethers. 670, 749, 787, 814, 843, 876, 921, 952, 985 refers to peaks associated with =C–H bend, N–H wag, =C–H bend, O–H bend, C–H “oop”, C–Cl stretch, C–H rock, –C(triple bond)C–H: C–H bend and C–Br stretch single and double bonds which refers to alkenes, primary, secondary amines, alkenes, carboxylic acids, aromatics, alkyl halides, alkanes, alkynes and alkyl halides functional groups.
These groups are responsible for the formation of stable complex between the iron constituents and functional groups present in the ROS extract forming covalent or coordinate bonds between the anionic components of ROS extracts and vacant Fe d-orbital. The metal-inhibitor bond usually leads to corrosion inhibition through adsorption38. The corrosion retarding mechanism through stable complex formation dominates with increase in ROS concentration. The corrosion retarding mechanism is due to strong adsorption resulting from the donation of lone pair of electrons on oxygen and nitrogen to vacant d orbital of the metal which leads to the formation of metal complexes.
The ROS constituents have antioxidant properties especially bonds consisting of N and oxygen. These are responsible for the possible mechanism for chemisorptions reactions. The cathodic reaction consists of hydrogen evolution and oxygen reduction while the anodic reaction consists of oxidation resulting in the dissolution of the alloy as the metal cations go into the solution. As shown earlier in the potentiodynamic studies, ROS displays greater cathodic inhibition in comparison to anodic inhibition thus the functional groups in ROS inhibits the corrosion of the ferritic steel samples by increasing the surface impedance of the steel thereby stifling the redox reaction process responsible for corrosion.
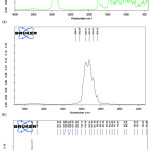 |
Figure 10: (a-c): IR spectra of ROS inhibiting compound. |
Table 8: Table of extracted IR absorptions
| Wavenumber, cm–1 | Bond | Functional Group |
| 3100–3000 (m) | =C–H stretch | alkenes |
| 3000–2850 (m) | C–H stretch | alkanes |
| 1760–1665 (s | C=O stretch | carbonyls (general) |
| 1760–1690 (s) | C=O stretch | carboxylic acids |
| 1750–1735 (s) | C=O stretch | esters, saturated aliphatic |
| 1740–1720 (s) | C=O stretch | aldehydes, saturated aliphatic |
| 1730–1715 (s) | C=O stretch | alpha,beta–unsaturated esters |
| 1715 (s) | C=O stretch | ketones, saturated aliphatic |
| 1710–1665 (s) | C=O stretch | alpha,beta–unsaturated aldehydes, ketones |
| 1680–1640 (m) | –C=C– stretch | alkenes |
| 1650–1580 (m) | N–H bend | primary amines |
| 1600–1585 (m) | C–C stretch (in–ring) | aromatics |
| 1550–1475 (s) | N–O asymmetric stretch | nitro compounds |
| 1500–1400 (m) | C–C stretch (in–ring) | aromatics |
| 1470–1450 (m) | C–H bend | alkanes |
| 1370–1350 (m) | C–H rock | alkanes |
| 1360–1290 (m) | N–O symmetric stretch | nitro compounds |
| 1335–1250 (s) | C–N stretch | aromatic amines |
| 1320–1000 (s) | C–O stretch | alcohols, carboxylic acids, esters, ethers |
| 1300–1150 (m) | C–H wag (–CH2X) | alkyl halides |
| 1300–1150 (m) | C–H wag (–CH2X) | alkyl halides |
| 1250–1020 (m) | C–N stretch | aliphatic amines |
| 1000–650 (s) | =C–H bend | alkenes |
| 950–910 (m) | O–H bend | carboxylic acids |
| 910–665 (s, b) | N–H wag | primary, secondary amines |
| 900–675 (s) | C–H “oop” | aromatics |
| 850–550 (m) | C–Cl stretch | alkyl halides |
| 725–720 (m) | C–H rock | alkanes |
| 700–610 (b, s) | –C(triple bond)C–H: C–H bend | alkynes |
| 690–515 (m) | C–Br stretch | alkyl halides |
Conclusion
The presence of specific concentrations NaCl on Type 439LL ferritic stainless steel in dilute sulphuric acid significantly influenced its pitting corrosion behaviour. Increase in NaCl reduced the potential at which pitting occurs and hence the passivity and resistance of the steel to pit formation. The presence of Rosmarinus officinalis altered the electrochemical equilibrium with significant increase in pitting potential and passivation range which invariable increased the resistance of the steel to pitting corrosion. IR spectroscopy showed Rosmarinus officinalis constituents have antioxidant properties especially bonds consisting of N and oxygen responsible for corrosion retarding chemisorption mechanism through stable complex formations.
Acknowledgement
This research was supported and funded by the Department of Mechanical Engineering, College of Engineering, Covenant University, Ota, Ogun State, Nigeria.
References
- Burstein, G.T.; Liu, C.; Souto, R.M.; Vines, S.P. Corr. Eng. Sci. & Tech. 2004, 39, 25–30
- Burstein, G.T.; Souto, R.M.; Liu, C.; Vines, S.P. Corr. & Mats. 2004, 29, S1–S4
- Younis, A.A.; El-sabbah, M.M.B.; Holze, R. J. of Solid State Elect. 2012, 16, 1033–1040.
- Ke, R.; Alkire, R. J. of Elect. Soc. 1995, 12(142), 4056-4062
- David, E.W.; Zhu, Y. J. of Elect. Soc. 2000, 147(5), 1763-1766
- Pitting corrosion, surfaces, interfaces, and their applications II. http://www.surface.mat.ethz. ch/education/courses/surfaces_interfaces_and_their_applications_II/SIandAII_Ch6_Pitting_ corrosion. [Accessed: 28/06/2015].
- Li, W.H.; He, Q.; Pei, C.L.; Hou, B.R. J. of App. Elect. 2008, 38(3), 289-295
- Kim, Y.; Buchheit, R.G. Electrochim. Acta. 2007, 52, 2437–2446
- Yang, Q.; Luo, J.L. Electrochim. Acta. 2001, 46, 851–859.
- Abd El Meguid, A.; Mahmoud, N.A.; Abd El Rehim, S.S. Mats. Chem. & Phys. 2000, 63(1), 67–74
- El-egamy, S.S.; Badway, W. A. J. of App. Elect. 2004, 34(11), 1153–1158
- Sedriks, J. Corrosion of stainless steels, 2nd ed., New York, John Wiley & Sons, 1996.
- Fong-yuan, Ma. Corrosive Effects of Chlorides on Metals. http://cdn.intechopen.com/pdfs /33625/InTech. [Accessed: 03/05/2015]
- Fossati, A.; Borgioli, F.; Galvanetto, E.; Bacci, T. Corros. Sci. 2006, 48(6), 1513–1527.
- Ozcan, M.M.; Chalchat, J.C. Int. J. of Food Sciences & Nutrition. 2008, 59(7-8), 691-698.
- Loto, R.T. J. Mater. Environ. Sci. 2013, 4(4), 448-459.
- Olsson, C.O.A.; Landolt, D. Electrochim. Acta. 2003, 48(9), 1093-1104.
- Hans-henning, S. Pitting Corrosion, Wiley-VCH Verlag GmbH & Co. KGaA, 2007.
- Velázquez-gonzález, M.A.; Gonzalez-rodriguez, J.G.; Valladares-cisneros, M.G.; Hermoso-diaz, I.A. American J. of Analytical Chem. 2014, 5(2). doi:10.4236/ajac.2014.52009
- Zarrok, H.; Oudda, H.; El Midaoui, A.; Zarrouk, A.; Hammouti, B.; Touhami, M.; Attayibat, M.A.; Radi, S.; Touzani, R. Research in Chem. Intermed. 2012. doi: 10.1007/s11164-012-0525-x.
- Zarrok, H.; Salghi, R.; Zarrouk, A.; Hammouti, B.; Oudda, L.H.; Bammou, L.; Al-Deyab, S. Der Pharm. Chem. 2012, 4, 407-416.
- Favre, M.; Landolt, D. Proceedings of the 7th European symposium on Corrosion Inhibitors. Ann University, Ferrara. 1990, 9, 787.
- Ferreira, E.S.; Giacomelli, C.; Giacomelli, F.C.; Spinelli, A. Mats. Chem. & Phys. 2004, 83(1), 129-134
- Li, H.B.; Jiang, Z.H.; Cao, Y.; Zhang, Z.R. Int. J. of Minerals, Met. & Mats. 2009, 16(4) , 387–392
- Gouda, V.K.; Al Hashem, A. International conference on advances in corrosion and protection, UMIST, UK, 1992.
- Wilde, B.E. in: Brown, B.F.; Kruger, J.; Taehle, R.W. Localized Corrosion, Houston TX, NACE, 1974, 3,. 342
- Saremi, M.; Mahallati, E. Cement & Concrete Research. 2002, 32(12), 1915–1921
- Foley, R.T. Corrosion. 1970, 26(2), 58-70.
- Magdy, A.M.I.; Abd El Rehim, S.S.; Hamza, M.M. Mats. Chem. & Phys. 2008, 115(1), 80–85.
- Yun Soo, L.; Joung Soo, K.; Hyuk Sang, K. J. of Nuclear Mats. 2005, 336(1), 65–72. doi:10.1016/j.jnucmat.2004.08.015
- Obot, I.B.; Obi-Egbedi, N.O.; Umoren, S.A. Int. J. Electrochem. Sci. 2009, 4, 863-877.
- Unuabonah, E.; Olu-owolabi, B.; Adebowale, O.; Ofomaja, E.; Adebowale, K.O.; Ofomaja, A.E. Colloids and Surfs A: Physicochem. Eng. Aspts. 2007, 292(2-3), 202-211.
- Obot, I.B.; Obi-Egbedi, N.O. Umoren, S.A. Der Pharm. Chem. 2009, 1, 151-166
- Hosseini, M.G.; Mertens, S.F.L.; Arshadi, M.R. Corros. Sci. 2009, 45, 1473-1489
- Table of Characteristic IR Absorptions.http://orgchem.colorado.edu/Spectroscopy/specttutor
- Makino, T.; Ono, T.; Matsuyama, K.; Nogaki, F.; Miyawaki, S.; Honda, G.; Muso, E. Nephrol Dial Transplant. 2000, 15, 1140 1145.
- Zarrok, H.; Al-deyab, S.S.; Zarrouk, A.; Salghi, R.; Hammouti, R.B.; Oudda, H.; Bouachrine, M.; Bentiss, F. Int. J. of Elect. Sci. 2012, 7, 4047-4063. /irchart.pdf[Accessed: 12/03/2016].
- Benali, O.; Benmehdi, H.; Hasnaoui, O.; Selles, C.; Salghi, R. J. of Mats. & Environ. Sci. 2013, 4(1), 127–138.

This work is licensed under a Creative Commons Attribution 4.0 International License.
![]()
A New Edition of Web of Science
Journal Impact Factor
2022: 0.5
Five Year: 0.8
Journal is Indexed in

Cabells Whitelist
![]()


