Extraction of Trace Cd(II) in Real Samples using Multi Walled Carbon Nanotubes Carboxylate
>Hossain Arefazar1* and Ali Moghimi2
1Department of Physics, South Tehran Branch Islamic Azad University, Tehran, Iran.
2Department of Chemistry, Varamin( Pishva )Branch Islamic Azad University, Varamin, Iran.
Corresponding Author E-mail: dharefazar@yahoo.com
DOI : http://dx.doi.org/10.13005/ojc/320523
In this method to amounting of the trace little amount of Cd (II) ions in aqueos Samples by CNT carboxyl which in order to improve the performance of extraction and preconcentration was used. Amounting of the ions density in solution was performed by the method of FAAS. The effective parameters on extraction effect of pH, the amount and eluent solvent, time of extraction and effect of other cation were optimized. Concentrate factor was found 30 and LOD method of limit of detection was found to 0.07µg.L-1. The relative standard deviation is 0.79% (RSD%).
KEYWORDS:Cd(II); Preconcentration; Solid phase extraction; MWCNTs-COOH; FAAS
Download this article as:| Copy the following to cite this article: Arefazar H, Moghimi A. Extraction of Trace Cd(II) in Real Samples using Multi Walled Carbon Nanotubes Carboxylate. Orient J Chem 2016;32(5). |
| Copy the following to cite this URL: Arefazar H, Moghimi A. Extraction of Trace Cd(II) in Real Samples using Multi Walled Carbon Nanotubes Carboxylate. Orient J Chem 2016;32(5). Orient J Chem 2016;32(5). Available from: http://www.orientjchem.org/?p=21951 |
Introduction
The transition metals including Cd(II) and Pb(II) etc. are an important risk for humans and animals[1–3]. Also heavy metals at trace levels are components of the natural biosphere. Because the main sources of heavy metals for humans and animals are water, food and atmosphere[1,4,5] reliable and sensitive analytical methods and procedures have an important role to evaluate the impacts of metal pollutants. The determination of traces metal ions in these samples are continuously performed in the analytical chemistry laboratories around the world by using various instrumental techniques including atomic absorption spectrometry (AAS), inductively coupled plasma atomic emission spectrometry (ICP-AES) etc. Although, atomic absorption spectrometry and atomic emission spectrometry are among the most widely methods used for trace metal determination, their sensitivity is usually insufficient for monitoring the low level concentrations of metals in the environmental samples. The interfering effects of the matrix components of the samples are the one of the main problems in the determination of traces heavy metals by AAS and or ICP-AES. Also lower elements concentrations than the detection limits of the instrumental technique are another problem in the trace heavy metal determinations in environmental samples. Consequently, a preconcentration/ separation process is usually required[6–10].
Coprecipitation[11–13],membrane filtration[14,15],electrodeposition[16],cloud point extraction [17 ]and solvent extraction[18–21] are the popular methods for the preconcentration and separation of the traces transition metal ions. Solid phase extraction (SPE) of trace metal ions is also an important preconcentration/separation technique[1,22–25].
Although, disadvantages such as significant chemical additives, solvent losses, complex equipment, large secondary wastes, unsatisfactory enrichment factors and high time consumption, limit the application of these techniques. These problems could be addressed by the development of modular and compact processes that provide adequate separation and preconcentration without complex processes. The solvent microextraction technique effectively overcomes these difficulties by reducing the amount of organic solvent as well as allowing sample extraction and preconcentration to be done in a single step. The technique is faster and simpler than conventional methods. It is also inexpensive, sensitive and effective for the removal of interfering matrices. Solvent microextraction is a form of solvent extraction with phase ratio values higher than 100. Compared with the conventional solvent extraction, microextraction may provide poorer analyte recovery, instead the concentration in the organic phase greatly enhances. In addition, the amount of the used organic solvent is highly reduced and only one step of manipulation is necessary, therefore, problems of contamination and loss of analytes vanishes.
Cloud point extraction (CPE)[26–31], homogeneous liquid–liquid extraction (HLLE)[32,33] and single drop microextraction (SDME)[34–38] are fairly new methods of sample preparation which are used in separation and preconcentration of metals and can solve some of the problems encountered with the conventional pretreatment techniques.
There are a number of literature reports dealing with the preconcentration of Cd(II) ions based on SPE, most of which employ chelating groups bound to resins or other polymeric supports [32– 48]. This present work preconcentration of Cd2+ based on the adsorption of its complex on an Multi walled carbon nanotubes carboxylate (MWCNTs-COOH). The adsorbed complex could be eluted using environmentally and the concentration of Cd2+ was determined by FAAS. The influence of various experimental parameters such as acidity, sample volume, flow rate, diverse ions, etc. was examined in detail. The validity of the proposed method was tested in tap water samples and waste water.
Experimental
Instrumentation
Determination of Cd2+ by PG-990 flame atomic absorption spectrometer equipped with HI-HCl according to the recommendations of the manufacturers. These condition are tabulated in( Table 3). The pH measurements used by Sartorius model PB-11.
Chemicals and reagents
Multi walled carbon nanotubes carboxylate (MWCNTs-COOH) were prepared from Darmstadt, Germany of Merck . Method and dried for a week over phosphorus pentoxide in a vacuum desiccators before use. 4-Isocyanatobenzenesulfonyl azide was prepared from 4-carboxybenzenesulfonyl azide via a published procedure [17]. All solutions were prepared with doubly distilled deionized water from Darmstadt, Germany of Merck. C18 powder for chromatography with diameter of about 50 µm obtained from Katayama Chemicals from Supelco. It was conditioned before use by suspending in 4 M nitric acid for 20 min, and then washed two times with water.
Preparation of Multi walled carbon nanotubes (MWCNTs) cartridge
A column 1.5 cm in diameter and 15 cm in length was used for the preconcentration of Cd(II). About 5 g of Multi walled carbon nanotubes cartridge was mixed with 25mL of HCl 1M to form slurry and then loaded on to the column. Cotton was placed at the bottom for allowing Multi walled carbon nanotubes (MWCNTs) cartridge to settle properly. The column was packed up to a height of 3 cm.
Procedure for present method
A 50mg SDS of 50mL was loaded on to the column of neutral Multi walled carbon nanotubes (MWCNTs) cartridge maintaining a flow rate of 8mL min−1. Then 10 µgm Cd(II) solution of 250 ml volume was loaded on to the column. The sample solution was uploading on to the column of neutral Multi walled carbon nanotubes (MWCNTs) cartridge maintaining a flow rate of 0.5mL min−1. The desorption complex and eluted using 10mL of HNO3 4M at a flow rate of 0.5mL min−1 and the concentration of Cd(II) was determined by FAAS.
Results and discussion
Fig.1. show the morphology and size of Multi walled carbon nanotubes (MWCNTs) sorbent as shown in Fig. 1. sorbent retained a homogenous distribution in the range of 156.0–10.0 nm. Fig.2.The formation of MWCNTs was followed by Raman Spectroscopy spectroscopy .the carbonyl vibration appears at 1580 cm-1, while there are fingerprints at 160 cm-1 and 230 cm-1 due to the presence of hydroxyl species at the carbon nanotubes. [23].
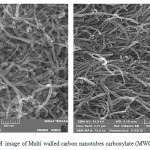 |
Figure 1: SEM image of Multi walled carbon nanotubes carboxylate (MWCNTs-COOH) |
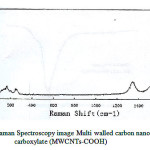 |
Figure 2: Raman Spectroscopy image Multi walled carbon nanotubes carboxylate (MWCNTs-COOH) |
Factor of pH in Preconcentration.
The factor of pH of the aqueous solution on the extraction of 100 ng of each of the cations Cd(II) was studied in the pH rang of 1-10. The effect pH of the solution was adjusted by means of either 0.01 M H NO3 or 0.01M NaOH. The best of recovery Was obtained indicate that complete chelation and recovery of Cu(II) occurs in pH range of 6-8 and that of in 2-9 and are shown in Fig. 3. It is probable that at higher pH values, the cations might be hydrolysed and complete desorption occur. Hence, pH=7.0 in order to prevent hydrolysis of the cations and also keeping on the cartridge C18, was chosen for further research.
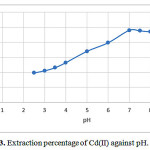 |
Figure 3: Extraction percentage of Cd(II) against pH. |
Choice of the eluent
A reagents were tested in order to desorption complex from the column. In order to choose the most effective eluent for the quantitative recovery of Cd(II), methanol, ethanol, acetone, HCl 1M, HCl 3M ,H3PO4 1M, and Acidified solvents obtained by addition of HNO3 4M, were studied. The recovery of Cd(II) was found to be quantitative with ethanol and HNO3 4M as eluting agents. However, HNO3 4M was preferred owing to its non-inflammability and less toxicity[16,17]. It was observed that when the ratio of HNO3 4M a recovery of 99.8% .
Effect of sample volume
The recovery of the analyte was researched in the range 100–1500mLmaintaining an overall concentration of 0.025 mol L−1 sulfuric acid. The resulting complex was eluted using 10mL of HNO3 4M. As can be seen from the figure, it is evident that the recovery of Cd(II) is more than 97% up to 250mL sample volume. A preconcentration factor of 57 could be attained for more than 97% of Cd(II) when the sample volume was 250 mL.
Effect of flow rate
The flow rate suitable for optimum loading of Cd(II) complex on the Multi walled carbon nanotubes carboxylate (MWCNTs-COOH) cartridge. This could be probably due to the insufficient contact time between the sample solution and Multi walled carbon nanotubes carboxylate (MWCNTs-COOH) cartridge. A flow rate of 5mL min−1 was maintained for the elution of Cd(II) Fig 4.
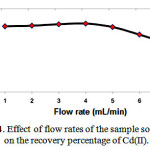 |
Figure 4: Effect of flow rates of the sample solutions on the recovery percentage of Cd(II). |
Precision studies and limit of detection
Under optimized conditions, a calibration curve for Cd (II) was found by preconcentrating a series of Cd (II) standards according to the procedure mentioned. The curve was linear from 1.0 mg/l to 7.0 mg/l for Cd. As analytical figures of merit, The limit of detection was found to be 0.07µg.mL-1.
Effect of foreign ions ions
The influence of common foreign ions on the adsorption of Cd (II) on Multi walled carbon nanotubes carboxylate (MWCNTs-COOH) were studied. In these work, 50.0 ml solutions containing 5ppm of Cd and various amounts of interfering ions were treated according to the suggested procedure. The tolerance level was defined as the maximum concentration of the foreign ion causing a change in the analytical signal no higher than 5%, when compared with the signal of 5ppm copper alone. The results, listed in Table 1 demonstration that the presence of major cations and anions in natural water has no important influence on the adsorption of Cd (II) ions under the designated conditions.
Table 1: Effect of diverse ions on the recovery of 10 µg Cd(II) in a sample volume of 100 Ml
| Ions | added (mg) | (%)Recovery of Cd (II) |
| K+ | 11 | 90.3(1.3)a |
| Ca+ | 0.02 | 90.6(1.6) |
| Mg+ | 1.05 | 90.3(1.9) |
| Na+ | 0.11 | 90.4(2.1) |
| Zn+ | 1 | 90.5(2.2) |
| Cl– | 0.09 | 90.6(1.8) |
| NO3– | 0.5 | 90.1(2.3) |
| SO42- | 0.16 | 90.8(2.6) |
| CH3COO– | 0.1 | 90.2(2.1) |
| Cr2O72- | 0.15 | 90.1(1.6) |
a: Values in parenthesis are CVs based on three individual replicate measurements
Recovery studies in real sample
The accuracy of the proposed method was tested by spiking known concentrations of copper(II) to tap water(Tehran, taken after 10 min operation of the tap), and rain water (Tehran, 21 Jun, 2016) samples. The water samples were filtered and stored in PET bottles. The recovery of Copper(II) was found to be satisfactory with a relative standard deviation of 5% for 3 replicate measurements and the results are shown in Table 2.
Table 2: Analytical results for the recovery of Cd(II) in water samples
| Sample | Cd(II) added (µg) | Found of Cd(II) with FAAS (µg) | GF-AAS |
| (µg) | |||
| Tap Water | 0 | 0.002(1.4) a | 0.003(1.7) |
| 15 | 17.27(1.7) | 17.14(1.9) | |
| 20 | 23.16(1.3) | 22.94(1.6) | |
| Ground water | 0 | 1.24(1.2) | 1.41(1.3) |
| 10 | 21.74(1.1) | 21.93(1.2) | |
| 20 | 29.83(1.8) | 29.78(0.7) | |
| Waste water | 0 | 3.94(1.8) | 3.85(1.7) |
| 5 | 9.63(1.9) | 9.74(0.8) | |
| 15 | 17.85(1.6) | 17.23(1.2) | |
| Synthesis sample 0.2mg of Co2+, Ni2+, Na+ Al3+,Ba2+, Ca2+ | 0 | N.D b | N.D |
| 10 | 15.84(1.8) | 15.73(0.9) | |
| 20 | 26.57(1.2) | 26.46(0.6) |
a: Values in parenthesis are CVs based on three individual replicate measurements
b: Not Detection
Comparison with other solid phase adsorbents
The present method was compared to a variety of solid adsorbents reported recently in the literature. Also, the proposed method was free of interference compared to conventional procedures to determine Cd(II)[49-51]. As can be seen from the references, it is evident that the preconcentration factor obtained with Multi walled carbon nanotubes carboxylate (MWCNTs-COOH) cartridge is comparable to or even better than most of the other chelating matrices. The significant feature of the proposed method is the use of water samples benign HNO3 4 M for the elution of the complex.
Table 3: The operational conditions of flame for determination of Cd
| Slit width | 0.7 nm |
| Operation current of HI-HCL | 5.0 mA |
| Resonance fine | 295.2nm |
| Type of background correction | Deuterium lamp |
| Type of flame | Air/acetylene |
| Air flow | 9.0 mL.min-1 |
| Acetylene flow | 2.7 mL.min-1 |
Calibration curve
The calibration curve of Cd(II) solutions is represented in Fig.5 and the related regression is Y=0.0041X+0.075 providing a correlation coefficient of R2=0.9982.
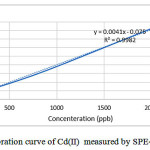 |
Figure 5: Calibration curve of Cd(II) measured by SPE-AAS.
|
Conclusions
The proposed SPE method possesses advantages such as easiness, and considerable selectivity in comparison with the previously reported procedures for isolation and determination of Cd2+ contents [49,50,51]. The highest preconcentration factor attainable was 57 for a 250mLsample volume.In conclusion, the proposed SPE possesses the following advantages: the technique is rapid when compared with the previously reported procedures for the separation and determination of Cd2+, the time taken for the separation and determination of copper in a 500 mL sample is at the most 30 min. Furthermore, it is a simple, highly sensitive, selective and reproducible method for the separation of Cd2+ and in this work the recovery yields obtained with Multi walled carbon nanotubes carboxylate (MWCNTs-COOH)were about 95-100% then it show derivation e.g. in this work Multi walled carbon nanotubes carboxylate (MWCNTs-COOH) is full of potential for use as a adsorbent in the extraction method like SPE and SPME .consequently it can be applied to the preconcentration and determination of Cd2+and the large number of heavy metal that are dangers for human from real samples.
Acknowledgments
We gratefully acknowledge financial of department of chemistry, department of Varamin branch Islamic Azad University for financial support.
References
- de Alcˆantara I.L, Roldan P.S.,. Margionte M.A.L,. Castroa G.R, Padilha C.C.F., Florentino A.O., Padilha P.M., J. Braz. Chem. Soc. 2004 .,15 .,366–371.
- H.W., Qian Y., Kong X.T., Xia S.Q., , Instrum. Sci. Technol. 2004., 32 .,195–205.
- Tan-Kristanto A., Hoffmann A., Woods R., Batterham P., Cobbett C., C. Sinclair,Arabidopsis thaliana, New Phytol. 2003., 159 .,471–477.
- Viard B., Pihan F., Promeyrat S., Pihan J.C., Chemosphere 2004., 55 .,1349–1359.
- Akba O.,. Baysal A, Hamamci C., Merdivan M., Gumgum B., Fresen. Environ.Bull. 2003.,12 1412–1415.
- Nwosu F.O., Adekola F.A., Ibitoye E., Bull. Chem. Soc. Ethiopia 2003 17 (1) 1–9.
- Ferreira A.C., Costa A.C.S., Korn M.G.A., Brazil, Microchem. J. 2004 78 .,77–83.
- Hadjar H., Hamdi B., Kessaissia Z., Desalination 2004., 167 165–174.
- Kiptoo J.K, Ngila J.C., Sawula G.M., Talanta 2004., 64 54–59.
- Minamisawa H., Iizima S., Minamisawa M., Tanaka S., Arai N., Shibukawa M., Anal. Sci. 2004., 20 .,683–697.
- Krishna P.G, Gladis J.M., Rambabu U., Rao T.P., Naidu G.R.K., Talanta 2004 .,63 541–546.
- Wang L., Hu B., Jiang Z., Li Z., Int. J. Environ.Anal. Chem. 2002., 82., 387–393.
- Tokman N., Akman S., Bakircioglu Y., Microchim. Acta 2004., 146 .,31–34.
- Soylak M., Narin I., Divrikli U., Saracoglu S., Elci L., Dogan M., Anal. Lett. 2004., 37., 767–780.
- M.D. Granado-Castro, M.D. Galindo-Ria˜no, M. Garc`ıa-Vargas,Spectrochim.Acta: Part B 2004.,59 577–583.
- He H.B., Zhang W.J., Ma G.Z., Shen H.X., hinese J. Anal. Chem. 2001.,29 (10) 1125–1128.
- Paleologos E.K, Stalikas C.D., Tzouwara-Karayanni S.M., Karayannis M.I., Anal. Chim. Acta 2001., 436 .,49–57.
- Camino M.,. Bagur M.G, Sanchez-Vinas M., Gazquez D., Romero R.,J. Anal. Atom. Spectrom. 2001 16.,638–642.
- Khuhawar M.Y., Lanjwani S.N., J. Chem. Soc. Pakistan.,2001., 23 157–162.
- Tautkus S., Steponeniene L., Kazlauskas R., J. Serb. Chem. Soc. 2004., 69 .,393–402.
- Tautkus S., Chem. Anal. (Warsaw) 2004., 49 .,271–276.
- Moghimi A. ,Chinese Journal of Chemistry, 2007,25, 640.
- Moghimi A, “Chinese Journal of Chemistry ” 2007,25,10, 1536.
- Moghimi A, Shahryar Ghammamy “Environmental chemistry an Indian journal”2007, 2, 3
- Moghimi A Orient. J. Chem.2006,22(3),527.
- Hinze, W.L.; Pramaur, E.; Rev. Crit. ; Anal. Chem. 1993, 24 ,133.
- Moghimi A, Afr J Pure Appl Chem. 2013,7(2), 79-90.
- Paleogos, E.K. ; Giokas, D.L. ; Karayannis, M.I.. ; Trends Anal. Chem. 2005, 24, 426.
- Borges, D.L.G. ; daVeiga, M.A.M.S. ; Frescura, V.L.A. ; Welz, B.; Curtius, A.J. J. Anal. At. Spectrom. 2003,18 , 501.
- Nayebi P.,; Moghimi A. , Orient. J. Chem.2006,22(3),507.
- Zhu, X. ; Zhu, X. ; Wang, B. ; Microchim. Acta 2006,154, 95.
- Ghiasvand, A.R. ; Shadabi, S. ; Mohagheghzadeh, E. ; Hashemi, P. ; Talanta 2005,66,912.
- Sekido E., Chayama K., Muroi M., Talanta 1985,32,797.
- Que M., Kimura K., Shano T., Anal. Chim. Acta 1987,94,293.
- Kolthoff I.M.,. Chantooni M.K, J. Chem. Eng. Data 1993,38,556.
- Majors R.E., LC–GC 1989,4,972.
- Moors M.,. Massart U.L,. Dowall R.D.M.C, Pure Appl. Chem. 1994, 66,277.
- Taylor K.Z., Waddell D.S., E.J. Macpheson, Analytica 1993,67,1186.
- Yamini Y., Ashraf-Khorasani M., High Resolut. Chromatogr. 1997, 17, 634.
- Yamini Y., Shamsipur M., Talanta 1996,43,2117.
- Bjorklund L.B., Morrison G.M., Anal. Chim. Acta 1997,343,259.
- Yamini Y., Alizadeh N., Shamsipur M., Anal. Chim. Acta 1997,355,69.
- Raoufi F., Yamini Y., Sharghi H., Shamsipur M., Microchem. J. 1999,63,311.
- Shamsipur M., Ghiasvand A.R., Yamini Y., Anal. Chem. 1999,71,4892.
- Taher M.A.,. Puri S, Bansal R.K., Puri B.K., Talanta.,1997.,45 .,411–416.
- Shemirani F., Abkenar S.D., J. Anal. Chem. 2004., 59 (4) 327–330.
- Taher M.A., Turk. J. Chem.2003.,. 27 529–537.
- Manzoori J.L,. Karim-Nezhad G, Anal. Sci. 2003.,19 (4) 579–583.
- Bermejo-Barrera P., Nancy M.A., Cristina D.L., Adela B.B., Microchim.Acta 2003., 142 (1–2) 101–108.
- Moghimi Ali; Orient. J. Chem.2006,22(3),527.
- Moghimi Ali.; Ghammamy S. “Environmental chemistry an Indian journal”2007,.2,,3.
- Choi,Y.S.;Choi,H.S.Bull.Korean Chem. Soc. 2003.,24.,222.

This work is licensed under a Creative Commons Attribution 4.0 International License.
![]()
A New Edition of Web of Science
Journal Impact Factor
2022: 0.5
Five Year: 0.8
Journal is Indexed in

Cabells Whitelist
![]()


