Artonin O, a Xanthone Compound from Root Wood of Artocarpus Rigida
Tati Suhartati1*, Ajeng Wulandari1, Jhond F. Suwandi2, Yandri1 and Sutopo Hadi1*
1Department of Chemistry, University of Lampung Jl. S. Brojonegoro No. 1 Bandar Lampung Indonesia 35145.
2Faculty of Medicine, University of Lampung Jl. S. Brojonegoro No. 1 Bandar Lampung Indonesia 35145.
*Corresponding Author E-mail: tati.suhartati@fmipa.unila.ac.id
DOI : http://dx.doi.org/10.13005/ojc/320552
A xanthone derivative, artonin O (1), has successfully been isolated from root wood of Artocarpus rigida grown in Lampung, Indonesia. The structure of this compound has been carefully determined by some spectroscopy techniques and based on physical data. The antibacterial activity test on this compound towards Bacillus subtilis, showed that it has medium activity.
KEYWORDS:A. rigida; antibacterial activity; artonin O; B. subtilis
Download this article as:| Copy the following to cite this article: Suhartati T, Wulandari A, Suwandi J. F, Yandri Y, Hadi S. Artonin O, a Xanthone Compound from Root Wood of Artocarpus Rigida. Orient J Chem 2016;32(5). |
| Copy the following to cite this URL: Suhartati T, Wulandari A, Suwandi J. F, Yandri Y, Hadi S. Artonin O, a Xanthone Compound from Root Wood of Artocarpus Rigida. Orient J Chem 2016;32(5). Available from: http://www.orientjchem.org/?p=22662 |
Introduction
We have previously reported that from the root bark of A. rotunda (Houtt.) Panzer, one of endemic species in Indonesia, obtained from Hutan Raya Bengkulu, has been isolated prenylated flavone, artonin E as well as three xanthone derivatives, artonin O, artonin M and cycloartobiloxanthone, and a geranilated flavone, artoindonesianin L1. A. rigida is part of Artocarpus plant which is also endemic in Indonesia, so the chemistry research about this plant is still interesting. Some organic compounds have successfully been isolated from some parts of A. rigida obtained from Keputran Village, Sukoharjo, Pringsewu Lampung Indonesia. From its root bark, artonin E has been isolated and it has been shown to have good anticancer and antimalaria activities2.
In this work, we reported artonin O which has been isolated from root wood of A. rigida. The antimicrobial activity of this compound has also been tested against B. subtillis.
Experimental
General
The melting point was determined with Gallenkamp melting poin apparatus and is uncorrected. The UV-Vis spectrum was obtained on Agilent Cary 100 spectrometer and the IR spectrum was measured with Agilent Cary 620 FTIR. The 1H and 13C NMR spectra were obtained on Agilent spectrometer with DD2 console system at 500 MHz and 125 MHz, respectively. Mass spectrum was measured with Waters mass spectrometer, LCT Premier XE MS. Vacuum liquid chromatography (VLC) was performed using Merck Si-gel 60, thin layer chromatography (TLC) analysis was carried out on pre-coated Si-gel plates (Merck Kieselgel 60 F254, 0.25 mm).
Plant Collections
Samples of the root wood of A. rigida Blume were collected from Keputran Village, Sukoharjo Pringsewu Lampung and were identified at the Herbarium Bogoriense, Research Centre for Biology, Indonesia Institute of Sciences Bogor, Indonesia and a voucher specimen has been deposited at the herbarium.
Extraction and Isolation
The powder of root wood of A. rigida (3 kg) was extracted exhaustively with n-hexane ( 3 x 10 L) and a mixture of methanol-ethylacetate (EtOAc) 1:1 (3 x 10 L). On removal of the solvents by vacuum rotatory evaporator produced methanol/EtOAc extract (127 g). The methanol/EtOAc extract was then fractioned by Si-gel vacuum liquid chromatography (VLC) and was eluted with EtOAc:n-hexane with the ratio from 0 – 100%, to produce 6 main fractions (A-F), A 3.2 g; B 0.6 g, E 7.8
Fraction A was then subjected with VLC using Si-gel with eluent of EtOAc:n-hexane by increasing the polarity from 10-20%, to produce 5 main fractions based on their TLCs. The fifth fraction (0.33 g) was purified with VLC (Si gel 60 GF254, EtOAc:n-hexane 3-20%) to yield the main compound, artonin O (compound 1) (29 mg). The fractination of fraction B was performed with the same way using eluent of EtOAc:n-hexane 4-20% to yield 3 main fractions. The fractination of the third fraction (0.167 g) with VLC using eluent of EtOAc:n-hexane 3-20%, the red crystal (4.5 mg) was obtained after being recrystallized with EtOAc:n-hexane. This crystal has the same retention time (Rf) with compound 1 based on TLC using three eluent systems. Based on TLC, the total amount of compound 1 obtained was 33.5 mg.
Artonin O (1)
Compound 1, is found to be red needle crystal with melting point of 203-205 oC (decomposed). UV (MeOH) lmax nm (log e): 202 (4.6), 254 (4.3), 317 (4.2); while on the addition of commonly-used shift reagents, did not change the initial spectrum. The IR (KBr) gave nmax. cm-1: 3343 (broad), 2918, 1644, 1467, 1283, 1226, and 1081. HRMS m/z (relative intensity): 503.2059 (M++1, TOF MS ES+ 1.43e+004.
1H NMR (CD3OD) d (ppm): 1.65; 1.67; 1.77; 1.80 (each for 3H, s, H-17, H-22, 6H, s, for H-18,23 and 3H, s, for H-13); 2.61 (1H, dd, J=8 and 17 Hz, H-9); 3.19 (2H, d, J = 7 Hz, H-19); 3.75 (1H, d, J = 8.6 Hz; H-10); 4.54; 4.75 (each for 1H, s, H-12); 5.17; 5.21 (each for 1H, m, H-15 and H-20); 6.46 (1H, s, H-8).
Biological Activity
The antibacterial activity test was performed using paper disc method test.
Results and Discussion
Artonin O
The UV spectrum of compound 1 gave λmax at 202, 254, and 317 nm in methanol, indicated the characteristic of flavone compound. The maximum absorbance at λmax 317 nm is a characteristic spectrum of flavone which is the electron excitation on cynamoil group in B ring, known as Band I, while the λmax at 254 nm is characteristic of electron excitation of benzoyl group on A ring known as band II.
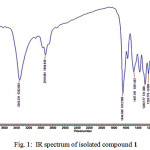
Fig. 1 shows the IR spectrum of compound 1. There is a broad band at 3343 cm-1 which is stretch vibration of hydroxyl group bound to hydrogen. The band at 2918 cm-1 is an indication the presence of C-H aliphatic. The band at 1644 cm-1 indicates the present of carbonyl group (C=O) conjugated with C=C bond. The band at 1467 cm-1 is the present of C=C aromatic, while the bands at 1283, 1226, 1081 cm-1 are indication of stretch of C-O.
 |
Figure 1: IR spectrum of isolated compound 1 |
The IR spectrum of 1 indicated the similarity with spectrum from standard artonin O. It can be seen by comparing the IR spectra of 1 and the standard in literature (Table 1).
Table 1: The comparison of IR data of compound 1 (A) and standard (B)3
|
IR (KBr) (cm-1) |
|
|
A |
B |
|
3343 |
3350 |
|
2918 |
2962 |
|
1644 |
1647 |
|
1467 |
1470 |
|
1283 |
1283 |
|
1226 |
1225 |
|
1081 |
1080 |
The IR spectrum of compound 1 with band at 3343, 2918, 1644, 1467, 1283, 1226, and 1081 cm-1, and UV spectrum (MeOH) lmax 202, 254, and 317 nm showed a similar absorption style to artomunoxantrione epoxide (3)4, artobiloxanthone (4)5, or artonin N (5)6 which shows that compound 1 also contains xanthonoid chromophore5.
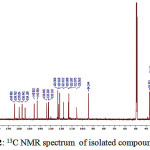
To strengthen the analysis of the structure of the compound isolated, the 13C and 1HNMR were taken and the spectra of 1 obtained are presented in Fig. 2 and 3, respectively. 13C NMR spectrum of 1 shows 30 carbon signals. Based on these chemical shifts, at δ >100 ppm, there are 21 carbon signals which indicate the presence of hybrid orbital sp2 and there are 9 carbon signals at δ <100 ppm indicating the presence of hybrid orbital sp3.
 |
Figure 2: 13C NMR spectrum of isolated compound 1 |
Each carbon signals at δ 181.6; 182.9; and 184.6 ppm are assigned as carbon from carbonyl group, where the signal at 181.6 ppm is known as C signal of carbonyl from C-4 of a flavone compound, while the other two carbon signals are assigned as carbon from carbonyl group of quinoid structure.
The high resolution mass spectrum shows a signal at [M+1]+ m/z 503. Based on this value, compound 1 is known to a xanthone derived from a flavone with B ring quinonly structrured with a frame similar to artonin O, [M+] = 502 with molecular formula of C30H30O7.
Carbon shifts at δ 154.2; 156.9; 157.0; 159.7; and 163.9 ppm indicated the aromatic carbons which bound oxygen. The signals at δ 94.3; 105.6; 113.3; 118.1; 122.7; 132.3; and 145.5 ppm indicate the presence of aromatic C=C, while signals δ 36.7 and 22.9 ppm indicate the aromatic C-C. The shifts at δ 112.9; 121.6; 123.3; 132.1; 133.8; and 142.7 ppm assigned as C=C aliphatic. The signals at δ 17.9; 18.0; 21.8; 22.2; 22.3; 25.9; and 25.9 are assigned for C-C aliphatic7. Based on the data obtained, then the 13C NMR data of compound 1 are suitable for artonin O.
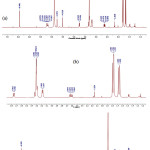
The analyses on the 13C NMR are supported by the 1H NMR of compound 1 (Fig. 3) which shows some chemical shifts and coupling constants of cyclic protons of the ABX type. These signals are d 2.62 (1H, d, J= 8.3 Hz, H-9a), 3.33 (H-9b) (covered by solvent signal), and 3.75 (1H, d, J= 8.3 Hz, H-10).
 |
Figure 3: 1H NMR spectrum of compound 1 (a) normal spectrum and (b) enlarge spectrum |
There are also some aromatic proton signals at d 6.46 (1H, s, H-8) and some proton signals at d 1.65; 1.68 (each at 3H, s, CH3-17, and CH3-22); 1.78 (3H, s, CH3-18); and 1.80 (3H, s, CH3-13); 3.18 (2H, d, J= 7.1 Hz, H-19) and 3.34 (2H, d, J= 6.71 Hz, H-14); 5.17 (1H, m, H-15) and 5.21 (1H, m, H-20) which assigned the presence of two 3,3-dimethylalyl groups attached at C-6 and C-3’.
Furthermore, the proton signals of isoprophenyl groups appeared at d 1.78 (3H, s, CH3-23) and signals at d 4.51; 4.75 (each corresponds to 1H, s, H-12). The comparisons of 13C NMR and 1H NMR spectra for compound 1 with data on literature for artonin O3,8 are tabulated at Table 2.
Table 2: Comparison of 13C NMR and 1H NMR sepctra data compound 1with artonin O3,8
|
13C NMR, δ (ppm) |
1H NMR, δ (ppm) |
|||
|
No C |
Artonin O (CD3OD) |
Compound 1 (CD3OD) |
Compound 1 (CD3OD) |
Artonin O (CD3OD) |
|
2 3 4 4a 5 6 7 8 8a 1’ 2’ 3’ 4’ 5’ 6’ 9 10 11 12 13 14 15 16 17 18 19 20 21 22 23 |
157.2 118.1 181.7 105.6 159.7 113.4 164.0 94.4 157.0 132.5 184.6 122.5 155.1 183.3 145.6 22.9 36.8 142.8 112.9 21.8 22.2 123.3 133.7 25.9 17.9 22.3 121.8 132.2 25.9 18.0 |
157.0 118.1 181.6 105.6 159.7 113.3 163.9 94.3 156.9 132.3 184.6 122.7 154.2 182.9 145.6 22.9 36.7 142.7 112.9 21.8 22.2 123.3 133.8 25.9 17.9 22.3 121.6 132.1 25.9 18.0 |
6.46 (1H, s) 2.62 (1Ha, q, J= 8.3 Hz). 3.33(1Hb, covered by solvent signal) 3.75 (1H, d, J=8.3 Hz) 4.75 (1Ha, s) 4.51(1Hb, s) 1.77(3H, s) 3.34(2H, covered by solvent signal) 5.17 (1H, t, J=7.3 Hz) 1.65 (3H, s) 1.78 (3H, s) 3.18(2H, d, J=7.1 Hz) 5.21 (1H, m) 1.68 (3H, s) 1.80 (3H, s) |
6.45 2.61 3.35 3.75 4.75 4.54 1.77 3.34 5.17 1.65 1.77 3.19 5.21 1.67 1.80 |
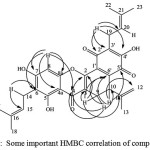
The deduction was also supported by the HMBC spectrum as shown in Fig. 4
 |
Figure 4: Some important HMBC correlation of compound 1 |
Bioactivity Test
Artonin O has shown to have antibacterial activity toward the growth of B. subtilis by the formation of inhibition zone at all concentrations of 0.3; 0.4 and 0.5 mg/disc, with inhibition zone diameters were 7, 7.5 and 8.5 mm, respectively. While amoxicilline used as control positive with concentrations of .05; 0.10; and 0.15 mg/disc, the inhibition zone diameter measured were 20, 22, and 22.5 mm, respectively.
Based on the data obtained, it is known that the higher the concentration of the sample used, the higher the inhibition zone observed, although in overall, the positive controls have also been observed to inhibit much higher. The functional groups of compound 1 that play role on the antibacterial activities are hydroxyl group, carbonyl and isopropenyl. These groups are able to form hydrogen bond with protein from the bacteria cell showing a specific interaction. According to Davis and Stout9, in the antibacterial activity, if the inhibition zone diameter observed is 5 mm or less, it is categorized as weak activity; 5-10 mm as medium activity, 10-19 as strong activity and 20 mm or more categorized as very strong activity. Based on the data obtained in this research, therefore artonin O is categorized as medium activity in the antibacterial activity test.
Table 3: The measurement result of inhibition zone from artonin O against B. subtilis with incubation time of 24 hours
|
Compound |
Inhibition Zone (diameter, mm) |
||
| 0.3 mg/disc | 0.4 mg/disc | 0.5 mg/disc | |
| Artonin O |
7 |
7.5 |
8.5 |
| Amoxicilline (+) |
20 |
22 |
22.5 |
| Methanol (-) |
0 |
0 |
0 |
Conclusions
From the root wood of A. rigida has successfully been isolated a xanthone compound, artonin O (1) showing medium antibacterial activity towards B. subtillis.
Acknowledgments
The authors are grateful to Directorate of Research and Community Services, Directorate General of Higher Education, The Ministry of Research, Technology and Higher Education, Republic of Indonesia that provide fund for this project to be undertaken through Hibah Kompetensi (Competitive Research Grant) Scheme 2016 with contract number of 78/UN26/8/LPPM/2016, 13 April 2016.
References
- Suhartati, T.; Achmad, S.A.; Aimi, N.; Hakim, E.H.; Kitajima, M.; Takayama, H.; Takeya, K. Fitoterapia 2001, 72, 912-918.
- Suhartati, T.; Yandri; Hadi. S. Eur. J. Sci. Res. 2008, 23 (2), 330-337.
- Suhartati, T. Phenol of Some Species of Jack Fruit Plant in Indonesia (Dissertation). ITB. Bandung, 2001. (in Indonesian)
- Lin, C.-N.; Shieh, W.-L.; Jong, T.-T., Phytochemistry 1992, 31(7), 2563-2564.
- Sultanbawa, M.U.S.; Surendrakumar, S., Phytochemistry 1989, 28(2), 599-605.
- Hano, Y.; Inami, R.; Nomura, T. Heterocycles 1993, 35 (2), 1341-1350.
- Jacobsen, N.E. NMR Spectroscopy Explained : Simplified Theory, Application and Examples for Organic Chemistry and Structural Biology. John Wiley and Sons. England. 2007.
- Suhartati, T.; Achmad, S.A.; Aimi, N.; Hakim, E.H., J. Mat. Sains, 1999, 4(2), 178-184.
- Davis, W.W.; Stout, T.R. Appl. Microbiol. 1971, 22 (4), 659–665.

This work is licensed under a Creative Commons Attribution 4.0 International License.


