An Electrochemical Study of POPC Phospholipid Bilayers in A Cell Membrane
Department of Chemistry, Science and Research Branch, Islamic Azad University, Tehran, Iran.
Corresponding Author E-mail: m_monajjemi@srbiau.ac.ir
DOI : http://dx.doi.org/10.13005/ojc/320530
Download this article as:
![]()
In this study, we have shown the model of a microscale dielectric membrane capacitor including POPC structures. We have shown that has appeared in a small free space of the membrane thickness due to number of phospholipids layers. In addition, we have specifically investigated the quantum and coulomb blocked effects of different thickness. Furthermore, the electron density profile models, electron localization function (ELF) and local information entropy have been applied as a formal way to studies the interaction of protein with lipid bilayers in cell membrane.
KEYWORDS:variable capacitor; lipid bilayers; POPC; cell membrane
Introduction
1-palmitoyl-2-oleoylsn-glycero-3-phosphocholine bilayers (POPC) has important rule in the electrochemical properties of a cell membrane in the fluid phase. The composition of a cell membrane directly affects cell membrane functions include membrane permeability, cell signaling, and cell capacitance1-2 . Volke and Pampel were the first to report that cross peaks between the lipid 1-palmitoyl-2- leolyl-sn-glycero-3-phosphocholine (POPC) and water at a concentration of nine water molecules per POPC have negative intensity, compared to positive intensity for all lipid–lipid cross peaks3 . The laboratories of Stark confirmed that cross peaks between water and lipid head groups have negative intensity, but the cross peak to the methylene resonance of hydrocarbon chains was weak and positive4 . The lipid portion of the membrane serves various barrier functions, preventing most molecules and ions from passing in or out. The membrane covered on both sides by collections of charged dissolved minerals, which serve the same function as a conducting metal plate. Because the exterior cell membrane, like the mitochondria in animals and the chloroplasts in plants are biological capacitors they have the capacity to accumulate and store charge and hence energy to be given up when needed. Since energy is needed to run any type of machinery is mechanical or biological it makes sense that nutrients that can enhance energy production and energy storage can have profound biological effects. Many properties such as cholesterol’s impact, heat capacity changes due to increasing salt concentration and correlative lipid motion during diffusion, thickness fluctuations and bilayer undulations have been studied for lipid membrane1-3 . Local interaction of membrane proteins and lipids as well as the impact of fluorescent probes on bilayer properties has also been investigated by atomistic MD simulations5-9 . Except a few causes, it is mostly believed that the lipid bilayer itself is impermeable to, ions, and molecules10 . Therefore charged molecules must cross through ion channels. Ion channels are transmembrane protein molecules that contain aqueous pores connecting the inside of the cell to the extracellular space. These channels can open and shut in response to a variety of signals. The passage of charged molecules through ion channels in the cell membrane endows the membrane with an electrical conductive property allowing for inward and outward current flows11 This is one factor that establishes electric circuits in biological tissues. So, electrophysiology and dynamic behavior of phospholipids consider the membrane to be a variable capacitor, and ion channel proteins are regarded as electrical resistors. The nerve pulse, for instance, is considered as a propagating segment of charged capacitor loaded by currents through the channel proteins12. The natural properties of membrane structures enable cell components and whole cells to oscillate and interact resonantly with other cells. According to Smith and Best13, the cells of the body and cellular components possess the ability to function as electrical resonators. The outcome of receptor activation may: increase the transport of certain molecules or mineral ions from one side of the cell membrane to the other side; increase or inhibit the activity of enzymes involved in metabolic synthesis or degradation; activate genes to produce certain proteins; turn off gene production of other proteins or cause cytoskeletal proteins to change the shape or motility of the cell. When the receptor protein switches back to its inactive conformation it will detach from the effector proteins/enzymes and the signal wills cease14. The soluble signaling molecules may be produced in distant sites by endocrine cells or are secreted by cells embedded such as macrophages, T-cells and B-cells. When these soluble signaling molecules are presented to the organ cells they can either activate or inhibit cellular metabolic reactions by activating cell membrane or cytoplasmic glycoprotein receptors15 . Cell receptors can also be activated by electric fields or vibrational resonance that has particular frequencies and amplitudes through a process known as electro-conformational coupling16 . Electrical oscillations of the right frequency and amplitude can alter the electrical charge distribution in cell receptors causing the cell receptors to undergo conformational changes just as if the receptor was activated by a chemical signal. A number of membrane proteins as well as DNA consist of helical coils, which may allow them to electronically function as inductor coils. Because of membrane proteins and DNA function as electrical inductors they may enable the cell to transiently produce very high electrical voltages. The cell membrane is a leaky dielectric which means that any condition, illness or change in dietary intake that affects the composition of the cell membranes and their associated minerals can affect and alter cellular capacitance.
Theoretical background
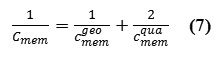
In the case of thin-membrane configurations, this counters the geometric capacitance, is related to the applied voltageΔVmem, ,as
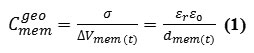
where σ is the surface charge density of membrane,εo is the permittivity of free space ∼8.85 × 10⁻¹² F.m−1, and dmem(t) is the thickness expectation filling by the alkylschain as a dielectric of the membrane phospholipids. The membrane variable capacitance,Cmem(t) , defines how much charge,q , is stored on two capacitor plates at a fixed membrane voltage as a function of time,{Vmem(t)}. Obviously, quantum electrical characteristics should be considered because of the nano scale property in a membrane cell.
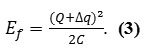
In our model, a small capacitor of cell membrane is made by creating an insulating layer of alkyl between two phosphate groups. We assume that the capacitor electrodes carry±Q charges from one electrode towards the opposite side. So the initial energy stored in the electrostatic field between the capacitor plates is given by
![]()
By letting the electrons tunnel through the insulating layer from the negative terminal to the positive terminal, such that the charge (Q+∆qe) resides on the top plate and (−Q −∆qe) resides on the bottom plate, the stored energy in this situation is now .
For small systems, the capacitance may be so trivial that the charging energy
![]()
becomes great and the energy value for tunneling into the quantum system would then increase.
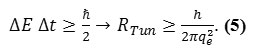
The tunneling resistance17-22 can be assumed to be
![]()
which not a usual resistance, however, is theoretically allowing electrons to cross the insulating junction as discrete occurrences where “I” is the resulting current due to the tunneling effect. Tunneling resistance is not an usual resistance, but an imaginary one, allowing the electrons to cross the insulating junction during
![]()
where CQ is the quantum capacitance and is t a characteristic time associated with tunneling events which is considered to be the approximate lifetime of the energy state of the electrons (on one side of the barrier). The Rtun, should be finite and not too big, so that tunneling can practically take place. In this case, the charge is said to be well quantized and the capacitor is considered to be a tunnel junction in the membrane.
In this work we have calculated the RTun for the membrane as a function of the thickness of and difference in potential energy barrier between the electrodes (Via the uncertainty relationship between time and energy,
The hybrid capacitance and then quantum capacitance are related to the net capacitance,Cnet , through the relation
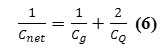
and the value of CQ is many orders of magnitude greater than the Cg. Hence, its effect usually appears only in quantum systems.
In this work, we show that in the fluid mosaics of lipids the dielectric constant for a membrane has changed time by time while the changing of capacitance is not fast and is depended to the situation of membrane processing. Quantum effect in the lipid membrane implies that the capacitance of the membrane is larger than that of the geometry membrane shows us. Thus, any phenomenon in the bio-membrane related to the dynamic behavior such as physiological temperature will influence its capacitance.
We exhibit the cellular electrical properties and electromagnetic fields effects on cells cases the electro biological phenomenon such as ligand receptor interactions of hormones, alteration of mineral entry through the cell membrane and activation or inhibition of cytoplasmic enzyme reactions.
We show here that the quantum effect is able to change the capacitance membrane due to any external phenomenon. We also show how the electrical properties of the membrane are affected by the application of electron density arising from Phosphors in the phospholipids in a membrane. This gives rise to phosphors-induced capacitive currents or phosphors-induced voltage changes. The hybrid and quantum capacitances are related to the net capacitance,Cmem , through the relation indicated in equation (2) and scheme 1:
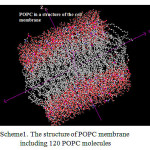 |
Scheme 1: The structure of POPCmembrane including 120 POPC molecules |
Thomas Heimburg and coworkers have shown that the voltage changes during the nerve pulse are actually related to changes in capacitance and a transition voltage is able to change the dimensions of a membrane and the capacitance. They also show how the electrical properties of the membrane are affected by the application of lateral pressure or tension in a membrane23-25 furthermore the assumption of constant capacitance is incorrect, especially if one is close to chain melting transitions in the lipid membrane26.
In this works we assumed that the
![]()
of bio-cell membranes (in contrast of
![]()
is independent of voltage and only is dependent to geometry so that the second term on the right of this equation is a quantum effect
![]()
Consider a membrane with variable thickness between d1 and d2, the capacitances will be changed between
![]()
and
![]()
and two transmembrane voltages of V1 and V2.The two fields across the membrane are
![]()
and
![]()
and the section of charges is
![]()
Electron localization function (ELF)
The lack of an absolute scale has often greatly hindered the interpretation of membrane profiles,particularly with regard to the distribution of the protein molecules.
In this work it has been described a novel method ofthe step-function models for the membrane electron density profile in the composition of the lipids. In this work we have focused on the electron density of the systems when the phospholipids have been created one by one in two side of membrane upper lateral side (+) and downer lateral side(-).
The electron density has been defined as
![]()
Where ηi is occupation number of orbital i, φ is orbital wave function, χ is basis function. C is coefficient matrix, the element of ith row jth column corresponds to the expansion coefficient of orbital j respect to basis function i. Atomic unit for electron density can be explicitly written as e/Bohr3.
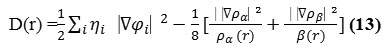
Bader27found that the regions which have large electron localization must have large
magnitudes of Fermi-hole integration. However, the Fermi hole is a six-dimension function and
thus difficult to be studied visually. Becke and Edgecombe noted that spherically averaged likespin conditional pair probability has direct correlation with the Fermi hole and then suggested electron localization function (ELF) 28.
![]()
where
and
![]()
for close-shell system, since
![]()
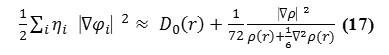
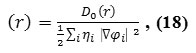
D and D0 terms can be simplified as
and
![]()
Savinet al. have reinterpreted ELF in the view of kinetic energy29, which makes ELF also meaningful for Kohn-Sham DFT wave-function or even post-HF wave-function. They indicated that D(r) reveals the excess kinetic energy density caused by Pauli repulsion, while D0(r) can be considered as Thomas-Fermi kinetic energy density. Since D0(r) is introduced into ELF as reference, what the ELF reveals is actually a relative localization.
ELF is within the range of [0, 1]. A large ELF value means that electrons are greatly localized, indicating that there is a covalent bond, a lone pair or inner shells of the atom involved. ELF has been widely used for a wide variety of systems, such as organic and inorganic small molecules, atomic crystals, coordination compounds, clusters, and for different problems, such as the
revealing atomic shell structure, classification of chemical bonding, verification of charge-shift bond, studying aromaticity.
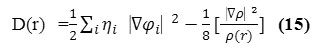
Notice that there is a deficiency of ELF, sometimes with r going beyond from molecular boundary, D(r) decreases faster than D0(r) and then ELF reaches 1 (completely localized).
To overcome the problem, Multiwfn automatically adds a minimal value 10-5 to D(r). This treatment almost does not affect the ELF value in interesting regions30. In which the actual
kinetic energy term in D(r) is replaced by Kirzhnits type second-order gradient expansion, that is
so that ELF is totally independent from wave-function, and then can be used to analyze electron density from X-ray diffraction data. Of course Tsirelson’s ELF can also be used to analyze electron density from quantum chemistry calculation, but is not as good as the ELF defined by Becke owing to the approximation introduced in kinetic energy term; however, qualitative conclusions can still be recovered in general.
Localized orbital locator (LOL) is another function for locating high localization regions likewise ELF, defined by Schmider and Becke in the paper31. , where ,
![]()
where,
for spin-polarized system and close-shell system are defined in the same way as in ELF. LOL has similar expression compared to ELF. Actually, the chemically significant regions that highlighted by LOL and ELF are generally qualitative comparable, while Jacobsen pointed out that LOL conveys more decisive and clearer picture than ELF32. Obviously LOL can be interpreted in kinetic energy way as for ELF; however LOL can also be interpreted in view of localized orbital. Small (large) LOL value usually appears in boundary (inner) region of localized orbitals because the gradient of orbital wave-function is large (small) in this area.
Computational details
A part of membrane systems including POPC phospholipids have been modeled via QM/MM simulation using Monte Carlo method. Each system was composed of 120 lipid molecules including water molecules.At finite temperature, clusters have finite vapor pressures, and particular cluster sizes are typically unstable to evaporation. Introducing a constraining potential enables one to define clusters of desired sizes.
Each of 120POPC molecules, were carried out with the lateral dimensions of the simulation cell {Lx}, {Ly} and three-dimensional periodic boundary conditions were applied, and the cell length normal to the membrane {Lz} was allowed to adjust during the simulation to maintain a constant normal pressure of 1 atm. The pressure was maintained by a variant of the extended system formalism, the Langevin Piston algorithm, which reduces oscillations in the cell parameters. The temperature was maintained at 300 K, well is the body temperature and identical to the relevantexperiments.Configurations of individual lipids consistent with a mean field were generated by Monte Carlo (MC) simulation, with field values adjusted to obtain agreement with experimental order parameters.
In this investigation, differences in force field are illustrated by comparing the calculated energy by using force fields AMBER and OPLS. Furthermore HyperChem professional release 7.01 is used for the calculations.
The final parameterization of POPC was computed using self-consistent field calculations in order to find the optimal starting geometry, as well as the partial charges. We employed density functional theory with the van der Waals density functional to model the exchange-correlation energies of POPC monomers.
All optimization of POPCmonomer were performed by Abinitio software.We have mainly focused on getting the results from DFT methods such as m062x, m06-L, and m06 for the (POPC). The m062x, m06-L and m06-HF are rather new DFT functional with a good correspondence in non-bonded calculations between POPC monomers and are useful for the energies of distance between two fragments in phospholipids 33.
For non-covalent interactions, the B3LYP method is unable to describe van der Waals33,34 membrane systems by medium-range interactions such as the interactions of two POPC.
So the ONIOM methods including 3 levels of 1-high calculation (H), 2-medium calculation (M), and 3-low calculation (L) have been performed in our study for calculating the non-bonded interactions between phospholipids. The ab-initio and DFT methods are used for the model system of the ONIOM layers and the semi empirical methods of Pm6 (including pseudo=lanl2) and Pm3MM are used for the medium and low layers, respectively. The semi empirical methods have been used in order to treat the non-bonded interactions between two parts of upper lateral phospholipids side (P+ ) and downer lateral phospholipids side (P_ ).
B3LYP and the most other popular functional are insufficient to illustrate the exchange and correlation energy for distant non-bonded medium-range systems correctly. Moreover, some recent studies have shown that inaccuracy for the medium-range exchange energies leads to large systematic errors in the prediction of molecular properties.
Geometry optimizations and electronic structure calculations have been carried out using the m06 (DFT) functional. This approach is based on an iterative solution of the Kohn-Sham equation35 of the density functional theory in a plane-wave set with the projector-augmented wave pseudo-potentials. The Perdew-Burke-Ernzerhof (PBE)36 exchange-correlation (XC) functional of the generalized gradient approximation (GGA) is adopted. The optimizations of the lattice constants and the atomic coordinates are made by the minimization of the total energy.
The charge transfer and electrostatic potential-derived charge were also calculated using the Merz-Kollman-Singh37, chelp38 , or chelpG39.
The charge calculation methods based on molecular electrostatic potential (MESP) fitting are not well-suited for treating larger systems whereas some of the innermost atoms are located far away from the points at which the MESP is computed.
In such a condition, variations of the innermost atomic charges will not lead towards a significant change of the MESP outside of the molecule, meaning that the accurate values for the innermost atomic charges are not well-determined by MESP outside the molecule . The representative atomic charges for molecules should be computed as average values over several molecular conformations.
The interaction energy for capacitor was calculated in all items according to the equation 19:
![]()
Where the “ΔES ” is the stability energy of membrane capacitor.
The electron density (Both of Gradient norm and Laplacian), value of orbital wave-function, electron spin density, electrostatic potential from nuclear atomic charges, electron localization function (ELF), localized orbital locator (LOL defined by Becke and Tsirelson), total electrostatic potential (ESP), as well as the exchange-correlation density, correlation hole and correlation factor, and the average local ionization energy using the Multifunctional Wave-function Analyzer have also been calculated in this study40-42.
We used Multiwfn software to draw the contour line map41,42. The solid lines indicate positive regions, while the dash lines indicate negative regions. We have plotted the contour line corresponding to vdW surface (electron density=0.001 a.u., which is defined by R. F. W Bader). This is useful to analyze distribution of electrostatic potential on vdW surface. Such a contour line has also been plotted in gradient line and vector field map by the same option. Color, label size and line style of the contour line can be changed based on models.
The relief map was used to present the height value at every point. If the values are too large, they will be truncated in the graph. Therefore, it can be chosen to scale the data with a factor to avoid truncation. The graph is shown on interactive interface.Shaded surface mapand shaded surface map with projection are used in our representation of height value at each situation40-42 .
We have applied our previous works43-73 and some other methods74-77 to exhibit a simple form of biophysical chemistry in a new field of bioelectronics biochemistry interactions.
Result and discussion:
The POPC molecule including 43 atoms is shown in scheme2. It has been shown in the table 1; the electrical properties can result from changes in the internal conformation of the lipid as measured by the chain dihedral distributions. Electron density, energy density and Potential energy density for rotation about the α, β and γ angles were calculated from the angular distributions of each simulation in the Table1 and all data have curved in 6 figures.
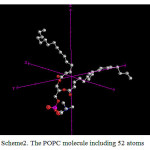 |
Scheme 2: The POPC molecule including 52 atoms |
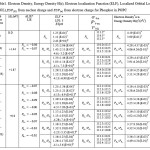 |
Table 1: Electron Density, Energy Density H(r),Electron localization Function (ELF), Localized Orbital Locator (LOL), from nuclear charge and from electron charge for Phosphor in POPC |
Based on eq.19 the larger of electron localization is in a top small region of Fig.1,the more likely the electron motion is confined within it. If electrons are completely localized in the POPC, then they can be distinguished from the ones outside. As shown in table 1 the large ELF is near the point of 163 atoms Fig2. As the regions which have large electron localization must have large magnitudes of Fermi-hole integration, so this phenomena leads the membrane towards upper lateral phospholipids side (P+ )with exceed electrons and downer lateral phospholipids side (P_ ) with exceed holes Fig.3, however, the fermi hole is a six-dimension function and thus difficult to be studied visually. Based on equations 12, 13 and 14, Becke and Edgecombe noted that spherically averaged likespin conditional pair probability has direct correlation with the fermi hole which it is suitable correspond to our data in table 1.
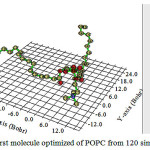 |
Figure 1: The first molecule optimized of POPC from 120 simulated molecules |
ELF reveals is actually a relativelocalization and must be accounted within the range of [0, 1].
A large ELF value means that electrons are greatly localized, indicating that there is a covalent bond, a lone pair or inner shells of the atom involved.
Based on eq.16, LOL can be interpreted in kinetic energy way as for ELF; however LOL can also be interpreted in view of localized orbital. Small (large) LOL value usually appears in boundary (inner) region of localized orbitals because the gradient of orbital wave-function is large (small) in this area. The value range of LOL is identical to ELF, namely [0, 1].
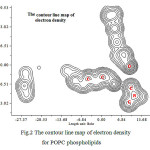 |
Figure 2: The contour line map of electron density for POPC phospholipids |
LOL has similar expression compared to ELF. Actually, the LOL conveys more decisive and clearer picture than ELF. In table.1 the LOL is low and constant for both lateral phospholipids sides (P± ) (Fig.3). The results of ELF and LOL indicate that the phospholipids membrane starting to become a capacitor in any scales from nano to micro and medium scales.
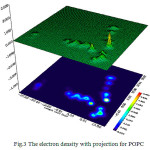 |
Figure 3: The electron density with projection for POPC
|
As shown in the Figure 4, the torsional distributions are independent of the free space between two layers in a dynamic situation this free space is a suitable distance for coulomb blockade and tunneling events. Evidently, as the surface area is increased, the membrane thins sufficiently to maintain essentially the same environment for the alkyl chains (the bilayer
interior is similar “but not, clearly” to a liquid alkane in terms of chain conformations).
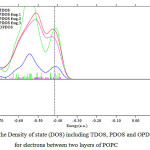 |
Figure 4: the Density of state (DOS) including TDOS, PDOS and OPDOS for electrons between two layers of POPC |
Expectation of dielectric thickness based on a Gaussian’s curve distribution has been calculated as 37.98 for 120 POPC of the membrane. Electron density profiles, displayed in Figure 5, were calculated from the electron density profile models by dividing the simulation cells into 0.1 Å slabs and determining the time-averaged number of electrons in each slab. The peaks show the position of the electron-rich phosphate section of the head group and the peak-to-peak distance (XHH) is often used to infer the molecular length or changes in length from the experimental.
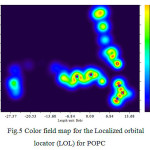 |
Figure 5: Color field map for the Localized orbital locator(LOL) for POPC |
In this study,POPC was chosen as a membrane capacitor sincethe alkyl groups is an excellent spacer close to that of biological phenomenon.Since the alkyl chain in membrane cell is an ideal electrical insulator that can be polarized by applying an external electric field, the expectation thickness of alkyl layers between the membrane plates (which has a dynamic behavior) has been calculated and optimized as a suitable simulation of dielectrics for capacitance calculation Table 2.
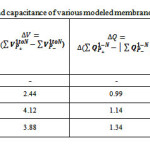 |
Table 2: Dielectric constant and capacitance of various modeled membrane capacitors.
|
Similar to other capacitors, the anisotropic binding of alkyl allows for the formation of various layered structures. Long-range interlayer interactions play a dominant role in characterizing the structural and mechanical properties of these systems and hence their performance in the simulation of our capacitor models.
As shown in Fig.5&6 there are fluctuation within a decreasing amount for electron density, energy density, ELF and LOL while there is no fluctuation for ESP and it is periodic. In The ESP Curve versus number of Phospholipids a minimum has been occurred in the curve corresponds on add numbers while for the even numbers there are similar values which indicates that the variable capacitance in a membrane is independent of number of phospholipids .in other words the external phenomenon of the cells makes the variable capacitance, not the quantity of internal structures such as number of phospholipids.
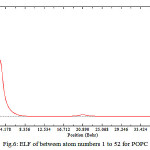 |
Figure 6: ELF of between atom numbers 1 to 52 for POPC |
The values of the distances between two phospholipid layers, dielectric constants of the layered alkyl (k), difference magnitude of the charges on the plates,electrostatic properties using the SCF density, fitting point charges to electrostatic potential charges from ESP fit,the stability energy of capacitor (eV),variousthickness including the net capacitance and the potential difference between two electrodes of membrane plates (upper and downer lateral phospholipids side) are listed in Tables 2, 3.
The potential energy difference between the two layers,
![]()
(a.u.) are depicted in table2 and varies between 3.11 and 14.75 volts for various thickness and number of phospholipids, which leads to the accumulation of approximately identical amount of surface charges of the opposite sign.
Here we have considered the interlayer attraction using OM/MM with an Oniom methods including OPLS (CHARMM), force field and Extended-Huckel for specific layers to describe its interlayer interactions including inter-layer potential, attractive components and the classical mono-polar electrostatic terms.
In this study, via the number of alkyls and volume of membrane, the expectation of area for the upper and downer lateral phospholipids side (P+ )(pales), have been calculated as
![]()
which
![]()
is between 100-1000 range is changed.
The nano-capacitances of “Cg”, “Cq” and Cnet for various number of POPC in different thickness of dielectric are listed in table3.
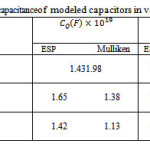 |
Table 3: The capacitance of modeled capacitors in various charges |
Although the dielectric strength can be deduced from the band gap of alkyl spacer, here we have calculated the dielectric constant straightaway from eq.5 that is much more accurate than the other methods.
It is debatable that for alkyl spacer containing a few layers, the different voltages between two electrodes would depend on various conditions such as non-equilibrium state and dynamic situation of the coupling between each POPC and adjacent POPC, etc. It however requires a thorough analysis.
The electric fieldsinduce dipole movements which is a function of polarization processes and the strength of the electric field. When biological tissue is exposed to an electric field in the right frequency and amplitude windowsa preferential alignment of dipoles becomes established. Bio-membranes are thin capacitors with the unique feature of biological energy storage in a physiologically relevant phenomenon. Resonance communication mechanisms are depended to interaction between membrane capacitors and helical proteins. When high frequency fields are applied with external signal generators this results in charging of the cell membranes causing an increase in cell membrane capacitance and increased conduction of current through the cell membranes. Because cell membranes naturally have capacitance this makes the cell membrane frequency-dependent conductors.
References
- Roark, M.; Feller, S.E. J. Phys. Chem. B 2009, 113, 13229–13234.
- Lindahl, E.; Edholm, O. Biophys. J. 2000, 79, 426–433.
- Volke, F; Pampel, A,Biophys J, 1995 68:1960–1965.
- Zhou, Z; Sayer, BG; Hughes, DW; Stark, RE; Epand, RM;.Biophys j, 1999, 76:387–399
- Hub, J.S.; Aponte-Santamaría, C.; Grubmüller, H.; de Groot, B.L. Biophys. J. 2010, 99, L97–L99.
- Pöyry, S.; Cramariuc, O.; Postila, P.A.; Kaszuba, K.; Sarewicz, M.; Osyczka, A.; Vattulainen, I.;Róg, T. Biochim. Biophys.Acta2013, 1827, 769–778.
- Hölttä-Vuori, M.; Uronen, R.L.; Repakova, J.; Salonen, E.; Vattulainen, I.; Panula, P.; Li, Z.; Bittman, R.; Ikonen, E. BODIPY-cholesterol: Traffic 2008, 9, 1839–1849.
- Repáková, J.; Holopainen, J.M.; Karttunen, M.; Vattulainen, I. J. Phys. Chem. B 2006, 110, 15403–15410.
- Vanselow, K. 1966. Med. Biol. Elektronik. 11:1–5.
- Heimburg, T. 2010..Biophys. Chem. 150:2–22.
- Aidley DJ, Stanfield PR. Ion Channels: Molecules in Action. Cambridge, UK: Cambridge University Press, 1996
- Hodgkin, A. L., and A. F. Huxley. 1952. J. Physiol. 117:500–544.
- Smith C, Best S. Electromagnetic Man. New York: St. Martin’s Press, 1989.
- Van Winkle LJ. Biomembrane Transport. San Diego, CA: Academic Press, 1995
- Reichart LF. Oxford, England: Oxford University Press, pgs. 335-344, 1999.
- Tsong TY. Trends in Biochemical Sciences 1989;14:89-92
- D. V. Averin , K. K. Likharev, in Mesoscopic Phenomena in Solids, edited by B. L. Altshuler, P. A.
- R. P. Andres, T. Bein, and M. Dorogi, Science 272, 1323 ,1996.
- E. S. Soldatov, V. V. Khanin, A. S. Trifonov, D. E. Presnov, S. A. Yakovenko, G. B. Khomutov, G. P. Gubin, and V. V. Kolesov, JETP Lett. 64, 556 ,1996.
- K.-H. Park, J. S. Ha, W. S. Yun, M. Shin, K.-W. Park, and E.-H. Lee, Appl. Phys. Lett. 71, 1469 ,1997
- D. L. Klein, P. L. McEuen, J. E. Bowen Katari, R. Roth, and A. P. Alivisatos, Appl. Phys. Lett. 68, 2574, 1996.
- D. C. Ralph, C. T. Black, and M. Tinkham, Phys. Rev. Lett. 76, 688, 1996.
- Heimburg, T., and A. D. Jackson. 2005. Proc. Natl. Acad. Sci. USA. 102:9790–9795.
- Heimburg, T., and A. D. Jackson. 2007. Biophys. Rev. Lett. 2:57–78.
- Lautrup, B., R. Appali, ., T. Heimburg. 2011. Eur. Phys. J E Soft Matter. 34:1–9.
- Thomas Heimburg, Biophysical Journal Volume 103 September 2012 918–929
- R.F.W. Bader, atoms in Molecule: A quantum Theory (Oxford Univ. press, Oxford, 1990).
- Becke and Edgecombe J. Chem. Phys., 92, 5397
- Savin et al Angew. Chem. Int. Ed.Engl., 31, 187,]
- Tsirelson and Stash, Chem. Phys. Lett., 351, 142
- Schmider and Becke , J. Mol. Struct. (THEOCHEM), 527, 51
- Jacobsen Can. J. Chem., 86, 695
- Zhao Y, Truhlar DG (2008) TheorChem Account 120:215–241, DOI 10.1007/s00214-007-0310-x
- Zhao Y, Truhlar DG (2008). 41, (2): 157-167
- Kohn W, Sham LJ (1965). Phys. Rev (140) A: 1133-1138
- Perdew J P, Burke K and Ernzerhof(1996). Phys. Rev. Lett. (77): 3865-3868
- Besler BH, Merz KM, Kollman PA (1990)J. comp. Chem (11): 431-439,
- Chirlian LE, Francl MM (1987). J.comp.chem (8): 894-905, DOI: 10.1002/jcc.540080616
- Brneman GM, Wiberg KB (1990) J. Comp Chem (11): 361
- Lu T, Chen F (2011) Calculation of Molecular Orbital Composition, ActaChim. Sinica, 69, 2393-2406
- Lu T, Chen F (2012) Quantitative analysis of molecular surface based on improved Marching Tetrahedra algorithm, J. Mol. Graph. Model (38): 314-323
- Lu T, Chen F (2012) Multiwfn: A Multifunctional Wavefunction Analyzer, J. Comp. Chem. (33) 580-592
- Monajjemi, M.; Lee, V.S.; Khaleghian, M.; B. Honarparvar, B.; F. Mollaamin, F. J. Phys.Chem C. 2010, 114, 15315
- Monajjemi, M.Struct Chem.2012, 23,551–580
- Monajjemi, M.; Boggs, J.E. J. Phys. Chem. A, 2013,117,1670 −1684
- Mollaamin, F.; Monajjemi, M, Journal of Computational and Theoretical Nanoscience. 2012, 9 (4) 597-601
- Monajjemi, M.; Khaleghian, M, Journal of Cluster Science. 2011, 22(4), 673-692318
- Monajjemi, M. Chemical Physics. 2013, 425, 29-45
- Monajjemi, M.; Wayne Jr, Robert. Boggs, J.E. Chemical Physics.2014, 433, 1-11
- Monajjemi, M.; Mollaamin, F. Journal of Computational and Theoretical Nanoscience, 2012, 9 (12) 2208-2214
- Monajjemi, M. Falahati, M.; Mollaamin, F.; Ionics, 2013, 19, 155–164
- Monajjemi, M.; Mollaamin, F. Journal of Cluster Science, 2012, 23(2), 259-272
- Tahan, A.; Monajjemi, M. Acta Biotheor,2011, 59, 291–312
- Lee, V.S.; Nimmanpipug, P.; Mollaamin, F.; Kungwan, N.; Thanasanvorakun, S.; Monajjemi, M. Russian Journal of Physical Chemistry A, 2009, 83, 13, 2288–2296
- Mollaamin, F.; Monajjemi, M.Physics and Chemistry of Liquids .2012, 50, 5, 2012, 596–604
- Monajjemi, M.; Khosravi, M.; Honarparvar, B.; Mollaamin, F.; International Journal of Quantum Chemistry, 2011, 111, 2771–2777.
- Monajjemi, M., Mahdavian, L., Mollaamin, F. Bull. Chem. Soc. Ethiop. 2008, 22(2), 277-286
- Monajjemi, M.; Farahani, N.; Mollaamin, F. Physics and Chemistry of Liquids, 2012, 50(2) 161–172
- Monajjemi, M. TheorChemAcc, 2015, 134:77 DOI 10.1007/s00214-015-1668-9
- Monajjemi, M. Journal of Molecular Modeling, 2014, 20, 2507
- Monajjemi, M.; Khaleghian, M.; Mollaamin, F. Molecular Simulation. 2010, 36, 11, 865–
- Ilkhani, Ali R.; Monajjemi, M. Computational and Theoretical Chemistry.2015 1074, 19–25
- Monajjemi, M. Biophysical Chemistry.2015 207,114 –127
- Jalilian,H.; Monajjemi, M. Japanese Journal of Applied Physics. 2015, 54, 8, 08510
- Mahdavian, L.; Monajjemi, M. Microelectronics Journal. 2010,41(2-3), 142-149
- Tahan, A.; Mollaamin, F.; Monajjemi, M. Russian Journal of Physical Chemistry A, 2009, 83 (4), 587-597
- MehdizadehBarforushi,M.; Safari,S.; Monajjemi,M.;J. Comput. Theor.Nanosci.2015, 12, 3058-3065.
- Rahmati,H.; Monajjemi,M.; J. Comput. Theor. Nanosci.2015, 12, 3473-3481.
- TarlaniBashiz,R.; Monajjemi,M.; J. Comput. Theor. Nanosci.2015, 12, 3808-3816.
- MehrabiNejad,A.; Monajjemi,M.; J. Comput. Theor.Nanosci.2015, 12, 3902-3910.
- Monajjemi,M *.; Bagheri,S.; Moosavi,M.S..; Moradiyeh,N.; Zakeri,M.; Attarikhasraghi,N.; Saghayimarouf,N.; Niyatzadeh,G.; Shekarkhand,M.; Mohammad S. Khalilimofrad, Ahmadin,H.; Ahadi,M.; Molecules 2015, 20, 21636–21657;
- Monajjemi,M.; Nayyer T. MohammadianJ. Comput. Theor.Nanosci.2015, 12, 4895-4914.
- Monajjemi, M., Chahkandi, B. Journal of Molecular Structure: THEOCHEM, 2005, 714 (1), 28, 43-60.
- Naghsh,F, oriental journal of chemistry,2015, 31(1) 465-478
- Chitsazan, A, oriental journal of chemistry,2015, 31(1) 393- 408
- Barmaki, Z, oriental journal of chemistry, 2015, 31(3) 1723-1733
- Bonsakhteh, B.; Rustaiyan, A.H, oriental journal of chemistry, 2014, 30(4) 1703-1718


![]()


