Improvement in Corrosion Protection of Zinc by A Natural Inhibitor Incorporated with Zinc Oxide Nanoparticles in an Acidic Medium Evaluated using Gravimetric Measurement, Electrochemical Method and Atomic Force Microscopy
Neha Parekh*, Divya Ladha, Poonam Wadhwani, Suresh Kumar and Nisha Shah
Department of Chemistry, School of Sciences, Gujarat University, Navrangpura, Ahmedabad, Gujarat-380 009, India.
Corresponding Author E-mail : 17neha03@gmail.com
DOI : http://dx.doi.org/10.13005/ojc/320422
Article Received on :
Article Accepted on :
Article Published : 30 Jul 2016
In this study, the improvement in the corrosion inhibition efficiency of a natural inhibitor (coriander seed extract) incorporated with zinc oxide nanoparticles (np-natural inhibitor) was investigated using the gravimetric method and electrochemical methods. The weight loss method indicated that a 25.7% and 57.1% inhibition efficiency (I%) were found when using 0.66 g/L of natural inhibitor and np-natural inhibitor, respectively. Moreover, as the temperature increases, the I% also increases for both inhibitors, suggesting a chemisorption mechanism. EIS revealed that the polarization resistance value (Rp) of np-natural inhibitor is greater than that of the natural inhibitor, indicated that np-natural inhibitor was more resistive. The Temkin adsorption isotherm gave the best fit for both the inhibitors. Scanning electron microscopy (SEM) and atomic force microscopy (AFM) showed the surface morphology of the zinc metal in the absence and presence of both the inhibitors.
KEYWORDS:Chemisorption; Natural inhibitor; EIS; Surface analysis; nanoparticles
Download this article as:| Copy the following to cite this article: Parekh N, Ladha D, Wadhwani P, Kumar S, Shah N. Improvement in Corrosion Protection of Zinc by A Natural Inhibitor Incorporated with Zinc Oxide Nanoparticles in an Acidic Medium Evaluated using Gravimetric Measurement, Electrochemical Method and Atomic Force Microscopy. Orient J Chem 2016;32(4). |
| Copy the following to cite this URL: Parekh N, Ladha D, Wadhwani P, Kumar S, Shah N. Improvement in Corrosion Protection of Zinc by A Natural Inhibitor Incorporated with Zinc Oxide Nanoparticles in an Acidic Medium Evaluated using Gravimetric Measurement, Electrochemical Method and Atomic Force Microscopy. Orient J Chem 2016;32(4). Available from: http://www.orientjchem.org/?p=19763 |
Introduction
Zinc is an active metal that can easily be corroded in acid medium. Many synthetic organic compounds show good anti-corrosive activity, but many of them are highly toxic and can cause severe harm to both human beings and the environment during their application. For this reason, natural inhibitors are in demand. Natural inhibitors are biodegradable and do not contain heavy metals or other toxic compounds1. The ability of an organic compound to interact with a metal surface is closely associated with chemical adsorption. The efficiency of this interaction is related to the presence of polar functional groups with S, O or N atoms, heterocyclic compounds or π-electrons in the molecule. Such compounds can adsorb onto the metal surface and block the active surface sites, thereby reducing the electrochemical reactions involved in the charge transfer processes2. To improve the inhibition force, a synergistic inhibition effect (synergism) is desirable. Synergistic inhibition helps to decrease the amount of compound required and to diversify the application of the inhibitor in acidic media. Previous research has shown that the inhibitive properties of organic compounds are increased by the incorporation of nanoparticles3-7. Studies involving natural products of plant origin show good interactions with the metal surface. Hence, to improve the corrosion protection ability of the natural inhibitor, we prepared np-natural inhibitor by the addition of nanoparticles to the natural inhibitor using a sonication process. This paper reports evidence of the ability of nanoparticles to enhance the corrosion inhibition efficiency of the natural inhibitor for the protection of zinc in 0.5 M HCl, as verified by gravimetric measurements and electrochemical techniques as well as surface morphology evaluation by scanning electron microscopy (SEM) and atomic force microscopy (AFM).
Materials and Methods
Specimen Preparation
Corrosion experiments have been carried out on electrodes cut from sheets of zinc (Wt. %. composition 0.084 Al, 0.009 Cu, 0.003 Pb, 0.040 Cd, 0.009 Fe, 99.853 Zn). The specimens were mechanically abraded with 150, 300 and P518 grade emery papers and then polished to a mirror finish using jeweler’s rouge, leaving a working area of 3 cm × 3 cm × 0.12 cm dimensions for weight loss measurements. The working surface was subsequently ground with acetone followed by double-distilled water, dried in warm air and then stored in moisture-free desiccators before immersion in a corrosive medium8. For the electrochemical impedance measurements, metal specimens of a circular design of apparent surface area 6.156 cm2 were used as the working electrode. The handle and the back side of the specimen were coated with Perspex, leaving only the circular portion of the specimen exposed to the corrosive medium9. The solution of 0.5 M HCl was prepared by the dilution of 35% HCl (Finar) with doubly distilled water. The size of the zinc metal plate for SEM and AFM was 3 cm × 3 cm10.
Preparation of natural inhibitor
Coriander seeds were crushed into fine powder. The solution of coriander was prepared by refluxing 10.0 g of coriander powder with 100 mL of methanol for approximately 90 minutes and filtering after 24 hours. Test solutions with concentrations varying from 0.19 g/L to 1.32 g/L were prepared by diluting the coriander stock solution in 0.5 M HCl11,12.
Synthesis of zinc oxide (ZnO) nanoparticles
Sodium hydroxide solution was added dropwise in a molar ratio of 1:2 to an aqueous solution of zinc sulfate under constant vigorous stirring for 15 hours. The precipitate obtained was filtered and washed thoroughly with deionized water and then sundried and ground to fine powder using an agate mortar13,14.
Synthesis of the np-natural inhibitor
The np-natural inhibitor was prepared by the addition of ZnONPs to the natural inhibitor using a sonication process.
Characterization of natural inhibitor, ZnONPs and np-natural inhibitor
Transmission electron microscopy (TEM) was used to determine the grain size of the ZnONPs and np-natural inhibitor using a model JEOL 2100 F Tecnai- 20 Philips, Amsterdam, Netherlands, working at a 200 kV accelerating voltage (at SICART, Anand). The average diameter range of the ZnONPs was analyzed using dynamic light scattering (DLS) with a Malvern NanoZS 90 Zetasizer, UK, in methanol solvent. The X-ray diffraction patterns of the ZnONPs and np-natural inhibitor were recorded with an X’Pert Philips, Holland, using Cu Kα X-ray lines at 1.5406 A as the radiation source at 40 kV and 30 mA power. The diffractograms were recorded in the 2θ range of 10 – 90. GC-MS analysis was carried out on a GC-MS QP-2010 plus Shimadzu instrument employing the following conditions: column Rtx-5 of 30 m × 0.25 mm × 0.25 µm dimensions; injector temperature 270°C; ion-source temperature 230°C; detection full scan mode and ratio of mass over charge varying from m/z 40 to 650.
Weight loss measurements
Zinc coupons with dimensions of 3.0 cm x 3.0 cm were polished, degreased with acetone and dried. A Mettler balance – M5 type was used to weigh the zinc coupons to an accuracy of 0.0001 gm. The specimens were immersed in a beaker containing 100 mL of 0.5 M HCl without and with 0.19, 0.33, 0.46, 0.66, 0.99, 1.32, gm L-1 concentrations of the inhibitors (natural inhibitor and np-natural) using glass hooks and rods. The effect of the temperature was also studied at 308 K, 318 K, 328 K and 338 K for an exposure period of 30 min using a water-circulating thermostat (Equitron). All the test systems were open to the air. After 30 min, the specimens were taken out, washed with distilled water and re-weighed15,16 . To obtain good reproducibility, experiments were carried out in triplicate, and the average values were obtained. The weight loss was recorded, and the inhibition efficiency as well as the surface coverage was calculated using the following equation:
![]()
![]()
where ‘Wu’ is the weight loss of zinc without inhibitor, ‘Wi’ is the weight loss with inhibitor and θ is the surface coverage17.
Electrochemical measurements
Electrochemical impedance spectroscopy measurements were performed to study the electrochemical behavior of the inhibitor. EIS measurements were carried out using a standard three-electrode cell in which the zinc acts as a working electrode, Ag/AgCl as a reference electrode, and platinum as a counter electrode. All measurements were performed using 0.5 M HCl without stirring in atmospheric conditions. A stabilization period of 30 minutes was allowed prior to the electrochemical measurements, which has been proven to be sufficient to attain a stable open-circuit potential (OCP)18,19. To verify the data, each measurement was performed in triplicate. An electrochemical impedance spectroscopy (EIS) study was performed by using AUTOLAB. Alternating current impedance measurements were carried out in open-circuit potential mode with an amplitude of 0.01 V and a frequency ranging from 250 Hz to 80000 Hz. The experimental impedance spectroscopy data were fitted using a frequency response analyzer (FRA).
Surface morphology
The surface micrographs of the zinc specimens in different test solutions were obtained by SEM and AFM. SEM provides a pictorial representation of the surface to help understand the nature of the surface film in the absence and presence of natural inhibitor and np-natural inhibitor. The scanning electron microscopy photographs were recorded at 10,000 x magnification using SEM XL-30 Philips, Netherlands and Hitachi scanning electron microscopes. AFM measurement was performed using a Bruker Icon Dimension with the ScanAsyst module including tapping mode. The scan rate and area of the images were 0.6 Hz and 5 μm × 5 μm, respectively20,21.
Results and Discussion
SEM Analysis of Metal Surface
SEM provides a pictorial representation of the surface. The SEM images of zinc specimens immersed in 0.5 M HCl for 30 min. in the absence and presence of the natural inhibitor and np-natural inhibitor systems are shown in Figures 1c and 1d, respectively. The SEM micrograph of the polished zinc surface in Figure.1a show the smooth surface of the metal, with no corrosion products. The SEM micrographs of the zinc surface immersed in 0.5 M HCl (Figure 1b) show the roughness of the metal surface, with highly corroded areas. However, Figure 1d shows that in the presence of np-natural inhibitor (1.32 g/L), the inhibition efficiency is enhanced, as seen from the decrease in the corroded areas compared to with the natural inhibitor. In the presence of the natural inhibitor and np-natural inhibitor, the surface is covered by a thin layer of inhibitor that effectively controls the dissolution of the zinc22,23.
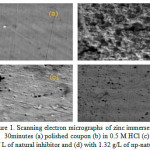 |
Figure 1: Scanning electron micrographs of zinc immersed for 30 minutes (a) polished coupon (b) in 0.5 M HCl (c) with 1.32 g/ L of natural inhibitor and (d) with 1.32 g/L of np-natural inhibitor. Click here to View Figure |
Atomic force microscopy analysis
AFM is a powerful technique to investigative the surface morphology at the nano-to micro-scale and has become a new choice to study the influence of the inhibitor on the generation and the progress of the corrosion at the metal/solution interface. Three-dimensional (3D) AFM morphologies for a polished zinc surface (reference sample), a zinc surface immersed in 0.5 M HCl (blank) and zinc surfaces immersed in 0.5 M HCl containing 1.32 g/L inhibitor or np-natural inhibitor are shown in Figure 2a, b, c and d, respectively. The roughness of the zinc coupons for the polished plate, in the presence of HCl, and with added natural inhibitor or np-natural inhibitor are 15.9 nm, 181 nm, 33.4 nm and 28 nm, respectively. This finding indicates that the addition of the inhibitor or np-natural inhibitor reduces the surface roughness, with the np-natural inhibitor providing better protection than the natural inhibitor24,25.
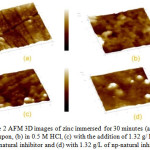 |
Figure 2: AFM 3D images of zinc immersed for 30 minutes (a) polished coupon, (b) in 0.5 M HCl, (c) with the addition of 1.32 g/ L of natural inhibitor and (d) with 1.32 g/L of np-natural inhibitor. Click here to View Figure |
Characterization of ZnONPs and np-natural inhibitor
PXRD diffraction patterns of the np-natural inhibitor and ZnONPs are presented in Figures 3a and b, respectively. The diffraction peaks of the ZnONPs and np-natural inhibitor are found to be at 2ϴ values of 36.43o, 56.75o, 63.04o, and 68.04o and 31.72o, 34.35o, 36.19o, 56.54o, 62.79o, and 68.89o, respectively. From Figure 3a, it can be noted that there are some additional peaks observed in the np-natural inhibitor compared with the ZnONPs. This confirms the formation of a nano-shell of ZnONPs in the coriander seed extract26. The particle sizes of the ZnONPs and np-natural inhibitor were investigated using TEM. Figures 4a and b show ZnONPs and the np-natural inhibitor, respectively. The average size of the ZnONPs and np-natural inhibitor as measured by TEM is ~ 33 nm and ~ 46 nm, respectively 27. To evaluate the hydrodynamic size of the ZnONPs, DLS analysis was performed. The dynamic light scattering (DLS) technique illustrates that before the surface modification (Figure 5), the ZnONPs had an average diameter of ~36 nm28.
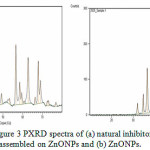 |
Figure 3: PXRD spectra of (a) natural inhibitor assembled on ZnONPs and (b) ZnONPs. Click here to View Figure |
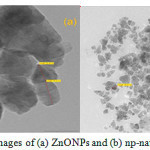 |
Figure 4: TEM images of (a) ZnONPs and (b) np-natural inhibitor Click here to View Figure |
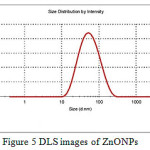 |
Figure 5: DLS images of ZnONPs Click here to View Figure |
Characterization of coriander seed extract
The characterization of the natural inhibitor was performed with the help of the GC-MS technique29,30 . 14 major compounds were identified in the methanol extract of coriander seeds, as shown in Table 1.
Table 1: GC-MS analysis of methanol extract of coriander seeds
| Peak | Retention time (minutes) | Area(%) | Name of compound |
| 1 | 12.055 | 4.06 | 3,7-dimethyl-1,6-octadien-3-ol |
| 2 | 13.555 | 2.63 | 1,5-Anhydro-6-deoxyhexo-2,3-diulose |
| 3 | 20.364 | 4.99 | 2,6-Octadien-1-ol, 3,7-dimethyl acetate |
| 4 | 29.454 | 7.07 | Tetradecanoic acid |
| 5 | 30.277 | 2.47 | (E)-2-Tridecenoic acid |
| 6 | 33.519 | 18.68 | n-Hexadecanoic acid |
| 7 | 35.944 | 2.01 | (Z)-6-Octadecenoic acid, methyl ester |
| 8 | 36.673 | 4.25 | 10,12-Hexadecadien-1-ol |
| 9 | 36.816 | 8.38 | (Z)-6-Octadecenoic acid |
| 10 | 37.126 | 2.47 | Octadecanoic acid |
| 11 | 40.606 | 3.39 | Tetradecanoic acid, dodecyl ester |
| 12 | 43.777 | 4.76 | Hexadecanoic acid, tetradecyl ester |
| 13 | 46.016 | 4.95 | Hexadecadienoic acid, methyl ester |
| 14 | 70.198 | 3.34 | Propanoic acid, 3,3′-thiobis-, didodecyl ester |
Weight loss measurements
At a higher concentration (1.32 g/L) of the natural inhibitor or np-natural inhibitor, the presence of more molecules leads to a greater tendency of adsorption of inhibitor molecules on the surface of the metal. At a lower concentration (0.66 g/L) of inhibitor, the I% value obtained was 25.72%, but a significant increase (I% value of 57.15%) was observed upon the addition of np-natural inhibitor. At 308 K, the inhibition efficiencies in 0.5 M HCl for the natural inhibitor and np-natural inhibitor (0.99 g/L) were 62.42% and 72.15%, respectively, but an increase in temperature caused slight damage to the zinc, and inhibition efficiencies of 61.31% and 88.82% were observed in Table 2 at 65 °C in HCl with 0.99 g/L inhibitor or np-natural inhibitor, respectively31. The np-natural inhibitor exhibits significantly increased inhibition efficiency in acid media. The result of the study suggests that the inhibition efficiency increases with an increase in temperature. This is because at higher temperatures, a strong chemical reaction can occur between the surface of the zinc and the inhibitor molecules (chemisorption). According to the literature cited by Poonam Wadhwani32, the increase in the inhibition efficiency with the temperature is an indication that the adsorption of the np-natural inhibitor on the zinc surface is chemical in nature. The mechanism of the adsorption process of the inhibitor molecules on the zinc surface can be understood by the thermodynamic parameters. The Arrhenius equation (eq. 3) gives information about the values of the apparent activation energy, and its alternative form (eq. 4) provides the enthalpy and entropy of activation,
![]()
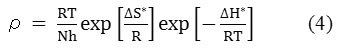
where ‘ρ’ (mg/cm2/h) is the corrosion rate, ‘Ea’ (kJ/mol) is the apparent activation energy, ‘R’ (8.314 J K-1 mol-1) is molar gas constant, ‘T’ (K) is the absolute temperature, ‘N’ (6.02252 X 10²³ mol-1) is Avogadro’s number, ‘h’ (6.626176 X 10⁻³⁴ J.s) is Planck’s constant, ‘ΔS*’ (J/K/mol) is the entropy of activation and ΔH* (kJ/mol) is the enthalpy of activation. A plot of log ( /T) vs 1/T X 104 (K-1) is shown in Figure 6a and b. The entropy of activation, ΔS*, was negative both in the absence and presence of inhibitor, implying that the activated complex represents the rate-determining step with respect to the association rather than the dissociation step33. Figures 7a and b represent the graph of log vs 1/T X 104 (K-1) for the natural inhibitor and np-natural inhibitor, respectively. This implies that a decrease in disorder occurred when proceeding from the reactants to the activated complex. The negative values of ΔH* also show that the adsorption of inhibitor is an exothermic process34. The increase in Ea may be interpreted as physical adsorption. It is reasonable to assume that in this case, the electrostatic cation adsorption is responsible for the good protective properties of the compound. However, at a lower concentration of natural inhibitor or np-natural inhibitor the Ea value decreases, which indicates chemisorption35,36. However, at higher concentrations (0.99 and 1.32 g/L), a slight increase in Ea is observed due to minute differences in the inhibition efficiency with an increase in temperature (Table 3). The lone pairs of electrons on the oxygen are responsible for the coordination type of adsorption of inhibitors onto the zinc surface (chemisorption), and the aromatic rings are responsible for the weak physical forces between the inhibitors and the zinc surface (physisorption). Therefore, the natural inhibitor and np-natural inhibitor provide mixed inhibition, i.e., physisorption and chemisorption.
Table 2: Effect of temperature on the inhibition efficiency and surface coverage of inhibitor and np-natural inhibitor
| Concentration of Inhibitor (g/L) | Inhibition efficiency (%) | Standard deviations(%) | |||||||||
| 308 K | 318 K | 328 K | 338 K | ||||||||
| I% | Surface coverage (θ) | I% | Surface coverage (θ) | I% | Surface coverage (θ) | I% | Surface coverage (θ) | ||||
| Blank | – | – | – | – | – | ||||||
| Natural inhibitor | |||||||||||
| 0.19 | -23.65 | -0.236 | -14.22 | -0.142 | 3.079 | 0.030 | 13.116 | 0.131 | 2.8 | ||
| 0.33 | -10.76 | -0.107 | -4.378 | -0.043 | 11.594 | 0.115 | 22.623 | 0.226 | 2.1 | ||
| 0.462 | 9.026 | 0.090 | 15.422 | 0.154 | 14.855 | 0.148 | 34.771 | 0.347 | 1.4 | ||
| 0.66 | 25.720 | 0.257 | 27.363 | 0.273 | 35.688 | 0.356 | 47.227 | 0.472 | 0.7 | ||
| 0.99 | 62.425 | 0.624 | 61.990 | 0.619 | 61.956 | 0.619 | 61.311 | 0.613 | 1.5 | ||
| 1.32 | 91.190 | 0.911 | 88.756 | 0.887 | 94.655 | 0.946 | 86.531 | 0.865 | 3.2 | ||
| Np-natural inhibitor | |||||||||||
| 0.19 | -16.36 | -0.163 | -11.69 | -0.116 | 12.771 | 0.127 | 25.616 | 0.256 | 2.6 | ||
| 0.33 | 3.643 | 0.036 | 2.985 | 0.029 | 26.721 | 0.267 | 29.841 | 0.298 | 1.8 | ||
| 0.462 | 15.715 | 0.157 | 25.671 | 0.256 | 28.170 | 0.281 | 42.297 | 0.422 | 1.5 | ||
| 0.66 | 57.150 | 0.571 | 47.164 | 0.471 | 44.746 | 0.447 | 48.063 | 0.480 | 0.6 | ||
| 0.99 | 72.158 | 0.721 | 85.472 | 0.854 | 87.50 | 0.875 | 88.820 | 0.888 | 1.8 | ||
| 1.32 | 97.498 | 0.974 | 95.721 | 0.957 | 97.826 | 0.978 | 95.862 | 0.958 | 3.8 | ||
Table 3: Thermodynamic factors for adsorption of natural inhibitor and np-natural inhibitor on zinc surface in 0.5 M HCl solution
| Concentration of Inhibitor (g/L) | Ea at30 minutes (kJ/mol) | ΔH* at30 minutes(kJ/mol) | ΔS* at30 minutes(J/mol/K) |
| Natural inhibitor | |||
| Blank | 6.337 | 3.657 | -201.1 |
| 0.19 | -4.231 | -6.912 | -233.49 |
| 0.33 | -4.365 | -7.065 | -234.78 |
| 0.462 | -2.144 | -4.825 | -229.14 |
| 0.66 | -2.374 | -5.054 | -230.89 |
| 0.99 | 7.103 | 4.422 | -206.77 |
| 1.32 | 10.569 | 7.888 | -207.83 |
| Np-natural inhibitor | |||
| Blank | 6.337 | 3.657 | -201.1 |
| 0.19 | -7.350 | -10.033 | -243.89 |
| 0.33 | -4.308 | -6.988 | -235.59 |
| 0.462 | -3.750 | -6.433 | -235.16 |
| 0.66 | 11.850 | 9.171 | -189.66 |
| 0.99 | -18.937 | -21.617 | -294.99 |
| 1.32 | 13.498 | 10.818 | -207.72 |
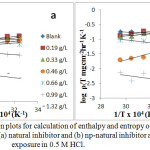 |
Figure 6: Transition plots for calculation of enthalpy and entropy of activation for zinc corrosion with (a) natural inhibitor and (b) np-natural inhibitor at 30 minutes of exposure in 0.5 M HCl. Click here to View Figure |
 |
Figure 7: Arrhenius plot for calculation of activation energy for zinc corrosion in presence of (a) natural inhibitor and (b) np-naturo inhibitor at 30 minutes of exposure in 0.5 M HCl. Click here to View Figure |
Adsorption Isotherm
The Temkin adsorption isotherm was tested by plotting θ Vs log C, and a straight line was obtained, showing that the Temkin isotherm was followed. The Temkin isotherm mostly favors chemisorption and is an indication of the interaction of uncharged molecules on a heterogeneous surface37,38 .
The Temkin isotherm is represented as
![]()
where C1 and C2 are constants, corresponding to an assumption that the adsorption enthalpy changes linearly with the pressure. The isotherm can also be written in the form
![]()
It assumes a linear dependence of the adsorption energy on the fractional coverage, and a plot of q vs log C yields a straight line, as shown in Figure 8a, b, for the natural inhibitor and np-natural inhibitor, respectively.
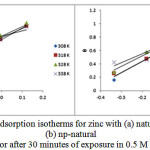 |
Figure 8: Temkin adsorption isotherms for zinc with (a) natural inhibitor and (b) np-natural inhibitor after 30 minutes of exposure in 0.5 M HCl. Click here to View Figure |
Electrochemical impedance spectroscopy (EIS) measurements
To provide information on the inhibition effect, electrochemical impedance spectroscopy is well suited for monitoring in situ any perturbation by an inhibitor according to the electrochemical processes at the interface of the metal/corrodent. The influence of the inhibitor on the adsorption on the zinc surface, the high corrosion inhibition effect of the natural inhibitor and the synergistic effect of the np-natural inhibitor have been studied. Nyquist plots have been produced for the 0.5 M HCl, natural inhibitor and np-natural inhibitor samples. It is well known that the semicircular diameter of the Nyquist plot is proportional to the anticorrosion performance, with a larger diameter revealing better anticorrosion performance. The simple equivalent circuit that fits many electrochemical systems consists of a parallel combination of a double-layer capacitance (Cdl), the charge transfer resistance (Rp) corresponding to the corrosion reaction at the metal/electrolyte interface and the solution resistance (Rs) between the working and reference electrodes39,40. To reduce the effects due to surface irregularities of the metal, a constant phase element (CPE) is introduced into the circuit instead of a pure double-layer capacitance to provide a more accurate fit. The Nyquist plots of the natural inhibitor and np-natural inhibitor represented in Figure 9a, b were analyzed by best fitting to the equivalent circuit model shown in Figure 10. The parameters of the circuit can be thus defined according to the usual convention as follows: Rs represents the solution resistance, Rp is the polarization resistance that can also be defined as the charge transfer resistance, and Y0 is the constant phase elements (CPEs). The value of Rp is a measure of the electron transfer across the exposed area of the metal surface, and it is proportional to the inhibition efficiency41. The intercept at the high–frequency end corresponds to the solution resistance (Rs), and that at the lower-frequency end corresponds to the sum of Rs and Rp. The Y0 (CPEs) represents a double-layer capacitor (Cdl) because the value of its component, n, is very close to unity, so it is expected to cover the charged zinc surfaces42,43. The CPE has been reported44 to vary depending on the value of its component n, where it may be a resistance, capacitance or inductance. The impedance of the CPE is expressed by
![]()
where Y0 is the magnitude of the CPE, n is an exponent (phase shift), ω is the angular frequency and j is the imaginary unit. The value of Rp increases with the concentration of the natural inhibitor or np-natural inhibitor. This is because of the continuous dissolution of the zinc under the aggressive action of the corrosive acid solution, which does not allow the formation of an oxide film or corrosion product layer on the surface, indicating the adsorption of the inhibitors over the metal surface.
The impedance parameters can be derived from Table 4. The increase in Rp in the presence of the studied extracts may be due to the gradual replacement of water molecules by the adsorption of the molecules of inhibitor and np-natural inhibitor on the metal surface45,46. Because the Rp value is inversely proportional to the corrosion rate, it can be used to calculate the inhibition efficiency of the inhibitor by using the equation
![]()
where and are the charge transfer resistances in the absence and presence of inhibitor, respectively. The Bode plot defines the frequency-specific impedance behavior of the system under consideration. Bode modulus plots and Bode phase angle plots for the corrosion of the composite in 0.5 M HCl in the presence of different concentrations of natural inhibitor and np-natural inhibitor are shown in Figure 11a, b and Figure 12a, b, respectively. It may be observed that for increasing concentrations of inhibitor and np-natural inhibitor, the impedance modulus (Zmod) corresponding to a lower frequency increases. A higher value of Zmod shows a better corrosion resistance47-49. The phase diagram is used to characterize the constant phase element (CPE) and impedance performance of the layer. The higher the phase angle is, the greater the CPE character of the membrane layer and the stronger the inhibition of the permeability of the corrosion medium.
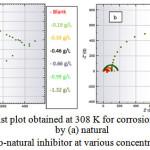 |
Figure 9: Nyquist plot obtained at 308 K for corrosion inhibition of zinc by (a) natural inhibitor (b) nano-natural inhibitor at various concentrations in 0.5 M HCl. Click here to View Figure |
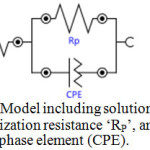 |
Figure 10: Model including solution resistance ‘Rs’, polarization resistance ‘RP’, and constant phase element (CPE). Click here to View Figure |
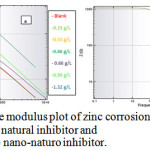 |
Figure 11: Bode modulus plot of zinc corrosion in presence of (a) natural inhibitor and (b) nano-naturo inhibitor. Click here to View Figure |
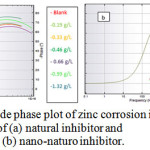 |
Figure 12: Bode phase plot of zinc corrosion in presence of (a) natural inhibitor and(b) nano-naturo inhibitor. Click here to View Figure |
Table 4: Impedance parameters and equivalent inhibition efficiencies for the corrosion inhibition of zinc with natural inhibitor and np-natural inhibitor at various concentrations in 0.5 M HCl.
| Concentration of Inhibitor(g/L) | Rs (Ω) | Rp(Ω) | CPEµMho | N | I% |
| Natural inhibitor | |||||
| Blank | 1.2 | 44.7 | 0.908 | 0.999 | – |
| 0.19 | 1.42 | 35.7 | 4.25 | 0.966 | -24.649 |
| 0.33 | 0.928 | 45.4 | 1.73 | 0.933 | -1.565 |
| 0.462 | 0.956 | 50.0 | 1.61 | 0.938 | 10.6 |
| 0.66 | 1.41 | 60.3 | 1.40 | 0.918 | 25.87 |
| 0.99 | 1.54 | 116 | 0.708 | 0.956 | 61.465 |
| 1.32 | 2.99 | 393 | 0.269 | 0.954 | 90.951 |
| Np-natural inhibitor | |||||
| 0.19 | 0.926 | 45.2 | 1.71 | 0.932 | 1.541 |
| 0.33 | 1.72 | 48.7 | 1.08 | 0.944 | 8.213 |
| 0.462 | 1.44 | 56.7 | 1.39 | 0.921 | 21.164 |
| 0.66 | 2.45 | 105 | 0.786 | 0.923 | 57.428 |
| 0.99 | 3.55 | 177 | 0.516 | 0.927 | 74.745 |
| 1.32 | 100 | 996 | 0.953 | 0.999 | 95.512 |
Conclusions
A natural inhibitor assembled on zinc oxide nanoparticles shows a strong binding mechanism by XRD, as confirmed by DLS and TEM. The chemical constituents of the natural inhibitor were identified by GC-MS analysis. Weight loss measurements revealed that with an increase in the inhibitor concentration and temperature, the inhibition efficiency increases significantly for the np-natural inhibitor compared to the natural inhibitor. EIS measurements suggest that the dissolution mechanism of zinc is controlled by mass transport in the absence and presence of both inhibitors. The SEM and AFM results supported the formation of a film on the zinc surface. The adsorption of the natural inhibitor and np-natural inhibitor on the zinc surface in 0.5 M HCl obeys the Temkin adsorption isotherm, which supports a chemisorption mechanism.
References
- Tang.B; Li.D; Fu.F ; Xu.Y; Yu.G. J. Zhang, Ind. Eng. Chem. Res. 2012 ,51 , 2615–2621.
CrossRef - Peme, T.; Olasunkanmi, L. O.; Bahadur, I.; Adekunle, A. S.; Kabanda, M. M.; Ebenso, E. E. Molecules 2015, 20, 16004–16029.
CrossRef - Atta. A.M; Allohedan. H.A; El-Mahdy. G.A. J. Nanomater. 2013,1-8.
- Obot. I. B., Umoren. S. A., Johnson. A. S., J Mater Env. Sci 2013, 4, 1013.
- Atta. A. M., Allohedan. H. A., El-Mahdy. G. A., Ezzat. A.-R. O., J. Nanomater. 2013, 2013, 1.
- Avila-Gonzalez.C, Cruz-Silva. R, Menchaca. C, Sepulveda-Guzman. S, Uruchurtu. J, J. Nanotechnol. 2011, 2011.
- Awizar. D. A, Othman. N. K, Daud. A. R, Rahman. I. A, Al-Hardan. N. H, Int. J. Electrochem. Sci. 2013, 8.
- Shah.M.D; PanchalV.A; Mudaliar.G.V; Shah N.K. Anti-Corros. Methods Mater. 2011,58, 125–130.
CrossRef - Panchal, V.; Patel, A.; Shah, N. Zašt. Mater. 2012, 53, 15–28.
- Shipley, R. J.; Stevenson, M. E. J. Fail. Anal. Prev. 2011, 11, 274–281.
CrossRef - Abiola.O.K; Otaigbe.J.O.E; Kio.O.J, , Corros. Sci. 2009, 51, 1879–1881.
CrossRef - Eddy, N. O.; Ekwumemgbo, P. A.; Mamza, P. A. P. Green Chem. Lett. Rev. 2009, 2, 223–231.
CrossRef - Becheri, A.; Dürr, M.; Nostro, P. L.; Baglioni, P. J. Nanoparticle Res. 2007, 10, 679–689.
CrossRef - Yu, J.; Yu, X. Environ. Sci. Technol. 2008, 42, 4902–4907.
CrossRef - Panchal.V; Patel.A; Shah.N. Zašt. Mater.2012, 53, 15–28.
- Desai, D.; Turney, D. E.; Anantharaman, B.; Steingart, D. A.; Banerjee, S. J. Phys. Chem. C 2014, 118, 8656–8666.
CrossRef - Eliyan, F. F.; Alfantazi, A. Mater. Chem. Phys. 2013, 140, 508–515.
CrossRef - Agrawal, Y. K.; Talati, J. D.; Shah, M. D.; Desai, M. N.; Shah, N. K. Corros. Sci. 2004, 46, 633–651.
CrossRef - Desai, M. N.; Desai, M. B. Corros. Sci. 1984, 24 (8), 649–660.
CrossRef - Bastos, A. C.; Simões, A. M.; González, S.; González-García, Y.; Souto R. M. Electrochem. Commun. 2005, 7 (11), 1183–1184.
CrossRef - Nasibi, M.; Rafiee, E.; Rashed, G.; Ashassi-Sorkhabi, H.; Behpour, M. J. Dispers. Sci. Technol. 2013, 34, 964–973.
CrossRef - Zamborini F.P; Campbell.J.K; Crooks.R.M. Langmuir.1998, 14, 640–647.
CrossRef - Zhang.F; Pan.J; Claesson.P.M. Electrochimica Acta.2011, 56, 1636–1645.
CrossRef - Giacomelli.F.C; Giacomelli.C; Amadori.M.F; Schmidt.V; Spinelli.A. Mater. Chem. Phys.2004, 83, 124–128.
CrossRef - He, C.; Tian, Z.; Zhang, B.; Lin, Y.; Chen, X.; Wang, M.; Li, F. Ind. Eng. Chem. Res. 2015, 54, 1971–1981.
CrossRef - Chiang.C.T; Roberts.J.T. Chem. Mater.2011, 23, 5237–5242.
CrossRef - Bammou.L; Chebli.B; Salghi.R; Bazzi.L; Hammouti.B; Mihit.M; Idrissi.H. Green Chem. Lett. Rev.2010, 3, 173–178.
CrossRef - Gunawan, L.; Johari, G. P. J. Phys. Chem. C. 2008, 112 (51), 20159–20166.
CrossRef - Cimatu, K. A.; Mahurin, S. M.; Meyer, K. A.; Shaw, R. W. J. Phys. Chem. C 2012, 116 , 10405–10414.
CrossRef - Beenakumari, K. S. Green Chem. Lett. Rev. 2011, 4, 117–120.
CrossRef - Cox.G.L. Ind. Eng. Chem.1931, 23, 902–904.
CrossRef - Okon, N. E. Green Chem. Lett. Rev. 2010, 3 (4), 307–314.
CrossRef - Giacomelli, F. C.; Giacomelli, C.; Amadori, M. F.; Schmidt, V.; Spinelli, Mater. Chem. Phys. 2004, 83, 124–128.
CrossRef - Wadhwani, P. M.; Panchal, V. K.; Shah, N. K. Appl. Surf. Sci. 2015, 331, 373–387.
CrossRef - Wang, J.; Han, E.-H.; Wang, J. Electrochem. Commun. 2015, 60, 100–103.
CrossRef - Nuñez, M. Prevention of Metal Corrosion: New Research; Nova Publishers, 2007.
- McCafferty, E. Introduction to Corrosion Science; Springer Science & Business Media, 2010.
- Helfferich, F. G. Kinetics of Multistep Reactions; Elsevier, 2004.
- Bhatia, S. Zeolite Catalysts: Principles and Applications; CRC Press, 1989.
- Kuznetsov, Y. I. Organic Inhibitors of Corrosion of Metals; Springer Science & Business Media, 2013.
- Sharma, S. K. Green Corrosion Chemistry and Engineering: Opportunities and Challenges; John Wiley & Sons, 2011.
- Corrosion Tests and Standards; ASTM International.
- Coso, E. B. Trends in Electrochemistry and Corrosion the Beginning of the 21st Century; Edicions Universitat Barcelona, 2004.
- Scully, J. R.; Silverman, D. C. Electrochemical Impedance: Analysis and Interpretation; ASTM International, 1993.
- Bonora, P. L.; Deflorian, F.; Fedrizzi, L. Electrochimica Acta 1996, 41, 1073–1082.
CrossRef - Dattilo, M.; Prater, R. B.; Miller, V. R. Electrochemical impedance spectroscopy study of corrosion of painted cold-rolled and electrogalvanized sheet steel for automotive use; U.S. Dept. of the Interior, Bureau of Mines, 1990.
- Landolt, D. Corrosion and Surface Chemistry of Metals; CRC Press, 2007.
- Marcus, P.; Mansfeld, F. B. Analytical Methods In Corrosion Science and Engineering; CRC Press, 2005.
- Barranco, V.; Feliu, S. Corros. Sci. 2004, 46, 2203–2220.
CrossRef

This work is licensed under a Creative Commons Attribution 4.0 International License.
![]()
A New Edition of Web of Science
Journal Impact Factor
2022: 0.5
Five Year: 0.8
Journal is Indexed in

Cabells Whitelist
![]()


