Effect of Processing on Ferulic Acid Content in Foxtail Millet (Setaria Italica) Grain Cultivars Evaluated by HPTLC
Giridhar Goudar1 and Sathisha G. J¹*
1Department of Biochemistry, Kuvempu University, Shimoga - 577451, Karnataka, India.
*Corresponding Author E-mail: satishlec@gmail.com
DOI : http://dx.doi.org/10.13005/ojc/320458
Foxtail millet (Setaria italica) grain cultivars were analyzed for the phenolic components which have beneficial effects on human health. The aim of the present study was to evaluate the effect of dehusking on total phenolic and total flavonoid contents in four types of foxtail millet grain varieties. These grains were extracted for phenolic compounds and evaluated for total phenolic content (TPC), total flavonoid content (TFC) and antioxidant activity. TPC was analyzed by Folin-Ciocalteu method, TFC by aluminium chloride method and antioxidant activity by 1,1-diphenyl-2-picrylhydrazyl (DPPH) radical scavenging assay. High Performance Thin Layer Chromatography (HPTLC) evaluation was done for ferulic acid in the phenolic extracts, identification was done by comparing Rf value of the ferulic acid standard with the sample extracts and quantification was done using the peak areas of the obtained chromatograms. Results revealed that TPC, TFC and antioxidant activity was found to be high in husk of the grains compared to whole grains and dehusked grains, whereas when compared amoung different cultivars Black variety got the high content of phenolics.
KEYWORDS:Foxtail millet; phenolic; flavonoid; ferulic acid; HPTLC
Download this article as:| Copy the following to cite this article: Goudar G, Sathisha G. J. Effect of Processing on Ferulic Acid Content in Foxtail Millet (Setaria Italica) Grain Cultivars Evaluated by HPTLC. Orient J Chem 2016;32(4). |
| Copy the following to cite this URL: Goudar G, Sathisha G. J. Effect of Processing on Ferulic Acid Content in Foxtail Millet (Setaria Italica) Grain Cultivars Evaluated by HPTLC. Orient J Chem 2016;32(4). Available from: http://www.orientjchem.org/?p=20673 |
Introduction
Millet grain phenolics possess bioactivities against several pathophysiological conditions and may serve as potential natural sources of antioxidants in food and biological systems (1.Shahidi & Chandrasekara, 2013). They are the cereal crops with small sized seeds which belongs to family Poaceae. They are superior to rice and wheat, and therefore provide protein, mineral, and vitamins to the poor where the need for such nutrients is in high demand (2.Taylor and Emmanbux, 2008). Foxtail millet (Setaria italica) is one of the oldest cultivated millet crops and is often cultivated in harsh conditions as an alternative to maize because of their better adaptability to arid and barren lands than most other crops (3.Panaud, 2006).
Polyphenols are of current interest due to their important biological properties such as improved gut health and reduced risk of coronary heart disease (4.Fava et al., 2006; 5.Romier et al., 2009), anti-inflammatory (6.Koshihara et al., 1984), antimutagenic, anticarcinogenic and antioxidant activities (7.Chandrasekara & Shahidi, 2011; 8.Serrano et al., 1998). Whole grains contain unique phytochemicals that complement those in fruits and vegetables when consumed together. For instance, various classes of phenolic compounds in grains include phenolic acids, anthocyanidins, quinones, flavonols, chalcones, flavones, flavanones, and amino phenolic compounds (9.Lloyd et al., 2000; 10.Maillard and Berset, 1995; 11.Thompson, 1994). It is generally believed that antioxidants scavenge free radicals and reactive oxygen species and thus inhibit oxidative mechanisms which lead to degenerative diseases (12.Sushama et al., 2011). An increasing number of epidemiological studies have shown an inverse correlation between the consumption of dietary antioxidants and incidence of various diseases including cancer and heart disease (13.Kris-Etherton et al., 2002).
Ferulic acid, the most abundant phenolic acid in cereal grains (14.Adom et al., 2003). Grain fractions with enhanced levels of ferulic acid are of great interest to both researchers and the food industry for use as functional food ingredients (15.Malkki, 2004) because of their health benefits to humans. Ferulic acid is attached into wall matrices to structural polysaccharides via ester linkage with its carboxylic group. In grasses, Poaceae family, it is linked to the acid group acylating the primary hydroxyl at the C-5 position of α-L-arabinofuranosyl residues (16.Helene et al., 2008).
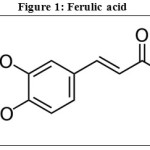 |
Figure 1: Ferulic acid |
The health benefits of millets are dependent upon their metabolic profiles, including the types and amounts of natural phenolic compounds present. Further studies on these phenolic compounds would enhance understanding of the biological activity of millet phenolics and their benefits to human health. Generally millet grains are subjected to domestic processing such as dehusking before they are consumed. Investigation on effect of domestic processing on individual phenolic profile in foxtail millet is scarce. The present study aims on the effect of dehusking on the phenolic content and evaluation of ferulic acid content in foxtail millet varieties utilizing High Performance Thin Layer Chromatography (HPTLC).
Materials and Methods
Grain Samples
The foxtail millet grain varieties (HMT-1-100, PSC-4, Sia-3126 & black) were procured from University of Agricultural Sciences, Dharwad, Karnataka for the study.
Chemicals
Analytical grade reagent chemicals aluminium chloride, ethyl acetate, ethyl alcohol, hydrochloric acid, methanol, sodium hydroxide, sodium nitrite, sodium sulphate and sodium carbonate of analytical grade were procured from Thomas Baker Chemicals (Mumbai, India). Folin–Ciocalteu reagent was procured from Merck KGaA, (Darmstadt, Germany). Gallic acid, rutin and 2,2’-diphenyl-1-picrylhydrazyl (DPPH) were purchased from Sigma-Aldrich Co. (St.Louis, USA).
Extraction of phenolic compounds
Phenolic components were isolated according to the method (17.Hemalatha & Giridhar, 2012). Flours of the grain samples were extracted using 70% ethanol (4 x 50 mL, 3 h each) with agitation; the supernatants were obtained by centrifugation at 15,000 rpm for 15 min at 4˚C (Sigma 3K30, Germany) and concentrated under vacuum with rotary evaporator at 50˚C, 45 rpm (Hahnvapor, Hahnshin Scientific Co., Korea) and the pH was adjusted to 2.00 with 4 M HCl. Phenolic compounds were separated by ethyl acetate phase separation (4 x 50 mL), and the pooled fractions were treated with anhydrous sodium sulphate to remove moisture; filtered, and evaporated to dryness. Phenolic compounds redissolved in methanol (1ml) and stored at -20˚C till further analysis. A study stated that the combination of enzymatic or chemical methods with physical pretreatments can substantially increase the extraction efficiency, especially regarding lignocellulosic matrices. The goal of pre-treatment technology is to alter or remove structural and compositional impediments to hydrolysis (18.Mosier et al., 2005). Phenolic substances have a higher affinity with polar solvents, such as ethanol (19.Spagolla et al., 2009; 20.Tiwari et al., 2001), hence various solvent systems are used for optimization of extraction process of phenolic compounds. Also, the levels of total constituents in plant derivates depend on the extraction process and its variables, such as the solvent used (21.Sideney et al., 2015).
Determination of Total Phenolic Content (TPC)
TPC was determined by the method described by 22.Singleton & Rossi, 1965. Briefly, the appropriate dilutions of extracts were reacted with the Folin–Ciocalteu reagent and the reaction was neutralized with sodium carbonate. The absorbance was measured at 765 nm after 60 minutes incubation at room temperature under dark using UV-Visible Spectrophotometer (Cary 50, Varian, Middelburg, Netherlands). Gallic acid was used as reference standard, and TPC of the samples were expressed as µg of gallic acid equivalent per gm (µg GAE/g) of sample on dry basis.
Determination of Total Flavonoid Content (TFC)
TFC was determined by aluminium chloride colorimetric method (23.Yun et al., 2009) with minor modification explained by 17.Hemalatha & Giridhar, 2012. In brief, aliquots (1ml) of appropriately diluted extracts or standard solutions were pipette into 15ml polypropylene conical tubes containing 2 ml double distilled H2O and mixed with 0.15ml of 5% NaNO2. After 5min, 0.15ml of 10% AlCl3.6H2O solution was added and the mixture was allowed to stand for another 5min, and then 1ml of 1M NaOH was added. The reaction solution was well mixed, incubated at room temperature for 15min and the absorbance was determined at 415nm using the UV-Visible Spectrophotometer (Cary 50, Varian, Middelburg, Netherlands). Rutin was used as reference standard, and TFC of the samples were expressed as µg of rutin equivalent per gm (µg RE/g) of sample on dry basis.
Antioxidant Activity by Free Radical-Scavenging Scavenging Assay (DPPH Method)
Free radical-scavenging capacity (DPPH) of phenolic acid extracts in foxtail millet cultivars were estimated according to the previously reported procedure using the DPPH radical (24.Revanappa et al., 2011). In brief, an aliquot (1 mL) of phenolic extracts were mixed with the freshly prepared 1mL of (200 µM) DPPH in ethanol. The control contained all the reagents except phenolic extracts. The mixture was shaken vigorously and left to stand for 20 min at room temperature in the dark. The absorbance of the resulting solution was measured using UV-Visible spectrophotometer (Cary 50, Varian, Middelburg, Netherlands) at 517 nm. Absorbance data were collected and transformed to radical scavenging activity (I%) according to equation
I% = (Ac-As) x 100/Ac
where ‘Ac’ is the absorbance of control (without extract) and ‘As’ is the absorbance of sample. Synthetic antioxidants such as BHA and BHT were used for comparison
HPTLC Conditions and Analysis
HPTLC analysis was performed on precoated silica gel 60 F254 aluminium back HPTLC plates (Merck, Darmstadt, Germany) of size 20x10cm. The standard solution of ferulic acid and sample extracts were applied onto the plates of 8mm length with automatic sample applicator (Linomat V, CAMAG, Switzerland) with the aid of Hamilton syringe (10μL). Development of the plate was done at room temperature (27±2°C) in the vertical glass twin-trough glass chamber (20 cm × 10 cm, with metal lids; CAMAG, Switzerland) which was previously saturated with mobile phase (20mL) for 20 minutes. Mobile phase was composed of solvents toluene, ethyl acetate, formic acid and methanol in the ratio 6:6:1:0.4 (v/v). The plate was developed up to a distance of about 75 mm and were air-dried at room temperature for 20 min and then heated at 105±2°C for 5 minutes in hot air oven. The plates were observed for the compact bands inside UV cabinet (CAMAG, Switzerland) and the TLC images were captured at 254nm. Scanning was performed in TLC Scanner III (CAMAG, Switzerland). Quantitative analysis was performed at wavelength 254nm in absorbance mode with win CATS software (Version 1.2.0). The TLC plates were scanned by a CAMAG TLC Scanner III and quantified at their wavelengths of maximum absorption. A deuterium (D2) lamp was used to scan the plates with the remission absorption mode having the slit width 6.0×0.30 mm (micro). HPTLC chromatogram and photodocumentation of ferulic acid along with phenolic extracts of samples were analyzed at 254nm (Fig.2). The densitograms were further scanned for their in situ UV spectra from 200 to 700 nm and overlaid with the UV absorption spectra of phenolic acid standard in all the sample extracts.
Results and Discussions
The present study was aimed to assess the effect of processing (dehulling) on the phenolic compounds and antioxidant properties in the foxtail millet cultivars.
Phenolic Compounds
TPC and TFC in the analyzed foxtail millet grain cultivars is presented in Table 1 & 2. Irrespective of the cultivars TPC and TFC was found in the order; husk > whole grain > dehusked grain. TPC for the whole grains, dehusked grains and husk was ranging from 420.0 to 982.8, 240.3 to 505.3 and 547.6 to 1140.3 μg/g GAE, respectively.
Table 1: TPC of foxtail millet cultivars
|
Variety |
TPC (*μg GAE/g) |
||
|
Whole grain |
Dehusked grain |
Husk |
|
| HMT-1-100 |
527.5 |
357.5 |
810.2 |
| PSC-4 |
440.1 |
272.2 |
547.6 |
| Sia-3126 |
420.0 |
240.3 |
552.8 |
| Black |
982.8 |
505.3 |
1140.3 |
* GAE: gallic acid equivalent; All values are mean of three replicate experiments
Whereas, TFC was comparatively less than TPC which was ranging from 282.5 to 590.3, 230.1 to 432.4 and 352.4 to 840.2 μg/g RE, respectively for whole grains, dehusked grains and husk samples. When compared amoung the cultivars the black variety got the highest TPC i.e., 982.8, 505.3 and 1140.3 μg/g GAE and TFC i.e., 590.3, 432.4 and 840.2 μg/g RE for whole grain, dehusked and husk samples respectively. Hence there was significant difference in the content of TPC and TFC amoung the cultivars as well as for effect of processing (dehulling) in these grains.
Table 2: TFC of foxtail millet cultivars
|
Variety |
TFC (*μg RE/g) |
||
|
Whole grain |
Dehusked grain |
Husk |
|
| HMT-1-100 |
385.4 |
322.2 |
515.2 |
| PSC-4 |
290.5 |
240.7 |
372.8 |
| Sia-3126 |
282.5 |
230.1 |
352.4 |
| Black |
590.3 |
432.4 |
840.2 |
*RE: rutin equivalent; All values are mean of three replicate experiments
Antioxidant Property
The radical scavenging activity of phenolic fraction analyzed in the grain samples is presented in Table 3. It was in the range from 53.90 to 69.41, 41.96 to 64.17 and 60.71 to 79.24 for whole grains, dehusked grains and husk of the samples respectively, which was presented as I% using the above mentioned equation. Amoung the varieties, black variety had the highest antioxidant property i.e., 69.41, 64.17 and 79.24, whereas Sia-3126 variety had the least antioxidant property i.e., 53.90, 41.96 and 60.71 for whole grains, dehusked and husk samples respectively. Also the antioxidant property was found to be significantly lower than that of synthetic antioxidants such as butylated hydroxyanisole (BHA, 64.88) and butylated hydroxytoluene (BHT, 69.08) for the concentration 10 μg/ml.
Table 3: Antioxidant activity of foxtail millet cultivars
|
Variety |
DPPH assay (I%) |
||
|
Whole grain |
Dehusked grain |
Husk |
|
| HMT-1-100 |
56.58 |
45.53 |
67.52 |
| PSC-4 |
55.24 |
42.96 |
61.38 |
| Sia-3126 |
53.90 |
41.96 |
60.71 |
| Black |
69.41 |
64.17 |
79.24 |
All values are mean of three replicate experiments
Similar observations were also made in the case of barley, for which the antioxidant activity of methanolic extracts was found to be lower than that of BHT and gallic acid (25.Maillard et al., 1996). Also a similar study on finger millet reported that, it is a potent source of antioxidants and has potent radical-scavenging activity that is higher than that of wheat and rice; these results corresponded to their phenolic content (26.Sripriya et al., 1996).
HPTLC Analysis
Thin layer chromatography, in particular its high-performance application, is still a widely used analytical technique in analysis of pharmaceuticals, botanicals, foodstuff, environmental and clinical samples (27.Renger et al., 2011). The chromatographic profiles obtained for phenolic fractions in whole grains, dehusked grains and husk samples of the foxtail millet varieties is presented in Fig.2(a&b).
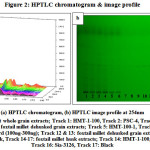 |
Figure 2: HPTLC chromatogram & image profile |
HPLC analytical technique is used by many researchers for the studies for analysis of ferulic acid (28.Pussayanawin & Wetzel, 1987; 29.Sen et al., 1991; 30.Waldron et al., 1996), In one of the study it has been analyzed by traditional TLC method by developing with chloroform–methanol–formic acid (85:15:1) and visualizing the spots at 254nm which is ferulic acid absorbance (31.Mabinya et al., 2006), since the traditional TLC method is done manually and has many disadvantages in quantifying the bioactive compounds. In the present study, a new method i.e., HPTLC which is fast, reliable and accurate for quantification of phenolic compounds is implemented for analyzing ferulic acid. It was analyzed in all the varieties and evaluated for effect of processing (dehusking). Ferulic acid was identified in the sample extracts by comparing the Rf values with the reference standard. Quantification of ferulic acid content in the samples was done using the calibration curve obtained with increasing concentrations (100-300ng) of ferulic acid solution. The results obtained for the whole grain samples was in the sequence Black (284.81ng) > HMT-1-100 (262.81ng) > PSC-4 (247.81ng) > Sia-3126 (187.46ng). Whereas for dehusked grain samples the sequence was; Black (125.14 ng) > HMT-1-100 (123.42 ng) > PSC-4 (112.14 ng) > Sia-3126 (94.31 ng). The husk of the grain samples got the high content of ferulic acid compared to whole grain and dehusked grain extracts, which was in the range from 288.90 to 330.00ng; Black (330.00 ng) > HMT-1-100 (319.35 ng) > PSC-4 (304.79 ng) > Sia-3126 (288.90 ng). Hence the dark coloured variety i.e., Black has got the highest amount of ferulic acid comparatively with other cultivars. In a study on proso millet, in addition to monomers of ferulic acids, dehydrodiferulates were also reported (32.Mattila et al., 2005). Also as per the study of 33.Pradeep and Sreerama (2015), the results revealed that the content and type of phenolic acids varied depending on the type of millet as well as processing method considered.
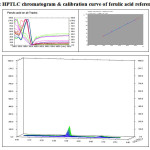 |
Figure 3: HPTLC chromatogram & calibration curve of ferulic acid reference standard |
Chromatographic profiles obtained for ferulic acid reference standard is presented in Fig. 3. The method was validated for linearity, LOD and LOQ by analyzing reference standard and the analytes.
Linearity Range
The linearity range of ferulic acid was obtained by applying a series of spots of different volumes which were applied so as to get 100-300 ng quantity per band, respectively. The plate was scanned, and a curve was prepared with respect to height and area vs. amount per spot.
LOD and LOQ
LOD and the LOQ were calculated based on the standard deviation (SD) of the response and the slope (S) of the calibration curve at levels approaching the LOD according to the formulae: [LOD = 3.3 (SD/S) and LOQ = 10 (SD/S)]. The standard deviation of the response was determined based on the standard deviation of y-intercepts of regression lines.
Conclusion
The distribution of phenolic compounds in foxtail millet cultivars may have important implications in end-use applications and in generating health benefits as functional foods. The analyzed foxtail millet grain cultivars had a significant difference in the phenolic as well as flavonoid content after and before processing (dehusking). Ferulic acid content, evaluated by HPTLC in the millet grains is a novel attempt for the fast and accurate separation and quantification. Results reveal that ferulic acid quantified in whole grains, dehusked grains and husk had a significant difference within the analyzed varieties and also for processing effect (dehusking). These grains have a potential to be used to prepare convenience food products such as ready to eat (RTE) or ready to cook (RTC), which have a dual role of fulfilling the nutrient requirements and at the same time as functional food in combating several health disorders.
References
- Shahidi, F.; Chandrasekara, A. J. Funct. Foods. 2013, 5, 570-581.
CrossRef - Taylor, J. R. N.; Emmanbux, M. N. 2008. Millets. In A. Arend and F. D. Bello. (Eds.). Handbook of gluten free cereal products and beverage, p.119-148. Amsterdam & London: Academic Press.
CrossRef - Panaud, O. 2006. Foxtail millet. In C.Kole (Ed.). Cereals and millets, p.325-332. Berlin, Heidelberg: Springer Verlag.
CrossRef - Fava, F.; Lovegrove, J. A.; Gitau, R.; Jackson, K. G.; Tuohy, K. M. Curr. Med. Chem. 2006, 13, 3005-3021.
CrossRef - Romier, B.; Schneider, Y. J.; Larondelle, Y.; During, A. Nutr. Rev. 2009, 67, 363-378.
CrossRef - Koshihara, Y.; Neichi, T.; Murota, S.; Lao, A.; Fujimoto, Y.; Tatsuno, T. Biochim. Biophys. Acta. 1984, 792, 92-97.
CrossRef - Chandrasekara, A.; Shahidi, F. J. Agric. Food Chem. 2011, 59, 428-436.
CrossRef - Serrano, A.; Palacios, C.; Roy, G.; Cespon, C.; Villar, M. L. Arch. Biochem. Biophys. 1998, 350, 49-54.
CrossRef - Lloyd, B.J.; Siebenmorgen, T.J.; Beers, K.W. Cereal Chem. 2000, 77, 551-555.
CrossRef - Maillard, M.N.; Berset, C. J. Agric. Food Chem. 1995, 43(7), 1789-1793.
CrossRef - Thompson, L.U. Cr. Rev. Food Sci.1994, 34, 473-497.
CrossRef - Sushama, A. M.; V. Rajalakshmi; Sahayog, N. J.; Arun, S. Food Chem. 2011, Toxicol. 49: 2005-2012.
- Kris-Etherton, P. M.; Heckar, K. D.; Bonanome, A.; Coval, S. M.; Binkoski, A. E.; Hilpert, K. F.; Griel, A. E.; Etherton, T. D. Am. J. Med. 2002, 113, 71S-88S.
CrossRef - Adom, K. K.; Sorrells, M. E.; Liu, R. H. J. Agric. Food Chem. 2003, 51(26), 7825-7834.
CrossRef - Malkki, Y. Acta Aliment. 2004, 33(1), 39-62.
CrossRef - Helene, B.; Olivier, R.; Christelle, R.; Michel, P.; Claude, D.; Christophe, B. J. Sci. Food Agric. 2008, 88, 1494-1511.
CrossRef - Hemalatha, S.; Giridhar, G. Biotech. Bioinfor. Bioeng. 2012, 2(2), 653-658.
- Mosier, N.; Wyman, C.; Dale, B.; Elander, R.; Lee, Y.; Holtzaple, M.; Michael, L. Bioresour. Technol. 2005, 96, 673-686.
CrossRef - Spagolla, L. C.; Santos, M. M.; Passos, L. M. L.; Aguiar, C. L. Rev. Ciênc. Farm. Básica Aplicada. 2009. 30(2), 187-191.
- Tiwari, P.; Kumar, B.; Kaur, M.; Kaur, G.; Kaur, H. Int. Pharm. Sci. 2011, 1(1), 98-106.
- Sideney, B. O.; Zípora, M. Q. S.; Francini, Y. K.; Shaiana, P. M. J. Med. Plants Res. 2015, 9(17), 569-575.
CrossRef - Singleton, V. L.; J. A. Rossi. Am. J. Enol. Vitic. 1965, 16, 144-158.
- Yun, S.; Liang, J.; Peng, X.; Yan, L.; Jinsong, B. J. Cereal Sci. 2009, 49, 106-111.
CrossRef - Revanappa, S. B.; Salimath, P. V. J. Food Biochem. 2011, 35, 759-775.
CrossRef - Maillard, M. N.; Soum, M. H.; Boivia, P.; Berset, C. Lebensm. Wiss. Technol. 1996, 3, 238-244.
CrossRef - Sripriya, G.; Chandrasekharan, K.; Murty, V.S.; Chandra, T.S. Food Chem. 1996, 57, 537-540.
CrossRef - Renger, B.; Végh, Z.; Ferenczi-Fodor, K. J. Chromatogr. A. 2011, 1218(19), 2712-2721.
CrossRef - Pussayanawin, V.; Wetzel, D. J. Chromatogr. A. 1987, 391, 243-255.
CrossRef - Sen, A.; Miller, S.; Arnason, J.; Fulcher, R. Phytochem. Anal. 1991, 2, 225-229.
CrossRef - Waldron, K.; Parr, A.; Ng, A.; Ralph, J. J. Sci. Food Agric. 1996, 7, 305-312.
- Mabinya, L.; Mafunga, T.; Brand, J. Afr. J. Biotechnol. 2006, 5, 1271-1273.
- Mattila, P.; Pihlava, J. M.; Hellstrom, J. J. Agric. Food Chem. 2005, 53, 8290-8295.
CrossRef - Pradeep, P. M.; Sreerama, Y. N. Food Chem. 2015, 169, 455-463.
CrossRef

This work is licensed under a Creative Commons Attribution 4.0 International License.
![]()
A New Edition of Web of Science
Journal Impact Factor
2022: 0.5
Five Year: 0.8
Journal is Indexed in

Cabells Whitelist
![]()


