Active and Passive Filter Combination in Scale up Purification of Sardine Fishmeal Oil by-Product
Sugeng Heri Suseno*, Agoes M. Jacoeb, Stephanie Bija, Dian Prima Christiani Hulu and Nadia Fitriana
Faculty of Fisheries and Marine Sciences, Department of Aquatic Product Technology, Bogor Agricultural University, Bogor 16680, Indonesia.
*Corresponding Author E-mail: sugthp@yahoo.com
DOI : http://dx.doi.org/10.13005/ojc/320441
Article Received on :
Article Accepted on :
Article Published : 22 Aug 2016
Sardine fishmeal oil by-product contains a high omega-3, but the quality is still low. The available quality of sardine oil is still limited for animal feed with a low price. Improvement the quality of fish oil can be conducted by active and passive filter combination method. The purpose of this study is to produce fish oil in according to International Fish Oil Standards in scale up production. Neutralization was conducted with the addition of NaOH 22°Be at 50°C for 10 minutes. Bleaching was conducted by using 5% Magnesol as adsorbents at 50°C, and then filtrated with various sizes of filtration, there are 5 μm, 3 μm and 1 μm. Results showed that the level of primary and secondary oxidation tend to decrease with the continuous purification and it was in the range of IFOS (free fatty acid 0.67%, peroxide value 0.87 meq/kg, p-anisidine value 3.66 meq/kg, and totox value 5.48).
KEYWORDS:Bleaching; filtration; neutralization; sardine oil
Download this article as:| Copy the following to cite this article: Suseno S. H, Jacoeb A. M, Bija S, Hulu D. P. C, Fitriana N. Active and Passive Filter Combination in Scale up Purification of Sardine Fishmeal Oil by-Product. Orient J Chem 2016;32(4). |
| Copy the following to cite this URL: Suseno S. H, Jacoeb A. M, Bija S, Hulu D. P. C, Fitriana N. Active and Passive Filter Combination in Scale up Purification of Sardine Fishmeal Oil by-Product. Orient J Chem 2016;32(4). Available from: http://www.orientjchem.org/?p=20830 |
Introduction
Fish oil for human consumption can be divided into three areas: as a pharmaceutical constituent, as a health food component and as an ingredient for the food industry. Further, fish oil is also used as animal feeds, contributing with essential fatty acids needed for normal growth, health and reproduction1. The utilization of fish oil in the world reached 1 million tones in 20112. People’s awareness of the importance of fish oil consumption has implications for the increasing demand of fish oil. It was found that fish oil as supplementation during pregnancy can offer benefits for infants in terms of hand/eye coordination, mental processing,and problem solving3. Sardine is potentially as a source of fish oil, sardine oil production is increase every year. In 2005, 2006, and 2007 sardine oil was produced 3, 261, and 3,599 tones, respectively4.
Statistics Indonesia5 showed that Indonesia sardine exports both fresh and processed in 2015 reached 15,557,130 kg. Sardine has great potential as a source of fish oil because its fat content reaches 15-20%. Suseno6, Batafor7, Suseno et al.8, Suseno et al.9, and Suseno et al.10 stated that omega-3 of fish sardine was quite high, ranging from 8.69 to 27.80 with the content of EPA and DHA by 8.21 to 15.83 and 3.58 to 11.41, respectively. Fish oil of sardine fishmeal and canning by-product contain high omega-3, but Suseno et al.11 stated that the quality of these oils are still low as their soapstock are quite high (around 20%). Ahmadi and Mushollaeni12 also stated that these by-products fish oil usually have high levels of free fatty acids and peroxide value, moreover it has dark color.
The available quality of sardine oil is still limited for animal feed with a low price. One technology that can be disseminated to improve the quality of fish oil is a combination of passive filter method (centrifuge and filter paper utilization of various sizes) and active filters as adsorbent. Some laboratory-scale research on improving the fish oil quality has to be transformed to scale up so it can be utilized widely, not only for feed, but also for human consumption, both for food and pharmaceuticals. The purpose of this study is to produce fish oil in accordance to International Fish Oil Standards in scale up production using combination of adsorption and filtration.
Materials And Method
Materials and Equipments
Crude sardine oil as by-product of fish meal processing industry was used in this study. It was taken from fish meal industry in Bali, Indonesia and kept in cold storage. Sodium hydroxide(NaOH) was used in the neutralization procedure. Magnesol XL (Dallas) was used as bleaching agent. Other supporting test materials were KOH 0.1 N, sodium thiosulfate (Na2S2O3) 0.01 N, acetic acid(CH3COOH), chloroform(CHCl3), potassium iodide (KI), phenolphthalein indicator, starch solution, ethanol 96%, and distilled water. Some equipments used were purifying instruments, polypropylene filter 5 μm, 3 μm, and 1 μm, digital scales, burette, glass tools, aluminum foil, water bath, and mohr pipettes.
Procedure
Scale up purification was carried out through three main stages, there were refining of crude oil used alkali refining method, purification of semi-refined oil used adsorbent as bleaching agent, and filtering used filter tube. Neutralization in this study used NaOH 22°Be at 50°C for 10 minutes. Further bleaching used 5% Magnesol XL as adsorbent11, stirred for 20 minutes, at 50°C, 220 rpm. The results of bleaching then flowed into the holding tank for a while, before going into a series of filtration instruments consisting of 3 filter tools with different sizes, there are 5 μm, 3 μm and 1 μm.
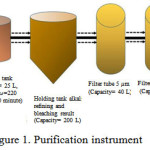 |
Figure 1: Purification instrument |
Determination of Oxidation Parameters
Free Fatty Acids (FFA)
Determination of free fatty acids (FFA) content was according to the standard method AOCS 1998 Ca 5a-4013. Two gram of oil was dissolved in 25 ml of 96% neutral alcohol in Erlenmeyer flask , heated for 10 minutes, then mixed by 2 mL phenolphthalein indicator. The mixture was shaken and titrated with KOH 0.1 N until the pink color appearance was not lost in 10 seconds. The percentage of FFA was calculated by the following equation:
![]()
V = KOH titration (ml)
N = KOH normality
G = Sample weight (g)
M = molecular weight of dominant fatty acid
Peroxide Value (PV)
Determination of peroxide value (PV) was according to the AOAC 2005 No Method 965.33b14. Two grams of sample in Erlenmeyer was mixed with 30 ml mixture solution of acetic acid and chloroform (3:2), then it was added by 0.5mL saturated potassium iodide (KI) solution by stirring, after that 30 ml of distilled water was added. The mixture was titrated by sodium thiosulfate (Na2S2O3) 0.01 N until the color ofsolution turned to yellow. About 0.5 mL of 1% starch indicator solution was added to the mixture solution, the mixture color would change to blue, then titration was continued until the blue color of the solution disappeared. The peroxide value was calculated by the following equation:
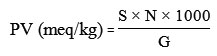
S = Na2S2O3 titration (mL)
N = Na2S2O3 normality
G = Sample weight (g)
p-Anisidine Value (p-AV)
Determination of p-anisidine value (p-AV) was according to standard method AOCS 1998 Cd 18-9013. Solution of test 1 (A1) was created by dissolving 0.5 g of sample into 25 mL of trimethylpentan. Then the compensation solution was made by using trimethylpentan. Solution of test 2 (A2) was created by adding 1 mL of p-anisidine (2.5 g/L) into 5 mL of A1 and averted from light so as the reference solution which was made by adding 1 mL p-anisidine (2.5 g/L) solution to 5 mL trimethylpentane. Then each solution were measured at 350 nm absorbance exactly 10 minutes after the solution was prepared. p-anisidine value determined by the following equation:
![]()
A1 = Absorbance of solution 1
A2 = Absorbance of solution 2
G = Weight of sample (g)
Total oxidation (TOTOX)
Determination of total oxidation is carried out by summing the value 2PV with p-AV, where PV (Peroxide Value) is the number of peroxide and p-AV (p-anisidine Value) is the p-anisidin15. Total oxidation is calculated based on the following equation:
Total oxidation = 2PV + p-AV
Data analysis
Result of purifying process was statistically processed by One Way ANOVA method using SPSS software version 22.0, The differences among the treatments were determined using Duncan’s multiple range test (DMRT)16.
Results and Discussion
Fish oil purification was carried out by several stages. The first stage was neutralization by the addition of NaOH 22 °Be at 50 °C for 10 minutes. This process was carried out by two times, it meant after the first neutralization was done, second neutralization followed by concentration, temperature, and time as well as the first neutralization. This was done to improve the effectiveness of soapstock separation and decreased the levels of oxidation products. The next stage was purification using an adsorbent (bleaching) to improve the clarity of fish oil and reduce the content of primary and secondary oxidation products. Free fatty acid content and peroxide value of alkali refining and bleaching treatment can be seen in the Figure 2.
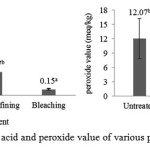 |
Figure 2: Free fatty acid and peroxide value of various purification treatment |
Lipid oxidation is a major problem during extraction, purification, and storage of fish oil17. Huss18 stated that unsaturated fatty acid compounds in fish oil can stimulate the onset of oxidative damage and the oxidation sensitivity of fish oil is higher than other types of oil due to its unsaturated fatty acid amount. As peroxide, Paul and Mittal19 stated that the formation of free fatty acids occur due to hydrolysis and oxidation of oil caused by the presence of free radicals and the decomposition of the double bond during heating. Figure 1 shows that alkali refining and bleaching could reduce free fatty acid content and peroxide value. Alkali refining could reduce FFA significantly 69.02% and PV changes had no significant differences to untreated. Further process by adsorbent could reduce FFA and PV significantly 91.85% and 84.26%, respectively.
In alkali refining, a solution of caustic soda (sodium hydroxide) is mixed with the oil to form soaps. These soaps are dispersed in the aqueous phase together with phospholipids, some pigments, and other compounds20. Alkali refining could reduce FFA as it is saponified by NaOH21. The decline of peroxide value in alkali refining process was caused by decantation of peroxide-bound fraction in the free fatty acids which was saponified with free fatty acid 22.
In line with alkali refining, bleaching used high adsorbent concentration may allow adsorption of impurities occurs maximally9. Synthetic magnesium silicate is an amorphous, insoluble white powder with a high specific surface area and is widely used as an analytical and industrial adsorbent23. Suseno et al.24 stated that impurities adsorption process by Magnesol XL is more efficient, Farag et al.25 stated that Magnesol XL had been used for improving the quality of fried soybean, sunflower, palm and cottonseed oil, the minerals in Magnesol XL was determined to be Si (34.75%), Mg (27.33%), Ca (4.36%), Na (1.92%) and Fe (1.09%). The bleaching results then flowed into the holding tank for a while before going into a series of filtration instruments consisting of 3 different sizes of filter tools, there are 5 μm, 3 μm and 1 μm. Levels of free fatty acids and peroxide value of filtrated oil from 3 different filter sizes were analyzed and compared to each other.
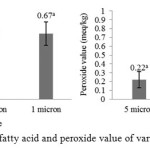 |
Figure 3: free fatty acid and peroxide value of various filter size
|
Based on figure 1, bleached oil was continuously filtered from 5 μm to 3 μm and to 1 μm. Results showed that there was not significant difference in the level of free fatty acid among the filter sizes and there was significant difference in peroxide value between 1 μm to another filter. Furthermore, the levels of free fatty acids and peroxide value was tend to increase after the third filtration. This can be caused by components that help maintain the stability of fish oil as a natural antioxidant was filtered. In addition, the bleached oil was tend to have better level of free fatty acid than filtered oil but have better peroxide value than bleached oil. It can be caused by a long process period, therefore fish oil was exposed to the environment and implicated to further oxidation and hydrolysis. Fish oil which is left in contact with oxygen and exposure to light will undergo rapid oxidation26.
Filter utilization in various sizes was aim to separate adsorbent which was used in bleaching process. Adsorbent separation in some researches were usually used centrifugation, Suseno et al.24 separated adsorbent Magnesol XL using centrifugation at 10,000 rpm for 30 minutes, Suseno et al.9 separated adsorbent bentonite using centrifugation at 10,000 rpm for 10 minutes, and Suseno et al.27 separated adsorbent (Attapulgite, Bentonite and Zeolite) using centrifugation at 10,000 rpm for 10 minutes. Pores filter utilization was tend to be more economic than centrifugation although based on this research result the level of free fatty acid was increase but according to IFOS28, this filtered oil was in the category of decent fish oil for consumption, peroxide value must be below 3.75 meq/kg and the level of free fatty acid must be below 1.13%. Besides free fatty acid and peroxide value, the filtered oil was also identified the secondary oxidation value which can be seen in the Figure 4.
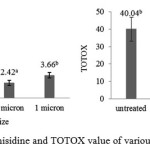 |
Figure 4: p-anisidine and TOTOX value of various filter size
|
P-anisidine value is secondary oxidation products from fat degradation initiated by hydroperoxide and carbonyl resulting in non-volatile by-products29. Based on figure 4, anisidine value of purification by filtering in various sizes of filter were under the IFOS 15 meq/kg and significantly different from untreated. Although it increased in the last filtration but it was not significantly different among them. AccordingGunstone30, the anisidine value is a measurement of carbonyl compounds from decomposition of the hydroperoxides which has medium molecular weight and less volatile. Carbonyl compounds in oxidized lipids are the secondary oxidation products. In addition, Guillen and Cabo31 stated that p-anisidine value is not always in line with the peroxide value, but the high value of the peroxide can cause high values of p-anisidine if the process allowed further degradation. Totox value is the total number of primary and secondary oxidation which obtained by summing twice of the peroxide values and anisidine values15. Based on the result totox value of filtered oil were significantly different to untreated oil and were in the standard of IFOS28 that totox value for human consumption is lower or equal to 20 meq/kg.
Conclusion
It can be concluded that fish meal oil by-product could be purified in scale-up amount by combination of active and passive filtration using purification instrument, the utilization of pores filter was used to separate adsorbent in bleaching process and tend to be more economic than centrifugation and had quality as standard IFOS. The primary and secondary oxidation parameters of final purification were free fatty acid 0.67%, peroxide value 0.87 meq/kg, p-anisidine value 3.66 meq/kg, and totox value 5.48. This purification process can be as reference for fish meal industry to utilize oil by-product as human consumption using purification.
References
- [BIOHAZ] EFSA Panel on Biological Hazards. EFSA Journal. 2010, 8(10), 1874
CrossRef - [NISSUI]. http://www.nissui.co.jp/english/corporate/frontier/04/02.html. 2013, (Retrieved on 6th February 2013).
- Dunstan, J.A.; Simmer, A.; Dixon, G.; Prescott S.L. Archives of Disease in Childhood Fetal Neonatal Edition. 2008, 93, 45–50.
CrossRef - [FAO] www.fao.org/fishery/statistics/globalcommodities-production/en. 2010, (Retrieved on 14th October 2010).
- Statistics Indonesia. https://www.bps.go.id/. 2015, (Retrieved on 1st May 2016).
- Suseno, S.H. Orient J Chem. 2014, 30(3), 975-980
- Batafor, Y.M.J.; Suseno, S.H.; Nurjanah. Global Journal of Biology, Agriculture and Health Sciences. 2014, 3(1), 226-230
- Suseno, S.H.; Tambunan, J.E.; Ibrahim, B.; Saraswati. Advance Journal of Food Science and Technology. 2014, 6(5), 588-592
- Suseno, S.H.; Nurjanah; Jacoeb, A.M.; Saraswati. Advance Journal of Food Science and Technology. 2014, 6(1), 60-67
CrossRef - Suseno, S.H.; Zamzami, R.; Nurilmala, M.; Saraswati. Seminar Nasional Ikan VIII & Kongres IV Masyarakat Iktiologi Indonesia. 2014, (Held on 5th June 2014)
- Suseno, S.H.; Tajul, A.Y.; Nadiah, W.A. International Food Research Journal. 2011, 18, 255-264
- Ahmadi, K.; Mushollaeni, W. Jurnal Teknologi Pertanian. 2007, 8(2), 71-79.
- [AOCS] American Oil Chemists’ Society. Free Fatty Acids In: Official Methods and Recommended Practices of the American Oil Chemists Society. Vol 5a.5thed. 1998. Champaign (US): AOCS Press.
- [AOAC] Association of Official Analytical Chemist. Official Method of Analysis of the Association of Official Analytical of Chemist. 2005. Gaithersburg, Maryland (US): Published by The Association of Analytical Chemist, Inc.
- Perrin, J.L. Determination of Alteration. In: Karleskind A, Wolff JP. (Eds.) Oils and Fats, Manual.. 1996., 2 Paris (FR): Lavoisier Publishing
- Steel, R.G.D.; Torrie, J.H. Principles and Procedure of Statistics (2nded.). 1980. New York (US): McGraw Hill.
- Huang, J.; Sathivel, S. Journal of Food Engineering, 2010, 96, 51–58
CrossRef - Huss, H. Fresh Fish Quality and Quality Changes.1998, Rome (IT): FAO
- Paul, S.; Mittal, G.S. Regulating. Critical Rev in Food Science and Nutrient. 1997, 37(7), 635-662.
CrossRef - Kirk, K.E.; Othmer, V.F. Encyclopedia of Chemical Technology. 2005, New York (US): John Willey and Sons, Inc.
- Estiasih, T.; Ahmadi, K. Jurnal Teknologi Pertanian. 2012, 3, 116-128.
- Aisyah, S.; Yulianti, E.; Fasya, A.G. Alchemy. 2010, 1, 93-103.
- Munson, B.L.; Bertram, J.D.; Caldwell. Treatment of Cooking Oils and Fats with Magnesium Silicate and Alkali Materials. 1996. U. S. Patent 5597600.
- Suseno, S.H.; Tajul, A.Y.; Nadiah, W.A. International Research Journal of Biochemistry and Bioinformatics. 2011, 1(5), 103-113.
- Farag, R.S.; Anany, A.M. Journal of the Science of Food and Agriculture. 2006, 86, 2228–2240.
CrossRef - Davis, L.; Goodwin, L.; Smith, G.; Hole, M. J Sci Food Agric. 1993, 62, 355-359.
CrossRef - Suseno, S.H.; Tambunan, J.E.; Ibrahim, B.; Izaki, A.F. Advance Journal of Food Science and Technology. 2014, 6(5), 622-628.
- [IFOS] International Fish Oil Standard http://www.omegavia.com/best-fish-oil-supplement-3/. 2011, (Retrieved on 3rd May 2016).
- Aidos, I.R.; Schelvus-Smit, M.B.; Veldnan, J.; Luten, A.V.D.; Padt; Boom R.M. J. Agric. Food Chem. 2003, 51(7), 1897–1903.
CrossRef - Gunstone, F.D. Vegetable Oils in Food Technology: Composition, Properties and Uses. 2002. Oxford (UK): Blackwell Publishing Ltd., CRC Press.
- Guillen, M.D.; Cabo, N. Food Chemistry. 2002, 77, 503-510 AnisidineValue (meq/kg)
CrossRef

This work is licensed under a Creative Commons Attribution 4.0 International License.
![]()
A New Edition of Web of Science
Journal Impact Factor
2022: 0.5
Five Year: 0.8
Journal is Indexed in

Cabells Whitelist
![]()


