Synthesis of Zno-Nife2o4 Magnetic Nanocomposites by Simple Solvothermal Method for Photocatalytic Dye Degradation Under Solar Light
Rahmayeni*, Zulhadjri, Novesar Jamarun, Emriadi and Syukri Arief
Material Chemistry Laboratory, Department of Chemistry, Faculty of Mathematics and Natural Sciences, Andalas University, Padang, Indonesia. <p"> Corresponding Author Email: rahmayenni83@yahoo.com
DOI : http://dx.doi.org/10.13005/ojc/320315
Article Received on : May 18, 2016
Article Accepted on : June 29, 2016
Article Published : 27 Jun 2016
ZnO-NiFe2O4 magnetic nanocomposite photocatalysts were successfully synthesized by simple solvothermal method using nitric salts as starting materials and ethanol as solvent. The synthesized samples were characterized by XRD, FESEM-EDX, TEM, DRS-UV-vis, VSM, and FTIR instruments. Photocatalytic activity of the samples was evaluated by dye degradation under solar light irradiation. The results show that the diffraction peaks of nanocomposites correspond to the hexagonal wurzite of ZnO and spinal cubic structure of NiFe2O4. The microstructure studies revealed that nanocomposites were dominated by granular-like of ZnO nanoparticles were synthesized at 180°C and rod-like at 200°C. The estimated band gap value of ZnO-NiFe2O4 (1:0.01) nanocomposites is 2.78 eV which is lower than ZnO. The magnetic saturation (Ms) result showed a super paramagnetic behavior for nanocomposites. It was found that the photocatalytic activity of synthesized nanocomposites were higher than ZnO and NiFe2O4.
KEYWORDS:ZnO-NiFe2O4 nanocomposites; solvothermal; superparamagnetic; photocatalysts; solar light
Download this article as:| Copy the following to cite this article: Rahmayeni, Zulhadjri, Jamarun N, Emriadi, Arief S. Synthesis of Zno-Nife2o4 Magnetic Nanocomposites by Simple Solvothermal Method for Photocatalytic Dye Degradation Under Solar Light. Orient J Chem 2016;32(2) |
| Copy the following to cite this URL: Rahmayeni, Zulhadjri, Jamarun N, Emriadi, Arief S. Synthesis of Zno-Nife2o4 Magnetic Nanocomposites by Simple Solvothermal Method for Photocatalytic Dye Degradation Under Solar Light. Orient J Chem 2016;32(2). Available from: http://www.orientjchem.org/?p=18165 |
Introduction
Semiconductors are particularly useful as photocatalysts due to a favorable combination of electronic structure, light absorption properties, and excited-state lifetimes1. Among various semiconductors employed, zinc oxide (ZnO) is well known to be an excellent photocatalyst2-3. Some researchers have reported that ZnO as photocatalyst exhibit superior advantages than the others, which is ascribed to its higher quantum efficiency, chemical stability, non-toxicity, and lower cost 4, 5. Unfortunately, ZnO has a wide band gap (~3.37 eV), which is unfavorable for absorption well of visible light of solar6, 7.In fact, visible light contributes more than 50% of the sun irradiation and it is important to fabricate an excellent visible-light response photocatalyst for the practical uses8. To improve the performance of ZnO several attempts have been made to shift its absorption band from UV to visible light region such as doping or coupling ZnO with metals, non metals, and metal oxides9-11. However, the difficulty in separating of those ZnO-based photocatalysts from aqueous solutions limits their application in dyes waste water treatment12. One of the effective strategies to solve the problem is to prepare the magnetic photocatalysts with well recyclability by coupling of ZnO with strong magnetic materials like spinal ferrites of CoFe2O4, MgFe2O4,ZnFe2O4, and CaFe2O45, 13-15. The nickel ferrite (NiFe2O4) is one of the most important spinal ferrites due to cubic inverse-spinal-based structure, high saturation magnetization, and narrow band gap (1.6 eV)16,17. Coupling between ZnO and NiFe2O4 forming a semiconductor photocatalysts which enhanced activity under visible light. Theoretically, when ferrite materials are coupled with ZnO, the heterojunction formed and then the photogenerated electrons and holes were separated efficiently, leading to enhancement in photocatalytic activity18, 19.Furthermore, the presence of magnetic spinal ferrite facilitates the recycling process of these photocatalysts because they are able to be separated easily by external magnetic field after photocatalytic reactions. This ferrite has been successfully used to improve the activity of TiO2 in the visible light region20, 21. Recently, NiFe2O4/ZnO hybrid nanoparticles were synthesized by ultrasonic treatment and hydrothermal method and applied for decolorization of Congo red has been reported22. Ferromagnetic NiFe2O4/ZnO hybrid nanoparticles prepared by the hydrolysis of zinc acetate in the presence of NiFe2O4 in w/o microemulsion, using CTAB as the surfactant, n-pentanol as the cosurfactant, cyclohexane as the oil phase have also been reported23.In this present work ZnO-NiFe2O4 nanocomposites were synthesized by simple solvothermal method using nitric salts as starting materials and ethanol as solvent. The activity of the samples was evaluated by photocatalytic degradation of Rhodamine B dye under solar light irradiation. The influence of operating parameters on the photodegradation, namely the amount of NiFe2O4, catalyst loading, reaction temperature, and the length of exposure time were investigated.
Materials and Methods Materials
Ni(NO3)2.6H2O, Fe(NO3)3.9H2O, Zn(NO3)2.4H2O, NaOH, ethanol p.a. (all materials purchased from Merck), and Rhodamine B. All reagents were analytically pure and used without further purification.
Synthesis of NiFe2O4nanoparticles
The nanoparticles of NiFe2O4 were obtained by dissolved 10 mmol Ni(NO3)2.6H2O and 20 mmol Fe(NO3)3.9H2O in 100 mL distilled water and mixed under magnetic stirring for 30 min. Then, NaOH (2 M) solutions were added dropwise into the mixture with continuous stirring to adjust the pH value of 12. The suspension formed was transferred into Teflon-lined stainless autoclave. The autoclave was sealed and maintained at 180°C for 3 h. Then, the autoclave was cooled naturally to room temperature and the resulting products were collected, washed with distillated water, and dried at 70°C for 2 h. NiFe2O4 nanoparticles obtained in this stage were used to prepare the ZnO/NiFe2O4 nanocomposites.
Synthesis of ZnO-NiFe2O4nanocomposites
The nanocomposites of ZnO-NiFe2O4 were synthesized by simple solvothermal method. In typical synthesis Zn(NO3)2.4H2O and NiFe2O4 nanoparticles were dissolved in 40 mL ethanol and then mixed under magnetic stirring for 30 min. The subsequent procedures as similar to the synthesis of NiFe2O4 nanoparticles. In order to study the effect of amount of NiFe2O4 on the photocatalytic activity of ZnO/NiFe2O4 nanocomposites, a series of ZnO/NiFe2O4 with different NiFe2O4 amount were synthesized. The obtained products with different ZnO:NiFe2O4 mole ratio value 1: 0.01, 1:0.05, and 1:0.1 were labeled as NNi1, NNi2, and NNi3, respectively. In addition, the variation of reaction temperatures on the heating suspension in autoclave were done only for NNi1. The temperature were 160, 180, and 200°C for the NN1-160, NN1-180, and NN1-200, respectively. For comparison purposes, the same procedure was used for the preparation of ZnO using zinc nitric as initial material.
Characterization
The structures of synthesized samples were studied by X-ray diffraction (XRD; XPERT-PRO Diffractometer system). The surface morphology and composition of samples were scanned using field emission scanning electron microscopy equipped with an energy dispersive X-ray spectrometer (FESEM-EDXS; FEI Inspect F50) and transmission electron microscopy (TEM, JEM-1400). Magnetic properties of synthesized samples were measured by a vibrating sampler magnetometer (VSM; OXFORD VSM 1.2H). Diffuse reflectance spectrophotometer UV-vis (Shimadzu UV-vis 2450 spectrophotometer) was used to record the absorbance spectra of samples at room temperature. The interaction in nanocomposites was investigated by Fourier transform infrared spectroscopy (FTIR Thermo Nicolet iS5). Thermogravimetry (TG) of NNi1 nanocomposite was recorded at a heating rate of 10°/min using a thermogravimetric analyzer (LECO TGA 701).
Evaluation of photocatalytic activity
Photocatalytic activity of nanocomposites was evaluated by degradation of Rhodamine B (Rd B) under ambient atmospheric conditions using solar light irradiation. The procedure was adopted from the previous work24. For each experiment, 0.015 g of photocatalyst was dispersed in 20 mL of Rd B dye (10 mg/L) in aqueous solution. The mixture was kept under solar light irradiation and 5 mL samples were taken after irradiated for 1, 2 and 3 h (from 11:00 am to 14:00 pm). The progress of photocatalytic degradation of Rd B was monitored by measuring the absorbance in UV–vis spectrophotometer at the wave length of 553 nm. The influence of the loading amount of catalyst, reaction temperature, and the length of exposure time on the photodegradation process were investigated. The reusability of photocatalysts were carried out by collected the nanoparticles after first reaction cycles, and then evaluated as same as fresh sample. For comparison purposes the same procedure was also performed on ZnO and NiFe2O4. Degradation percentage of Rd B was calculated according to follow equation, degradation (%) = (A0-A)/A0 x100%25.
Results and Discussion Structural studies
Fig.1 shows the XRD patterns of the ZnO, NiFe2O4,and nanocomposites of NNi1, NNi2, and NNi3. The diffraction peaks of ZnO sample are observed at 2Ө = 31.76o, 34.42o, 36.25o, 47.52o, 56.57o, 62.83o, 66.37o, 67.91 and 69.04o. These peaks are analogue to hexagonal wurzite structure of ZnO (ICDD No. 01-078-3325). The diffraction peaks of NiFe2O4 sample appear at 2Ө = 30.39°, 35.72°, 43.43o, 53.91o, 57.43o, and 62.95o corresponding to spinal cubic NiFe2O4 (ICDD No. 01-071-3850). The XRD patterns of nanocomposites (NNi1, NNi2 and NNi3) show the same pattern with ZnO sample. The main diffraction peaks of NiFe2O4 (2Ө = 35o) is not observed for NNi1 which is probably ascribed to the small amount and the lower crystallinity of NiFe2O4 in NNi1. Increasing amount of NiFe2O4 in nanocomposites lead to clearly the main peaks of NiFe2O4 as shown in NNi2 and NNi3. The average crystallite size of ZnO in nanocomposites (NNi1, NNi2 and NNi3) was determined by Debey-Scherrer14. They value are estimated around 30 nm. The effect of reaction temperature on the size of ZnO and NiFe2O4 crystalline phase in nanocomposites NN1 was also studied by heating the suspension in autoclave at different temperature ie; 160, 180, and 200 °C. The average crystallite size of ZnO in NNi1 is 24.27, 25.85, 27.60 and 33.55 nm for NN1-160, NN1-180 and NN1-200°C, respectively. These results indicate that the size of the ZnO crystalline in NNi1 increased with increasing the reaction temperature due to the temperature contributes to the growth of particles as well as crystallization.
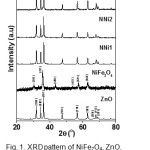 |
Figure 1: XRDpattern of NiFe2O4, ZnO, and nanocomposites (NNi1, NNi2 and NNi3). Click here to View figure |
Morphology and composition The morphology and elements composition NN1-180 and NN1-200 were analyzed by FESEM-EDS and more over for NN1-200 the morphology was also analyzed by TEM. All the images for both techniques analysis are illustrated in Fig 2. The morphology of NNi1-180 (Fig. 2a) show the granular-like shape with small agglomeration, meanwhile, the NNi1-200°C (Fig. 2b) have regularly shape lead to rod-like formation. Furthermore, the TEM image in Fig. 2c illustrates clearly the NNi1 shape with rod-like particles which was synthesized at 200°C. The rod-like particles of NN1-200 have average of 40 nm and 200 nm in width and length, respectively. From these resuts can be concluded that the increase of temperature affects the formation and size of particles. As reported by Zhu et. all. 26, the shape of ZnO particles easily changed with a change in temperature and the reaction conditions. The EDS spectra of NNi1 composition elements are shown in Fig. 2d. In this spectra can be observed the peaks of Zn Ni, Fe and O elements with a percentage of 86.06, 0.70, 1.50 and 11.74%, respectively. These results indicate that NiFe2O4 particles have been coupled with ZnO.
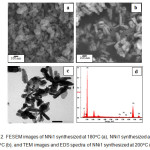 |
Figure 2: FESEM images of NNi1 synthesized at 180oC (a), NNi1 synthesized at 200oC (b), and TEM images and EDS spectra of NNi1 synthesized at 200oC (c-d). Click here to View figure |
Magnetic properties analysis
Fig. 3. shows the magnetic histeresys loops of NNi1, NNi2, and NNi3 measured by vibrating sample magnetometer (VSM). The saturation magnetization (Ms) value of these nanocomposites increase gradually with the increasing amount of NiFe2O4, which is 1.04 emu/g, 4.32 emu/g, and 8.77 emu/g for NNi1, NNi2, and NNi3, respectively. These values indicate superparamagnetic properties. It is well known that ZnO is diamagnetic27, while synthesized NiFe2O4 nanoparticles in this work are typical ferromagnetics with the Ms of 52.8 emu/g which is higher than Ms value reported for NiFe2O4 earlier by the another authors28-30. Appearance superparamagnetic properties in nanocomposites are due to coupling the ferromagnetic of NiFe2O4 with diamagnetic of ZnO. The presence of these magnetic properties in composites facilitate the separating process of catalyst from the liquid.
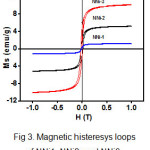 |
Figure 3: Magnetic histeresys loops of NNi1, NNi2, and NNi3. |
Optical properties analysis
UV-vis DRS was used to investigate the optical properties of the samples. Fig.4. gives the UV-vis DRS spectra of NiFe2O4, ZnO, and NNi1. The results show that NiFe2O4 nanoparticles have a good ability to absorb light in the visible area due to the small band gap of NiFe2O4, however this nanoparticle is rarely applied as a visible light photocatalyst alone since the electrons could not survive long in the conduction band and it will return to the valence band (h+). Consequently photodegradation processes do not take place as it should19. Otherwise, pure ZnO absorbs strongly in the UV light area (below 400 nm) and weakly in visible light area. Combining both of NiFe2O4 and ZnO can enhance absorptive capacity in the visible light region and can be applied for photocatalytic processes under solar light. The band gap (Eg) of NiFe2O4, ZnO and NNi1are 1.64, 3.12, and 2.78 eV, respectively which were determined by Eg=1240/λ equation 31.
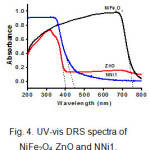 |
Figure 4: UV-vis DRS spectra of NiFe2O4, ZnO and NNi1. |
TG Analysis
Thermal stability of NNi1 nanocomposite sample was analyzed by TGA technique as shown in Fig. 5. There are two steps weight loss of sample by increasing the temperature. First step, the weight loss of 2% around 100°C is due to the evaporation of absorbed water in the powders. The second one is the weight loss in the area around 200-300°C predicted as organic residues that remaining in the sample with the weight loss of 4%. The temperature along 400 to 1000°C there is no significant weight loss occurred. In conclusion the weight losses of 6% on the whole could be said the sample having thermal stability under this temperature.
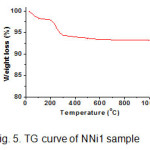 |
Figure 5: TG curve of NNi1 sample Click here to View figure |
FTIR Analysis
Interaction between NiFe2O4 and ZnO in nanocomposites was studied by the FTIR spectra as illustrated in Fig.6. The FTIR spectra of nanocomposite show a sharp peak in the area around 500 cm-1 which is the characteristic peaks for Zn-O vibration, while the combination of ferrite and ZnO peaks seen in the area around 601 cm-1. The broad peak located at 3500 cm-1 corresponds to the O-H vibration of absorbed water. In the spectra of synthesized NiFe2O4 is observed a sharp peak at 601 cm-1 to vibration intrinsic of tetrahedral site and at 417 cm-1 to the octahedral vibration. As reported by previous researchers that based on the geometrical configuration of the oxygen nearest neighbors the metal ions are situated in two different sublattices, which are tetrahedral and octahedral in ferrites. The vibrational spectra of ferrite with a high frequency in the region of 610-580 cm-1 to the intrinsic vibration of tetrahedral and lower frequency in the region of 440-400 to octahedral site 23.
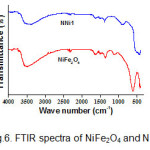 |
Figure 6: FTIR spectra of NiFe2O4 and NNi1. Click here to View figure |
Photocatalytic activity
The photocatalytic activity of the samples was evaluated by the degradation of Rd B as an example of dye under solar light irradiation as shown in Fig. 7. It is found that without photocatalysts the degradation percentage of Rd B is 19% for 3h. In the presence of NiFe2O4, there is not significant increase of the Rd B degradation. However, the degradation of Rd B was rapidly increasing with as the addition of any catalysts. From Fig. 7a, Rd B was degraded around 99, 96 and 92% for 3 h in the presence of NNi1, NNi2 and NNi3, respectively. The pure ZnO shows activity in photodegradation of Rd B with the degradation in solution is 68% for 3 h. These results indicate that the photocatalytic activity of nanocomposites were higher than ZnO and NiFe2O4. The most excellent photocatalytic activity under solar light irradiation was performed by NNi1 which is 99% of degration for 3 h. These results are in agreement with the DR-Uv-vis analysis given in Fig. 4 in which the absorption area for NNi1 samples are shift into visible light consequently applicable under visible light region of the sun. The mechanism of increase the degradation percentage of Rd B in the presence of synthesized nanocomposites can be described as follows: under solar light irradiation the electrons in valence band (CB) of NiFe2O4 and ZnO will be excited to the conduction band (CB) separately, leaving holes with positive charge in VB. The difference of band between NiFe2O4 and ZnO will facilitate the photogenerated electrons transfer from the CB of NiFe2O4 to the CB of ZnO and the holes move from the VB of ZnO to the VB of NiFe2O4, respectively. After that, the generated electrons react with O2 contained in solution to yield O2– ions will further react with H2O, forming OH. hydroxyl radical. Hydroxyl radical is a very active group that will attack the compounds in the Rd B to be the simple compounds such as CO2 and H2O11.
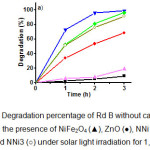 |
Figure 7: Degradation percentage of Rd B without catalyst (■), in the presence of NiFe2O4 (▲), ZnO (●), NNi1 (▼), NNi2 (♦) and NNi3 (○) under solar light irradiation for 1, 2, and 3 h. |
The photocatalytic activities of the sample NNi1-160, NNi1-180, and NNi1-200 on degradation of Rd B can be seen in Fig 8a. The best photocatalytic activities is shown by NNi1-200 due to the composite particle shape more regular and there is no agglomeration as shown in SEM and TEM image (Fig.2). The increase in reaction temperature on the synthesis of NNi1 influences the morphology and size of nanocomposite particles and it is affect on photocatalytic activity. The uniform particle shape and size of nanocomposite is estimated to improve the photocatalytic activity. From economic viewpoint, catalyst loading is an important parameter in heterogeneous photocatalysis reaction. In order to determine the effect of catalyst loading on photodegradation of Rd B, the experiment were carried out by increasing catalyst loading of NNi1 from 0.005 to 0.02 g (Fig. 8b). The degradation percentage of Rd B increased as catalyst loading increasing. After 3 h irradiation, Rd B degradation percentage by catalyst loading of 0.015 mg give almost the same value with 0.02 g, which are 99.1 and 99.4%, respectively. These mean the catalyst loading maximum for degradation of Rd B is 0.015 g in 20 mL solution (10 mg/L). It surely these materials are potential if used as a photocatalyst to degrade dye in water.
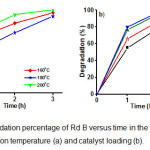 |
Figure 8: The degradation percentage of Rd B versus time in the presence of NNi1; the effect of reaction temperature (a) and catalyst loading (b). Click here to View figure |
The reaction kinetic of photocatalytic degradation of Rd B was also studied and the results are given in Fig. 9a. The influence of initial concentration of Rd B on the photocatalytic degradation rate is described by first-order kinetic model. According to Langmuir-Hinshelwood, kinetic model of first-order is ln(Co/C) = kt, where Co is the initial concentration of Rd B, C is the concentration of Rd B at time t and slope k is the rate constant 22. The apparent rate constant of NNi1 (k) is 0.025375 min-1 and the correlation constant for the fitted lines were calculated to be R2 = 0.9903. In order to evaluate the photostability and reusability of nanocomposite, five recycling test for degradation of Rd B under solar light have been conducted only for NNi1 (Fig 9b). The nanoparticles of NNi1 were collected by filtered, washed with distillated water and then dried at 100°C for one hour. It is clearly seen that recycled NNi1 still have good activity for Rd B degradation after five cycles, indicating the photostability of these catalysts. The degradation percentage decreased insignificantly and this result shows the reusability of NNi1 as photocatalyst is promising.
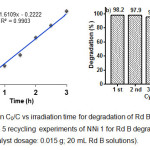 |
Figure 9: (a) Plot ln C0/C vs irradiation time for degradation of Rd B using NNi1 as catalyst and (b) 5 recycling experiments of NNi 1 for Rd B degradation (initial Rd B 10 mg/L; catalyst dosage: 0.015 g; 20 mL Rd B solutions). Click here to View figure |
Conclusion
In this present study, we have successfully synthesized magnetic nanocomposite photocatalysts of ZnO-NiFe2O4 by simple solvothermal method using nitric salts as starting materials and ethanol as solvent. The structural and elemental analysis confirmed the formation of ZnO-NiFe2O4 nanocomposites and the specific ratios of Zn, Ni, Fe and O. The microstructure studies revealed that nanocomposites were dominated by granular-like of ZnO nanoparticles that synthesized at 180°C and rod-like at 200°C. The estimated band gap value of ZnO-NiFe2O4 (1:0.01) nanocomposites is 2.78 eV which is lower than ZnO. The magnetic saturation (Ms) result showed a ferromagnetic behavior of NiFe2O4 and super paramagnetic of ZnO:NiFe2O4. The photocatalytic activity of all nanocomposites were higher than ZnO and NiFe2O4 and the most excellent photocatalytic activity under solar light irradiation was performed by nanocomposite with the molar ratio of ZnO:NiFe2O4 was 1:0.01 which 99% of Rd B was degradated after irradiated for 3 h. Hence, this nanocomposite is very potential if it used for degradation of dyes under solar light and then can be separated from the liquid using external magnetic field to be used in the subsequent photocatalytic processes.
Acknowledgements
Authors are grateful to the Ministry of Research, Technology and Higher Education, Indonesia and LPPM of Andalas University for supporting this work through the Fundamental grant with contract number: 28/H.16/Fundamental /LPPM/2015.
References
- Herna´ndez-Ramı´rez A.; Medina-Ramı´rez I. Photocatalytic Semiconductors. Springer Int. Pub., Switzerland, DOI 10.1007/978-3-319-10999-2_1, 2015, 1-40
- Borgohain C.; Senapati K. K.; Sarma K. C.; Phukan P. Journal of Molecular Catalysis A : Chemical. 2012, 363–364, 495–500
CrossRef - Zhao X.; Lou F.; Li M.; Lou X.; Li Z.; Zhou J. Ceramics International. 2014, 40: 5507–5514
CrossRef - Xu C.; Cao L.; Su G.; Liu W.; Liu H.; Yu Y.; Qu X. Journal of Hazardous Materials. 2010, 176, 807–813
CrossRef - Su N. R.; Lv P.; Li M.; Zhang X.; Li M.; Niu J. Materials Letters. 2014, 122, 201–204
CrossRef - Castro T. J.; da Silva S. W.; Nakagomi F.; Moura N. S.; Franco J. A.; Morais P. C. Journal of Magnetism and Magnetic Materials. 2015, 389, 27–33
CrossRef - Sunitha S.; Rao A. N.; Karthikeyan J. Oriental Journal of Chemistry. 2015, 31, (1), 107-112
- Guo X.; Zhu H.; Li Q. Applied Catalysis B, Environmental. 2014, 160–161, 408–414
CrossRef - Dhiman P. J.; Chand A.; Kumar R. K; Kotnala K. M.; Batoo M. S. Journal of Alloys and Compounds. 2013, 578, 235–241
CrossRef - Wu C. Applied Surface Science. 2014, 04, 217
- Xu L.; Wei B.; Liu W.; Zhang H.; Su C.; Che J. Nanoscale Research Letters 2013, 8, 536
CrossRef - Sun L.; Shao R.; Tang L.; Che Z. Journal of Alloys and Compounds. 2013, 564, 55–62
CrossRef - Wilson A.; Mishra S. R.; Gupta R.; Ghosh K. Journal of Magnetism and Magnetic Materials. 2012, 324, 2597–2601
CrossRef - Shao R.; Sun L.; Tan L.; Chen Z. Chemical Engineering Journal. 2013, 217, 185-191
CrossRef - Shifu C.; Wei Z.; Wei L.; Huaye Z.; Xiaoling Y. Chemical Engineering Journal. 2009, 155, 466-473
CrossRef - Ren A.; Liu C.; Hong Y.; Shi W.; Lin S.; Li P. Chemical Engineering Journal 2014, 258, 301–308
CrossRef - Melo R. S.; Silva F. C.; Moura K. R. M.; Menezes A. S.; Sinfrônio F. S. M. Journal of Magnetism and Magnetic Materials. 2015, 381,109–115
CrossRef - Su N. R.; Lv P.; Li M.; Zhang X.; Li M.; Niu J. Materials Letters. 2014, 122, 201–204
CrossRef - Casbeer E.; Sharma V. K.; Li X. Z. Separation and Purification Technology 2012, 87, 1–14
CrossRef - Rahmayeni, Arief S.; Stiadi Y.; Rizal R.; Zulhadjri. Indonesian Journal of Chemistry. 2012, 12, 3, 229-234
CrossRef - Shihong X. U.; Shangguan W.; Yuan J.; Chen M.; Shi J. Chem. Eng. 2007, 15(2), 190-195
- Zhu H. Y.; Jiang R.; Fu Y. Q.; Li R. R.; Yao J. Applied surface science. 2016, 369, 1-10
CrossRef - Jiang J.; Ai L. H.; Li L. C.; Liu H. Journal of Alloys and Compounds. 2009, 484, 69–72
CrossRef - Rahmayeni; Arisanti D.; Stiadi Y.; Jamarun N.; Emriadi, Arief S. Journal of Chemical and Pharmaceutical Research. 2015, 7(9S),139-146
- Saikia L.; Bhuyan D.; Saikia M.; Banajit M.; Dipak K. D.; Pinaki S. Applied Catalysis A: General. 2015, 490, 42–49
CrossRef - Zhu Y.F.; Fan D.H.; Dong Y.W.; Zhou G.H. Superlattices and Microstructures. 2014, 7, 261–272
CrossRef - Arora A. K.; Devi S.; Jaswal V. S.; Singh J.; Kinger M.; Gupta V. D. Oriental Journal of Chemistry. 2014, 30, (4), 1671-1679
- Reddy M. P.; Madhuri W.; Sadhana K.; Kim I. G.; Hui K. S.; Kumar K. V. S.; Reddy R. R. Journal Sol-Gel Sci. Technol. 2014, 70, 400-404
CrossRef - Phadatare M. R.; Salunkhe A. B.; Khot V. M.; Sathish C. I.; Dhawale D. S.; Pawar S. H. Journal of Alloys and Compounds. 2013, 546, 314–319
CrossRef - Prabhakaran T.; Hemalatha J. Ceramics International. 2014, 40, 3315–3324
CrossRef - Lamda R.; Ahmad U.; Surinder K. M.; Sushil K. K. Journal of Alloys and Compounds. 2015, 620, 67–73
CrossRef

This work is licensed under a Creative Commons Attribution 4.0 International License.
![]()
A New Edition of Web of Science
Journal Impact Factor
2022: 0.5
Five Year: 0.8
Journal is Indexed in

Cabells Whitelist
![]()


