Stability Indicating Method Development and Validation for the Simultaneous Determination of Levosulpiride and Esomeprazole in Bulk and Formulation
Narottam Pal1*, Avanapu Srinivasa Rao1 and Pigilli Ravikumar2
1Department of Pharmaceutical Analysis, Bhaskar Pharmacy College, Yenkapally, Moinabad, Hyderabad, India, PinCode-50075.
2Bio-Analytical Department, Aizant Drug Research Solution Pvt. Ltd, Hyderabad, India, PinCode-50014.
Corresponding Author Email Id: narottampal8224@gmail.com,
DOI : http://dx.doi.org/10.13005/ojc/320353
Article Received on : April 04, 2016
Article Accepted on : June 10, 2016
Article Published : 26 May 2016
Present study deals with the development and validation of a rapid, simple and efficient method for the simultaneous determination as well as stability studies of Esomeprazole and Levosulpiride in bulk and formulations. The method involves reverse phase High Performance Liquid Chromatography (HPLC) using stationery Phase ODS C18 column (250mm x 4.6 mm, 5m), Mobile phase as Phosphate buffer, Acetonitrile and methanol at the ratio of 65:30:5, subjected to isocratic elution,observed the peaks with PDA detector wavelength 254 nm, maintaining the mobile phase flow rate at 1ml/minute, keeping the run time fixed for 8 minutes. Column temperature was maintained at 300C, pH of the mobile phase was 3.0; complete separation of both the compounds took place within four minutes. Retention time was found 2.41 minutes and 3.56 minutes for Esomeprazole and Levosulpiride respectively. The developed new method was validated as per ICH guideline taking the parameters like accuracy, precision, linearity, limit of detection, limit of quantification, intermediate precision and robustness. In the linearity test Correlation Coefficient was found to be 0.999 for both the molecules, percentage relative standard deviation results from precision studies were 0.34 and 0.44; mean percentage recoveries in accuracy studies were found to be 100.35% and 100.14% for Esomeprazole and Levosulpiride respectively. Very low concentrations of LOD and LOQ indicate the method was highly sensitive enough. The designed validated method can be used effectively in the laboratory for regular determination of Levosulpiride and Esomeprazole in formulation and bulk form.
KEYWORDS:Simultaneous; HPLC; stability studies; Esomeprazole; Levosulpiride
Download this article as:| Copy the following to cite this article: Pal N, Rao A. S, Ravikumar P. Stability Indicating Method Development and Validation for The Simultaneous Determination of Levosulpiride and Esomeprazole in Bulk and Formulation. Orient J Chem 2016;32(3). |
| Copy the following to cite this URL: Pal N, Rao A. S, Ravikumar P. Stability Indicating Method Development and Validation for The Simultaneous Determination of Levosulpiride and Esomeprazole in Bulk and Formulation. Orient J Chem 2016;32(3). Available from: http://www.orientjchem.org/?p=16773 |
Introduction
Esomeprazole1 is a gold standard proton pump inhibitor, used up to a great extant in gastroenterology, chemically known as (S)-5-methoxy-2-((4-methoxy-3, 5-dimethyl pyridine-2-yl) methyl sulfinyl)-3H-benzoimidazole. Figure I. represents the structure of Esomeprazole.
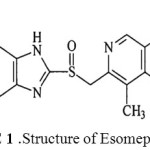 |
figure 1: Structure of Esomeprazole Click here to View figure |
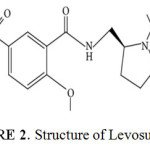 |
Figure 2: Structure of Levosulpiride Click here to View figure |
Levosulpiride2 a substituted derivative of benzamide, GI motilator and anti-psychotic drug, was reported to be a selective antagonist of central dopamine (D-2, D-3 and D-4) receptors, Levosulpiride also has shown to have mood elevating properties. Chemically the moleculeis named as N-(((2s)-1-Ethylpyrrolidin-2-yl) methyl)-2-methoxy-5-suifamoylbenzamide. Figure II. Represents structure of the molecule Levosulpiride.
Literature survey3-9 shows that there are few methods available for determination of Esomeprazole and Levosulpiride. As such for Levosulpiride and Esomeprazole there is no stability indicating method available. Hence we developed a rapid and simple method for the above mentioned compounds.
Materials and Method
Instruments
HPLC make-waters 2690 detector PDA -2996. ODS C18 column (250mm x 4.6 mm, 5m). Analytical Balance- ER-180A, Microbalance- Sartorius-M500P, pH Meter- Thermo scientific, Sonicator– Sartorius, Software- Empower V 1.2.2.1
Chemicals
HPLC grade water (Merck), Methanol (Merck), Ortho-phosphoric acid (Merck), Acetonitrile (Rankem), reference Standards (S. L. Drugs Hyderabad). Sample (Nexpro-L capsule).
Preparation of Solutions
Diluent
First the compounds were dissolved in small amount of solution of water and Acetonitrile in the ratio of 1:1 and then made up the volume with Buffer.
Buffer
(0.1% Ortho phosphoric acid): Transferred 1ml of Concentrated Ortho phosphoric acid in a 1000ml volumetric flask, added about 900ml of milli-Q water and sonicated for 15 minutes and finally made up the volume with water.
Standard Preparation
Stock solution Preparation (800 µg/ml Esomeprazole, 1500 µg/ml Levosulpiride): Transferred 8 mg of Esomeprazole, 15 mg of Levosulpiride Standards into a 10 ml clean dry volumetric flask, added 7 ml of diluent, sonicated for 30 minutes and made up to the final volume with mobile phase.
Standard solution Preparation
(64 µg/ml Esomeprazole, 120µg/ml Levosulpiride)
From the above stock solution, 0.8 ml was pipetted out in to a 10 ml volumetric flask and then made up to the final volume with mobile phase.
Sample Preparation
Stock sample solution Preparation
( 800 µg/ml Esomeprazole, 1500 µg/ml Levosulpiride)
10 tablets were weighed and calculated the average weight of each tablet, then the weight equivalent to 1 tablet (380 mg) was transferred into a 50 ml volumetric flask, 30 ml of diluent was added and sonicated for 30 min, further the volume was made up with mobile phase and filtered off.
Standard sample solution Preparation
( 64 µg/ml Esomeprazole, 120 µg/ml Levosulpiride)
From the filtered stock solution 0.8 ml was pipetted out into a 10 ml volumetric flask and made up to 10 ml with mobile phase.
Label Claim
40 mg of Esomeprazole + 75 mg of Levosulpiride
Method development
To develop a new method10 for estimation and degradation studies several trials were conducted so that we can achieve most suitable chromatographic condition. The initial attempt was to employ as much low proportion of organic solvents for elution of the compounds. More part of aqueous solvents in mobile phase resulted in prolonging of retention time of both the compounds. Reasonable retention time, number of theoretical plates, value of tailing factors and all were found within the validation limit by using optimized Chromatographic condition.
Method Validation
The developed stability-indicating HPLC analytical method was validated following ICH guidelines11
Accuracy
It was conducted by recovery studies, using spiking method. 50%, 100%, and 150% of standard of Levosulpiride and Esomeprazole were spiked to pre-quantified sample solutions and the quantity recovered was estimated.
Test for Precision
It was checked by applying same concentration of compounds repeatedly for six times calculated standard deviation and relative standard deviation.
Test for Linearity
For Esomeprazole the range was 16ppm to 96ppm and Levosulpiride 30ppm to 180ppm. Each Concentration was injected thrice and calculated correlation coefficient.
Intermediate precisions
The test for Intermediate precisions of this method was determined by experimenting the results in different days keeping a gap of 24 hours.
Test for LOD and LOQ
The limit of detection, the limit of quantification was determined by considering standard deviation of y intercept and slope of regression line and using them into the formula-
LOD = 3.3 × SD/Slope LOQ= 10 × SD/Slope
Test for Robustness
It was conducted by maling small change in the mobile phase composition (aqueous phase 10% ±), temperature (±50 C) and flow rate (± 0.2 ml per minute).
Test for Stability
Oxidation
To 1 ml of stock solution 1 ml of 20% hydrogen peroxide (H2O2) was added. The solutions were kept for 30 min at 600c. For HPLC study, the resultant solution was diluted to obtain 64µg/ml and 120µg/ml solution and 10 µl were injected into the system and the chromatograms were recorded to assess the stability of sample.
Acid Degradation Studies
To 1 ml of s tock solution 1ml of 2N Hydrochloric acid was added and refluxed for 30mins at 600c, diluted, and 10 µl was injected into the system.
Alkali Degradation Studies
To 1 ml of stock solution 1 ml of 2N sodium hydroxide was added and refluxed for 30mins at 600c. diluted, 10 µl was injected into the system.
Dry Heat Degradation Studies
The standard drug solution was placed in oven at 1050c for 6 hours to study dry heat degradation, diluted, 10µl was injected into the system.
Photo Stability studies
It was conducted by exposing the solution to UV Light by keeping the beaker in UV Chamber for 7days, solution was diluted, 10 µl was injected into the system.
Neutral Degradation Studies
It was studied by refluxing the drug in water for 6hrs at a temperature of 60º, diluted, 10 µl was injected into the system.
Results and Discussions
Method development
Optimization of chromatographic condition was achieved after several trials. Reasonable retention time for Esomeprazole was 2.4 minutes and for Levosulpiride was 3.5 minutes. Resolution, tailing factor and number of theoretical plates were acceptable enough for quantitative analysis and stability studies.
Optimized Chromatographic conditions
Mobile phase was as Buffer, Acetonitrile and Methanol at the ratio of 65:30:5, Flow rate 1 ml/minute, Column ODS 250 mm x 4.6 mm, 5 m, Detector wave length 254 nm, Column temperature 30°C, Injection volume 10 mL, run time 8 minutes, Diluent: First drug dissolved in water and Acetonitrile at the ratio of 1:1 and then made up the volume with Buffer.
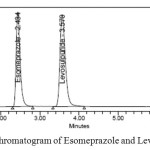 |
Figure 3: A typical Chromatogram of Esomeprazole and Levosulpiride Click here to View figure |
Validation Results
Accuracy Results
Number of replicates were three for each trial. Mean percentage recovery was found to be 100.48% and 100.0 % for Esomeprazole and Levosulpiride respectively. Table 1 contains details of accuracy observations.
TABLE 1: Accuracy Results
| % Spiked | Amount added | Amount recovered | % of recovery | Mean % |
| Esom Levos | Esom Levos | Esom Levos | Esom Levos | |
| 50% | 32 ppm 60 ppm | 32.10 ppm 60.04 | 100.31 100.00 | 100.48 100.00 |
| 100% | 64 ppm 120 ppm | 64.15 ppm 120.30 | 100.23 100.25 | |
| 150% | 96 ppm 180 ppm | 96.88 ppm 179.55 | 100.91 99.75 |
Note: number of replicates for each spiking = 3.
Precision Results
SD was found to be 6568.0 and 1325.8; percentage relative standard deviation 0.38 and 0.60 for Esomeprazole Levosulpiride respectively. Table 2 contains details of precision/System suitability results.
TABLE 2: System suitability
| Compound | Retention time (Average) |
Response area (Average) |
Plate count (Average) |
Tailing factor (Average) |
| Esomeprazole | 2.41 | 1714592 | 2888 | 1.42 |
| Levosulpiride | 3.56 | 2268541 | 3228 | 1.33 |
Note: Number of replicates =6
Linearity Result
Linearity test was conducted by applying Levosulpiride (30ppm-180ppm) and Esomeprazole (16ppm-96ppm), calculated the value of Correlation Coefficient, and was found to be 0.999 for both the compounds. Details of Linearity results are given in Table 3.
TABLE 3: Regression Analysis
| Parameters | Esomeprazole | Levosulpiride |
| Linearity (µgm/ml) | 16- 96 µgm/ml | 30- 180 µgm/ml |
| Correlation Coefficient.(r) | 0.999 | 0.999 |
| Slope of Regression (mean) | 511.7 | 446.6 |
| %RSD of Slope | 4.03 | 23.02 |
| Regression Intercept (mean) | 27831 | 19270 |
| %RSD of Intercept | 0.01 | 0.34 |
Note: number of replicates = 6.
Intermediate precision Results
The test for Intermediate precisions of this method was determined by conducting the trials in different days, significant change was not observed. Table 4 contains details of intermediate precision results.
TABLE 4: Intermediate Precision Results (Intraday and Inter day)
| Compound | Results | Standard Area | Sample Area (Intraday) |
Sample Area (Inter day) |
| Esomeprazole | Average | 1717440 | 1714592 | 1712288 |
| SD | 6568.0 | 5874.4 | 5055.0 | |
| %RSD | 0.38 | 0.34 | 0.41 | |
| %Assay | — | 99.83 | 99.70 | |
| Levosulpiride | Average | 2266038 | 2268541 | 2265528 |
| SD | 13258.6 | 9949.0 | 8852.2 | |
| %RSD | 0.60 | 0.40 | 0.44 | |
| %Assay | — | 100.11 | 99.97 |
Note: number of replicates = 6.
LOD
The limit of detection was found to be 0.04µg/ml and 0.02µg/ml for Esomeprazole and Levosulpiride respectively.
LOQ
The limits of quantification were found to be 0.12µg/ml and 0.05µg/ml for Esomeprazole and Levosulpiride respectively.
Robustness Study
The test for robustness was performed by taking the parameters like flowrate-1.0 ± 0.2 ml per minute, Mobile phase composition – aqueous phase 10% ± and temperature ±50 C. Result was found like change in retention time from 2.138 minutes to 2.439 minutes for Esomeprazole and from 3.144 minutes to 3.666 minutes for Levosulpiride, other parameters like theoretical plates, tailing factors etc. were not affected significantly. Table 5 contains details of robustness results.
TABLE 5: Results of robustness study
| Drug | Chromatographic conditions | RT (Minutes) | Mean area | USP Plate | USP Tailing |
| Esomeprazole | Flow- 0.8ml/minute | 2.408 | 1755236 | 2337 | 1.46 |
| Flow-1.2ml/minute | 2.151 | 1535572 | 2216 | 1.44 | |
| Buffer (70%) | 2.412 | 1769940 | 2380 | 1.45 | |
| Buffer (60%) | 2.433 | 1779377 | 2322 | 1.45 | |
| Temperature-250C | 2.410 | 1709257 | 2347 | 1.44 | |
| Temperature-350C | 2.409 | 1634134 | 2347 | 1.44 | |
| Levosulpiride | |||||
| Flow- 0.8ml/minute | 3.555 | 2291211 | 2411 | 1.27 | |
| Flow-1.2ml/minute | 3.169 | 2009069 | 2335 | 1.29 | |
| Buffer (70%) | 3.553 | 2322981 | 2483 | 1.25 | |
| Buffer (60%) | 3.559 | 2293413 | 2431 | 1.47 | |
| Temperature-250C | 3.543 | 2218891 | 2430 | 1.25 | |
| Temperature-350C | 3.534 | 2123457 | 2431 | 1.24 |
Note: number of replicates = 3.
Results of Stability test
Stability studies indicate that both the compounds were prone to peroxide, acid and alkali degradation. Thermal, UV or Water degradation was not significant. Figure IV to IX represent chromatogram due to force degradation and Table 6 contains details of degradation results.
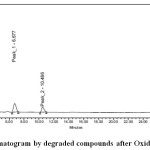 |
Figure 4: Chromatogram by degraded compounds after Oxidative stress Click here to View figure |
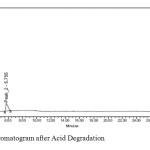 |
Figure 5: Chromatogram after Acid Degradation Click here to View figure |
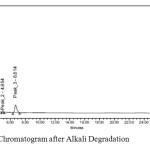 |
Figure 6: Chromatogram after Alkali Degradation Click here to View figure |
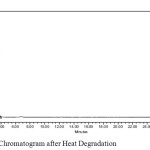 |
Figure 7: Chromatogram after Heat Degradation Click here to View figure |
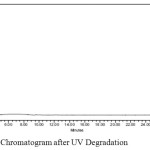 |
Figure 8: Chromatogram after UV Degradation Click here to View figure |
 |
Figure 9: Chromatogram after Neutral Degradation Click here to View figure |
Table 6: Results of degradation studies
| Stress Condition | SL | Peak | RT(Min) | Area | %Area | Purity Angle | Purity Threshold | Plate Count | Tailing |
| Oxidative | 1 | Esom | 2.407 | 1609556 | 40.85 | 2.159 | 2.272 | 2379 | 1.5 |
| 2 | Levo | 3.179 | 2121701 | 41.13 | 0.209 | 0.317 | 2994 | 1.5 | |
| 3 | Peak1 | 6.677 | 1791786 | 11.97 | 0.223 | 0.300 | 3914 | 1.4 | |
| 4 | Peak2 | 10.468 | 263669 | 6.05 | 0.459 | 0.664 | 4325 | 1.3 | |
| Acidic | 1 | Esom | 2.551 | 1659778 | 65.99 | 1.162 | 2.397 | 2399 | 1.8 |
| 2 | Levo | 3.234 | 393664 | 11.65 | 0.515 | 0.786 | 5234 | 1.4 | |
| 3 | Peak1 | 3.555 | 2064263 | 9.89 | 0.371 | 0.408 | 4280 | 1.7 | |
| 4 | Peak2 | 5.755 | 421009 | 12.46 | 1.170 | 0.507 | 1078 | 2.0 | |
| Alkali | 1 | Esom | 2.595 | 1626253 | 57.52 | 1.200 | 2.087 | 3043 | 1.6 |
| 2 | Peak1 | 3.241 | 88125 | 2.65 | 0.276 | 1.459 | 6015 | 1.4 | |
| 3 | Levo | 3.583 | 2141047 | 21.12 | 0.616 | 0.713 | 3601 | 1.4 | |
| 4 | Peak2 | 4.954 | 38620 | 1.16 | 2.012 | 2.412 | 3975 | 1.1 | |
| 5 | Peak3 | 6.614 | 615481 | 18.54 | 0.545 | 0.727 | 2273 | 1.7 | |
| Elevated Temp | 1 | Esom | 2.399 | 1591177 | 44.00 | 1.339 | 1.702 | 2387 | 1.5 |
| 2 | Levo | 3.545 | 2187109 | 56.00 | 0.231 | 0.310 | 2548 | 1.2 | |
| UV Light | 1 | Esom | 2.402 | 1667213 | 44.56 | 1.472 | 1.685 | 2383 | 1.5 |
| 2 | Levo | 3.550 | 2204921 | 55.44 | 0.258 | 0.410 | 2651 | 1.2 | |
| Neutral | 1 | Esom | 2.410 | 1709709 | 44.07 | 1.387 | 1.682 | 2375 | 1.5 |
| 2 | Levo | 3.540 | 2226986 | 55.93 | 0.181 | 0.303 | 2503 | 1.2 |
Conclusion
In this research work the method developed for assay and stability studies was found to be rapid, simple, accurate, precise and robust for regular analysis of the drugs simultaneously. The present method has certainly beneficial edges analytically as compared to available methods which makes the method quiet advantageous and unique.
References
- The Indian Pharmacopoeia, 2014 Volume-II, Government of India, Delhi, p-1689.
- Lozano, R.; Peralta Concha, M.G.; Montealegre, A.; Leon, d. E. L.; Villalba, Ortiz, J.; Esteban Lee, H.O.; Cromeyer, M.; Garcia Rivas, J.A.; Brossa, A.; Lluberes, G.; Izquierdo Sandi, E.; Quros Burgos, H.; Ther Clin Risk Manag, 2007, 3, 149-155.
CrossRef - Suryadevara, V.; Yarraguntla, S.R.; Anne, R.; Reddyvalam, L.S.; Anne, J.R. Orient J Chem, 2013, 29, 1213-1220.
- Nandakishore A.; Jagdeesh, B. Int J Pharma Bio Sci, 2012, 3, 718-726.
- Patel, Z. N.; Patel, P. B.; Modi, J. D.; Parikh, N. N.; Chaudhari, H. M.; Pradhan, P. K.; Upadhyay, U. M. Pharma Sci Monitor, 2014 5, 125-132.
- Pravind, D. P.; Satish, Y. G.; Sachine, P., Kakasaheb, R.M. Int J Pharm Pharmaceut Sci, 2014 6, 347-350.
- Rachana, P.; Jagdish, K.; Pinak, Patel; Nehal, S. Asian J Pharma Tech Innov, 2014, 2, 01-12.
- Kayesh, R.; Sultan, M.Z. J Chromatogr Sci. 2015, 53, 687-693.
CrossRef - Rachana, P.; Jagdish, K.; Pinak, Patel; Nehal, S. Int J Pharma Res Bio-Sci, 2014, 3, 785-798.
- Snyder, L.R.; Kirkland, J.J.; Glajch, J.L. Practical HPLC Method Development, 2nd ed., Wiley, New York 1997.
CrossRef - International Conference on Harmonization of Technical Requirements for Registration of Pharmaceuticals for Human Use. ICH harmonised tripartite guideline: validation of analytical procedures: text and methodology Q2(R1). ICH. 1-13, 2005.

This work is licensed under a Creative Commons Attribution 4.0 International License.
![]()
A New Edition of Web of Science
Journal Impact Factor
2022: 0.5
Five Year: 0.8
Journal is Indexed in

Cabells Whitelist
![]()


