Preparation of Modified Magnetic Nano-Fe3O4 Chitosan/ Graphene Oxide for the Preconcentration and Determination of Copper (П) Ions in Biological and Environmental Water Samples Prior to Flame Atomic Absorption Spectrometry.
Mohammd Yari1, Ali Moghimi2*and Shabnam fakhari3
1Department of Chemistry, Eslamshahr branch, Islamic Azad University, Eslamshahr, Iran.
2Department of Chemistry, Varamin(Pishva) Branch . Islamic Azad University ,Varamin,Iran.
3Department of Science, Shahr-e-Qods Branch, Islamic Azad University, Tehran, ,Iran.
Corresponding Author E- mail: alimoghimi@iauvaramin.ac.ir
DOI : http://dx.doi.org/10.13005/ojc/320343
Article Received on : April 05, 2016
Article Accepted on : May 25, 2016
A simple, highly sensitive, accurate and selective method for determination of trace amounts of Cu2+in water samples .In this paper, chitosan grafted with graphene oxide sheets showed an increased surface area was used to encapsulate nano-Fe3O4 and produce a nano-Fe3O4-encapsulated-chitosan/graphene oxide sorbent based new sorbent was prepared. Flame atomic absorption spectrometer was utilized for determination of Cu2+.Some of the important parameters on the preconcentration and complex formation were selected and optimized. Under the optimized conditions the limit of detection (LOD) and limit of quantification (LOQ)were 0.30,0.750 and the proposed method has a good reproducibility 0.90% (RSD %).The enrichment factor was 200 and the percentage of recovery was in the range of 95-100% .The method was successfully applied to the recovery of Cu2+in different type of water samples. Graphene oxide and its derivates such as magnetic nano-Fe3O4-encapsulated-chitosan/graphene oxide in this study is full of potential to use as an excellent adsorbent in the extraction method like solid phase extraction(SPE) and solid phase micro extraction(SPME). In the present study, we report the application of pre concentration techniques still continues increasingly for trace metal determinations by flame atomic absorption spectrometry (FAAS) for quantification of Cu2+ in Formalin-fixed paraffin-embedded (FFPE) tissues from Liver loggerhead turtles. This method exhibits the superiority in compared to the other adsorption reagents because of the fact that there is no necessity of any complexing reagent and optimum pH of solution presents in acidic media.
KEYWORDS:nano-Fe3O4-encapsulated-chitosan/graphene oxide; preconcentration; SPE; Preconcentration ; FAAS; copper; Formalin-fixed paraffin-embedded (FFPE) ; tissues from Liver loggerhead turtles
Download this article as:| Copy the following to cite this article: Yari M, Moghimi A, fakhari S. Preparation of Modified Magnetic Nano-Fe3O4 Chitosan/ Graphene Oxide for the Preconcentration and Determination of Copper (П) Ions in Biological and Environmental Water Samples Prior to Flame Atomic Absorption Spectrometry. Orient J Chem 2016;32(3). |
| Copy the following to cite this URL: Yari M, Moghimi A, fakhari S. Preparation of Modified Magnetic Nano-Fe3O4 Chitosan/ Graphene Oxide for the Preconcentration and Determination of Copper (П) Ions in Biological and Environmental Water Samples Prior to Flame Atomic Absorption Spectrometry. Orient J Chem 2016;32(3). Available from: http://www.orientjchem.org/?p=17191 |
Introduction
The properties of nano magnetic particles have attracted many studies on their functionality as magnetic carrier. This characteristic make these elements a fit candidate in a wide range of heavy metal ions application in biology and water samples 1-2,also in medical imaging uses such as magnetic resonance imaging(MRI) 3,4, in isolating substances and materials in anions– cations pre-concentration5.
Copper at trace concentrations acts as both a micronutrient and a toxicant in marine and fresh water systems6.This element is needed by plants at only very low levels and is toxic at higher levels. At these levels, copper can bind to the cell membrane and hinder the transport process through the cell wall. Copper at nearly 40ng mL-1 is required for normal metabolism of many living organisms7-10. On the other hand, copper is an important element in many industries. Thus, the development of new methods for selective separation, concentration and determination of it in sub-micro levels in different industrial, medicinal and environmental samples is of continuing interest. The determination of copper is usually carried out by flame and graphite furnace atomic absorption spectrometry (AAS) 11, 12 as well as spectrometric methods 13, 14 .However, due to the presence of copper in medicinal and environmental samples at low levels, its separation from other elements presents and also the use of a preconcentration step prior to its determination is usually necessary.
Different methods, especially Liquid- Liquid extraction of copper in the presence of various classical 15-19 and macrocylic 20, 21 co-extractant ligands has attracted considerable attention. However, the use of classical extraction methods for this purpose is usually time-consuming, labor-intensive and requires large amounts of high purity solvents for extraction. Nevertheless, several other techniques for the preconcentration and separation of copper have been proposed including liquid chromatography22 supercritical fluid extraction23, flotation24, aggregate film formation25, liquid membrane26, column adsorption of pyrocatechol violet-copper complexes on activated carbon27, ion pairing 28, ion pairing29, preconcentration with yeast30, and solid phase extraction using C18 cartridges and disks31.
Solid phase extraction (SPE) or liquid-solid extraction is poplar and growing techniques that are used to sample preparation for analysis. It is an attractive alternative for classical liquid-liquid extraction methods that reduce solvent usage and exposure, disposal costs and extraction time for sample separation and concentration purposed32.
Chitosan has been reported to be a suitable biopolymer for the removal of heavy metals from industrial wastewater, due to its high amino and hydroxyl functional group content, low toxicity, biocompatibility, and biodegradability33. However, to improve its absorption capacity and enhance the separation rate, the design and synthesis of novel adsorbents are still critical34. The application of magnetic adsorbent technology to solve environmental problems is a relatively new and emerging field of research. Coating chitosan with magnetic fluids is a new method to improve separation speed, and the method has been reported that it can improve the surface area for adsorption and reduce the required dosage for the adsorption of heavy metals.
Actually, the SPE technique using graphene and derivates of graphene such as functionalization graphene oxide as a novel and great adsorbent [39].Chemical modification of graphene oxide has been a promising way to achieve mass production of chemically modified graphene (CMG) platelets. Graphene oxide contains a range of reactive oxygen functional groups, which renders it a good candidate to use in the above-mentioned applications. In the present work, nano-Fe3O4-encapsulated-chitosan/graphene oxide[40] was employed for production of solid phase. The synthesized and characterized new sorbent nano-Fe3O4-encapsulated-chitosan/graphene oxide was utilized for preconcentration of Copper (II) from water samples. Determination of Copper (II) concentration was achieved by FAAS after preconcentration procedure.
Experimental
Apparatus
The concentration of the metal ion solutions was determined by using the Varian model spectra AA-240 (Mulgrara, Victoria, Australia). The pH-measurements of the metal ion and buffer solutions were carried out by an Orion 420. The size and morphology of graphene oxide was observed by scanning electron microscopy (SEM model LEO 440i), before taken image with SEM the surface of sample was coated with gold. X-ray diffraction (XRD) measurements were carried out with Cu Kα radiation (40 kV, 60 mA, 2Ө from 5 -115). Fourier transform-infrared (FT-IR)spectra were taken in KBr pressed pellets on a FT-IR Thermo Nicolet (USA).
Materials and Reagents
All the necessary materials and reagents were of analytical grade and werepurchased Merck, Aldrich and Sigma Company. All the dilutions were prepared by ultrapure deionized water.Chitosan was purchased from Merck. FeCl2·4H2O and FeCl3·6H2O were purchased from Merck. The reagents 1-ethyl-3-(3-dimethylaminoprophy) carbondiimide hydrochloride (EDC), N-hydroxyl succinimide (NHS), acetic acid, glutaradehyde and sodium hydroxide were Merck. All other reagents used in this study were analytical grade, double distilled water was used in the preparation of all solutions. GO was purchased from Damao Chemical Agent Company (Tianjin, China). Other metal stock solutions (1000 mg l−1) were prepared by dissolving appropriate amounts of nitrate in 1.0% (v/v) HNO3 and further diluted daily prior to use. The pH was adjusted with the following buffer solutions: H2C2O4/NaHC2O4 for pH 2.0 and 3.0; NaCH3COO/ CH3COOH for pH 4.0–6.0. Na2HPO4/NaH2PO4 for pH 7.0; Na2B4O7/NaOH for pH 8.0–11; NaOH for pH 12–14.
Synthesis of magnetic nano-Fe3O4 sorbent
The magnetic nano-iron oxide was first synthesized according to a previously reported method [2]. A 6.1 g sample of FeCl3-6H2O and 4.2 g FeSO4-7H2O were dissolved in 100 mL of distilled water. A total of 25.0 mL of 6.5 M-NaOH was slowly added to the above solution. The reaction mixture was stirred for 4 h using a magnetic stirrer. After the complete addition of NaOH, the formed black precipitate, nano-Fe3O4, was then washed several times with distilled water, collected in a pure form by the assistance of an external magnetic field and dried in an oven at 70 °C.
Preparation of nano-Fe3O4-encapsulated-chitosan/graphene oxide sorbent
graphene oxide (0.1 g) dispersion was prepared by sonicating graphene oxide for 3 h in ultrapure water. A solution of 1-ethyl-3-(3-dimethylaminoprophy) carbondiimide hydrochloride (0.05 M) and N-hydroxyl succinimide (0.05 M) was added to the graphene oxide dispersion with continuous stirring for 2 h in order to activate the carboxyl groups of graphene oxide [35]. The pH of the resulting solution was maintained at 7.0 using dilute sodium hydroxide. Magnetic chitosan (0.1 g) and the activated graphene oxide solution were added in a flask and dispersed in distilled water by ultrasonic dispersion for 10 min. After ultrasonic dispersion, the mixed solutions were stirred at 60 ◦C for 2 h. The precipitate was washed with 2% (w/v) NaOH and distilled water in turn until pH was about 7. Then, the obtained product was collected by the aid of an adscititious magnet and dried in a vacuum oven at 50 ◦C. The obtained product was nano-Fe3O4-encapsulated-chitosan/graphene oxide40.
Preparation of Solid Phase
Sorption characteristics of Cu(II) ions by magnetic nano-sorbents by the batch equilibrium technique. The applicability of magnetic nano-Fe3O4-encapsulated-chitosan/graphene oxide sorbent for extraction of Cu(II) ions was studied by the batch equilibrium technique under several experimental controlling factors. These include the effect of pH, contact time, sorbent dosage, initial metal ion concentration and interfering ions.
General procedure
100 ml solution with 50 ngml-1 Cu content was prepared as a sample. This solution was added to the magnetic nano-Fe3O4-encapsulated-chitosan/graphene oxide sorbent and by using buffer solution ,its pH was modified to 3.0, followed the container was shaken for 25min in order to allow easier Cu ions absorption of the nano-Fe3O4-encapsulated-chitosan/graphene oxide sorbent [36]. At the end of this stage ,the nano-Fe3O4-encapsulated-chitosan/graphene oxide sorbent which had been formed on the bottom layer of the beaker was removed through applying an external field with1.4T magnetic powers and was immediately decanted outside the supernatant. 1 ml of 1molL-1 ion of eluent was injected into FAAS for measurement of Cu(II) ions concentrations.
Analysis of sample paraffin-embedded tissues from liver loggerhead turtles
Specimens
Selected areas from fresh frozen tissues from liver loggerhead turtles specimens were sliced in three pieces (numbered as 1, 2 and 3) of approximately 10 mm × 5 mm × 2 mm each. Sets of pieces of set 1 (controls), were placed into a vacuum chamber at 50 ºC overnight to dry (until a constant weight was obtained) and the sets 2 and 3 were subjected to the standard 10 % buffered formalin fixation and paraffin embedding31 histological process using a tissue processor (Tissue-Tek VIP, Sakura Finetek USA Inc., Torrance, CA). After the paraffin embedding process, tissues were subsequently excised from the blocks with a titanium knife and deparaffinized in xylene at 55 ºC for 1 h in the tissue processor (the set 2), or with hexane at 20 ºC for 1 week with frequent changes of the solvent in handling-based procedure (the set 3). Xylene was of a grade routinely used for the FFPE process and hexane was of ”Optima” grade (Fisher Scientific). Upon deparaffinization, the tissue samples were dried in a vacuum chamber until constant weight was obtained. Each dried sample (of the sets 1-3) was divided into three portions (5-10 mg each) to be further analyzed as triplicates.
Results and Discussion
Fig.1. a and b show the morphology and size of magnetic nano-Fe3O4-encapsulated-chitosan/graphene oxide sorbent as shown in Fig. 1a and b. The particles of nano-Fe3O4-encapsulated-chitosan/graphene oxide 339 sorbent retained a homogenous distribution in the
range of 340 5.0–20.0 nm.
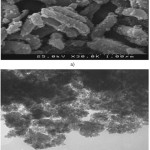 |
Figure1: Images of (a) Scanning Electron Microscopy (SEM) and (b) Transmission Electron Microscopy (TEM) of magnetic nano-Fe3O4-encapsulated-chitosan/graphene oxide. Distance Click here to View figure |
The XRD pattern of the magnetic nano-Fe3O4-encapsulated-chitosan/graphene oxide synthesized in aqueous solution is shown in Fig. 2. The position and intensities of the observed diffraction peaks were compared with the diffraction pattern of standard particles 26. The presence of sharp peaks (25.87°, 30.10°and 43.01°) indicates the highly crystalline nature of the magnetic nano-Fe3O4-encapsulated-chitosan/graphene oxide synthesized system. The estimated crystallite size (using the Debye-Scherrer formula) of the sample prepared in aqueous media, from line broadening of the most intense diffraction peak, was approximately 47 nm.
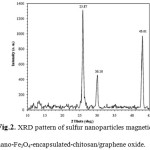 |
Figure 2: XRD pattern of sulfur nanoparticles magnetic nano-Fe3O4-encapsulated-chitosan/graphene oxide. Click here to View figure |
Optimization of SPE procedures
Effect of pH
The metal chelate stability constant and its chemical stability considerably influence the SPE recovery. The pH plays a very important role on metalchelate formation and following extraction. Therefore, pH was the first optimized parameter. pH of the analyte solutions was adjusted to desired values with diluted hydrochloric acid (0.1 mol L−1) and/or ammonia solution (0.1 mol L−1) The variation in recovery of Cu(II) with pH is shown in Fig.3 . According to the results shown in Fig 3 up to pH 4.5-6.0, complete recoveries are obtained. However, at higher pH values, percentage recovery decreases. This is due to fact that in an acidic solution the protonation of magnetic nano-Fe3O4-encapsulated-chitosan/graphene oxide occurs and there is a weak tendency for retention between Cu (II) and magnetic nano-Fe3O4-encapsulated-chitosan/graphene oxide, whereas at higher values (pH>6), Cu (II) reacts with hydroxide ions to produce Cu (OH)2. Accordingly, pH 5.0 was selected for subsequent work and real sample analysis.
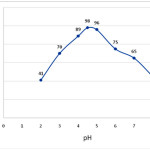 |
Figure 3: Influence of sample pH on the percentage recovery of Cu (II), conditions: 100 mg adsorbent, 50 ml of 5 mg/L of copper ions. Click here to View figure |
Effect of flow rates of sample and eluent solution
The effects of flow rates of sample solution and eluent solution on the recovery of Cu (II) was also examined between under the optimum conditions in the range of 1–10.0 mL min−1 by controlling the flow rate with peristaltic pump. The recovery of the ions were independent of flow rate in the range of 0.5–2.0 mL min−1 for eluent solution and range of 1–5.0 mL min−1 for sample solution.
Effect of sample solution volume
Another parameter studied to find the best experimental conditions is the volume of sample solution and/or analyte concentration. For this purpose, 50.0–1100.0 mL of sample solutions containing 5ppm Cu (II) were processed according to the suggested procedure. The recovery of Cu(II) was quantitative (>96%) obtained up to a sample volume of 1000.0 mL and the adsorbed Cu(II) can be eluted with 5 mL eluent. Therefore, an enrichment factor of 200 was achieved by this technique. Finally In our suggested procedure, a sample volume of 50.0 mL was chosen for preconcentration method.
Effect of amount of sorbent
To achieve a high extraction recovery, different amounts of magnetic nano-Fe3O4-encapsulated-chitosan/graphene oxide ranging from 50 to 300 mg were applied to extract the target compounds from the sample solutions. The results are shown in Fig 4 from which it can be seen that the extraction recovery achieved by 100 mg, but almost the same as obtained with 300 mg or more than of the adsorbent. Based on the above results, 100 mg of magnetic nano-Fe3O4-encapsulated-chitosan/graphene oxide was selected for the following experiments.
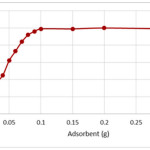 |
Figure 4: Removal percentages of copper ions at different amounts of magnetic nano-Fe3O4-encapsulated-chitosan/graphene oxide , conditions: 50 ml of 5 mg/L of copper ions, pH= 5.0. Click here to View figure |
Eluent type and its volume
Another important factors which affect the percent of recovery are the type, volume, and concentration of the eluent solution used for the removal of metal ions from the sorbent. For this purpose, various type of eluents were examined according to the suggested procedure. The results for this study are listed in Table 1. 4.0 mol L−1 HNO3 was found to be adequate for quantitative elution (≥95%).The effect of eluent volume on the recovery of Cu (II) was also studied and listed in table.2. the results show the best quantitative recovery is 5.0 mL of 4.0 mol L−1HNO3 . As a result 5.0 mL of 4.0 mol L−1 HNO3 was selected in the subsequent preconcentration method.
Table 1: Effect of type and concentration of various eluent on the recovery of Cu (II).
| %Recovery | ||||
| Eluent concentration (M) | 1 | 2 | 3 | 4 |
| NaOH | 8 | 11 | 15 | 15 |
| NH3 | 10 | 12 | 14 | 13 |
| HCl | 11 | 16 | 17 | 18 |
| H2SO4 | 17 | 19 | 22 | 22 |
| HClO4 | 25 | 30 | 34 | 35 |
| HNO3 | 58 | 79.8 | 96 | 100 |
Table 2: Effect of eluent volume on the recovery of Cu (II) .
| Volume of eluent | %Recovery |
| HNO3 (4M) 2 ml | 47.3 |
| HNO3 (4M) 4 ml | 79 |
| HNO3 (4M) 5 ml | 98 |
| HNO3 (4M) 8 ml | 85 |
| HNO3 (4M)10ml | 84 |
Reusability of Column
The stability and potential regeneration of the column were studied. After every time extraction, the column was washed with 10 mL of MeOH and 10mL of deionized water. Thus, the column was available for a next extraction immediately at least 50 adsorption elution cycles without significant decrease in the recovery of Cu (II) ions.
Effect of foreign ions
The influence of common foreign ions on the adsorption of Cu (II) on magnetic nano-Fe3O4-encapsulated-chitosan/graphene oxide were studied. In these work, 50.0 ml solutions containing 5ppm of Cu and various amounts of interfering ions were treated according to the suggested procedure. procedure. The tolerance level was defined as the maximum concentration of the foreign ion causing a change in the analytical signal no higher than 5%, when compared with the signal of 5ppm copper alone. The results, listed in Table 3, demonstration that the presence of major cations and anions in natural water has no important influence on the adsorption of Cu (II) ions under the designated conditions.
| Table 3: Effect of foreign ions on the percent recovery of 5 ppm Cu in water samples. | |||
| Diverse ion | Amounts taken(mg) | % Found | %Recoveryof Cu (II)ion |
| Na+ | 92.4 | 1.15(2.4)b | 98.5(2.7) |
| K+ | 92.5 | 1.36(2.3) | 98.0(2.2) |
| Mg2+ | 24.5 | 0.70(2.6) | 98.5(1.7) |
| Ca2+ | 26.3 | 2.65(3.0) | 98.5(1.8) |
| Sr2+ | 2.45 | 2.85(2.1) | 98.4(2.0) |
| Ba2+ | 3.66 | 3.16(2.1) | 98.7(2.3) |
| Mn2+ | 2.66 | 1.75(2.2) | 96.3(2.3) |
| Co2+ | 2.17 | 6.44(2.3) | 93.0(1.9) |
| Ni2+ | 1.64 | 2.43(2.4) | 93.7(2.4) |
| Zn2+ | 2.76 | 4.97(2.1) | 97.6(2.4) |
| Cd2+ | 2.77 | 2.96(2.4) | 97.2(2.7) |
| Hg2+ | 1.67 | 2.71(2.1) | 97.7(2.7) |
| Ag+ | 2.6i | 3.47(2.9) | 97.6(2.3) |
| UO2+ | 2.76 | 2.74(2.1) | 98.3(2.7) |
| a) Values in parentheses are RSD based on three replicate analyses. | |||
Analytical figures of merits
Under optimized conditions, a calibration curve for Cu (II) was found by preconcentrating a series of Cu (II) standards according to the procedure mentioned. The curve was linear from 1.0 mg/l to 7.0 mg/l for Cu. As analytical figures of merit, limit of detection (LOD), limit of quantification (LOQ) defined as 3SB/m and 10SB/m, relative standard deviation (RSD) for the proposed preconcentration and speciation method have been determined and listed in table 4.
Table 4: Analytical figures of merits for Cu (II)
| Parameters | |
| RSD% n=10 | 0.88% |
| LOD(μm/L) | 0.25 |
| LOQ(μm/L) | 0.883 |
| Enrichment factor | 200 |
| flow rates of sample (mL/min) | 5 |
| calibration equation | Y = 0.06x – 0.0002 |
| correlation coefficient | 0.999 |
Determination of copper in real water samples
Three type of water samples (information described in section 2.7sampling) were used for the determination of copper. The analytical results, are given in Table 5. The percent of recoveries for the addition of different concentrations of Cu (II) to water samples and sample paraffin-embedded tissues from liver loggerhead turtles were 98 and 100.5%.These satisfactory percent of recoveries indicate no significant effects from the matrix composition of the real water samples. As is seen, the recovered Cu (II)ion reveals that the results are quite reliable and are in satisfactory agreement with those obtained by ICPAES.
The proposed method was used for the determination of Cu (II) in several water samples. The results, along with the recovery for the spiked samples, are given in Table 5. The recoveries for the addition of different concentrations of Cu (II) to water samples were in the range of 95.8–98.6%. To verify the accuracy of the proposed procedure, the method was used to determine of the content of Cu (II) in the National Standard Reference Material for Environment Water (GSBZ 50030-94) after the appropriate dilution. The results for this test are presented in Table 5. A good agreement between the determined values and the certified values was obtained.
Table 5: Recovery of Cu (II) added to 100mL of different water samples (contaning 0.1M buffer acetic acid / acetate at pH= 5.0).
|
Sample |
Cu (II) spiked |
Cu (II) detected |
Recovery (%) |
ICP-AES |
|
|
(ng ml−1) |
(ng ml−1) |
|
|
|
Sample 1a |
5.0 |
4.6 (2.0)b |
97.7 |
4.4 (2.9) |
|
10.0 |
9.8 (2.5) |
98.4 |
9.5 (2.8) |
|
|
Sample 2c |
5.0 |
4.7 (3.0) |
96.3 |
4.6 (1.7) |
|
10.0 |
9.6 (3.0) |
97.2 |
9.7 (2.0) |
|
|
Tap waterd |
0.0 |
2.5(2.4) |
95.5 |
2.6(2.6) |
|
5.0 |
4.5 (2.9) |
97.5 |
4.7 (2.7) |
|
|
10.0 |
15.3 (2.4) |
95.3 |
15.8 (2.6) |
|
|
Rain waterf |
0.0 |
N.D. |
— |
N.D. |
|
5.0 |
4.9 (2.3) |
96.4 |
5.2 (2.2) |
|
|
10.0 |
10.1 (2.6) |
96.6 |
10.3 (2.4) |
|
|
Sea waterg |
0.0 |
14.0(2.0) |
97.3 |
14.4(2.3) |
|
5.0 |
18.9 (2.3) |
95 .9 |
18.2 (2.2) |
|
|
10.0 |
24.0 (3.0) |
97.9 |
24.5 (2.0) |
|
|
GSBZ 50,030-94 (µg L-1) |
0 |
13.65 |
97.2 |
14.1 |
Real samples marked 1 to 5, were collected at the at the distances of 5, 100, 250, 350 and 500 metres of the total waste water of electroplating plants in the eastern parts of Varamin, respectively. The total results obtained by the recommended procedure and ICP-AES have compared in Table 6. As it is seen, the results obtained by the proposed method and ICP-AES are in agreement with each other.
The results were shown in Table 6, together with results of a recovery test by added known amounts of copper in water sample. A standard method with ICP-MS has also been used as reference method.
Table 6: Comparison of the total results of the proposed method with ICP-AES a.
| Sample | Cu2+ (mg.mL-1)SPE-FAAS | Cu2+ (mg.mL-1)ICP-AES | F-test c | T-test d |
| 1 | 16.5±0.5b | 16.6±0.7 | 3.1 | 0.5 |
| 2 | 14.6±0.3 | 14.7±0.5 | 1.8 | 0.8 |
| 3 | 7.9±0.8 | 8.1±0.7 | 2.7 | 0.9 |
| 4 | 3.6±1.3 | 3.5±1.1 | 2.0 | 0.6 |
| 5 | 1.8±0.9 | 1.7±0.9 | 2.1 | 0.7 |
a.All real samples were diluted 50 times before analysis.
b Mean ± standard deviations based on five individual replicate analyses.
c Tabulated F-value for (4,4) degrees of freedom at p (0.95) is 6.39.
d Tabulated T-value for 8 degrees of freedom at p (0.95) is 2.306.
Table 7: Comparison of published results of several on-line or several methods for determination of Cu2+
|
Ref |
LOD (μg /L) |
Enhancement factors |
Duration of SPE |
RSD(%) |
Sorbent |
Technique
|
|
44 |
4.6 |
25 |
15 |
1.9% |
Dimethylglyoxim/sodium dodecyl sulfate -immobilized on alumina-coated magnetite nanoparticles (DMG/SDS-ACMNPs)
|
SPE & FAAS |
|
45 |
0.27 |
30 |
25 |
4.0% |
2-{4-[2-(1H-Indol-3-yl)ethyl]-3-(4-chlorobenzyl)-5-oxo-4,5-dihydro-1H-1,2,4-triazol-1-yl}-N′-(pyrrol-2-ylmethyliden)acetohydrazide (ICOTPA)
|
SPE & FAAS |
|
46 |
7.0 |
18 |
10 |
3.5 |
N- propylsalicylaldimine based on porous silica
|
SPE & FAAS |
|
47 |
0.3 |
100 |
30 |
2.23 |
Amino-Functionalization of Multiwall Carbon |
SPE & FAAS |
|
Present method |
0.25 |
50 |
20 |
0.88% |
magnetic nano-Fe3O4-encapsulated-chitosan/graphene oxide |
SPE & FAAS |
Conclusion
The proposed SPE method possesses advantages such as easiness, and considerable selectivity in comparison with the previously reported procedures for isolation and determination of Cu2+ contents (Table 7). In conclusion, the proposed SPE possesses the following advantages: the technique is rapid when compared with the previously reported procedures for the separation and determination of copper, the time taken for the separation and determination of copper in a 500 mL sample is at the most 30 min. Furthermore, it is a simple, highly sensitive, selective and reproducible method for the separation of Cu2+ and in this work the recovery yields obtained with magnetic nano-Fe3O4-encapsulated-chitosan/graphene oxide were about 95-100% then it show graphene oxide and its derivation e.g. in this work magnetic nano-Fe3O4-encapsulated-chitosan/graphene oxide is full of potential for use as a adsorbent in the extraction method like SPE and SPME .consequently it can be applied to the preconcentration and determination of copper and the large number of heavy metal that are dangers for human from real samples.
Acknowledgements
The authour wish to thank the Chemistery Department of Varamin branch Islamic Azad University for financial support.
References
- Deng, Y.; Wang, C .; Shen, X.; Yang, W.; Chem.Eur.J. 2005, 11, 6006–6013.
CrossRef - Modo, M.; Hoehn, M.; M.Bulte, J.W.; Mol.Imaging .2005,4, 143–164
- Bulte., J.W.M.;MethodsMol. Med. 2006, 124, 419–439
- Meyer, J. C. ; Geim, A. K. ; Katsnelson, M. I. ; Novoselov, K. S. ; Booth, T. J.; Roth, S., Nature 2007, 446, 60-68.
CrossRef - Afkhami, A. ; Moosavi , R.;J .Hazard. Mater. 2010, 174, 398–403.
CrossRef - Moghimi, A.; Journal of Chemical Health Risks, 2014 ,4(2), 15–22.
- Moghimi , A.; Russian Journal of Physical Chemistry A, 2013,87(11), 1851–1858.
- Moghimi, A.; Oriental Journal of Chemistry ,2006,22(3),527.
- Nayebi, P.; Moghimi. A.;Oriental Journal of Chemistry, 2006,22(3),507.
- Moghimi, A.; Chinese Journal of Chemistry 2007,25 , 640.
CrossRef - Moghimi, A.; Chinese Journal of Chemistry 2007,25 ,10, 1536.
- Moghimi , A. ; Russian Journal of Physical Chemistry A, 2013,87(7) , 1203–1209.
- F.J.Welcher, E.Boschmann, Organic Reagents for Copper, Krieger Huntington, New York,1979.
- Z.Marczenko, Separation and Spectrophotometric Determination of Elements,Ellis Horwood,1986 London.
- Schniepp, H.C.; Li, J.-L.; McAllister, M. J.;Sai, H.; Herrera-Alonso, M.; Adamson, D. H. ; Prud’homme, R. K. ; Car, R. ; Saville, D. A. ; Aksay, I. A. ,J. Phys. Chem. B ,2006, 110, 8535-8542.
CrossRef - Schilt, A.A.; Hoyle, W.C. ,Anal. Chem. 1964,41,344-349.
CrossRef - Borchart, L.G.; Butler, J.P. ; Anal. Chem. 1957,29,414-419.
CrossRef - De La Cruz, F. A.; Cowley, J. M. , Nature 1962, 196, 468-473.
CrossRef - Shuai Wang, B. ; Jon Chia, P.; Chua, L.; Hong Zhao, L.; Qi Png, R.; Sivaramakrishnan, S.; Wee, S. ; Ho, H. ; Adv. Mater. 2008, 20, 3440–3446
CrossRef - Karousis, N.; Sandanayaka,A.S.D.; Hasobe,T.;Economopoulos,S.P.;Sarantopouloua,E.; Tagmatarchis, N.,J. Mater. Chem., 2011, 21, 109-115.
CrossRef - Smith MB, March J. March’s advanced organic chemistry: reactions,mechanisms, and structure. New York: John Wiley & Sons Inc.; 2001, 1182–3.
- Mermoux M, Chabre Y, Rousseau A. FTIR and carbon-13 NMR study of graphite oxide. Carbon 1991,29(3),469–74.
CrossRef - Cataldo F. Structural analogies and differences between graphite oxide and C60 and C70 polymeric oxides (fullerene ozopolymers). Fuller Nanotub Car N 2003,11(1),1–13
CrossRef - Anthemidis, A.N.; Zachariadis, G.A. ; Stratis, J.A., Talanta,2001, 54,935-943.
CrossRef - Zenedelovska, D.; Pavlovska, G.; Cundeva, K. ; Stafilov, T., Talanta 2001 ,54,139-145.
CrossRef - Endo, M.; Suziki, K.; Abe, S., Anal. Chim. Acta ,1998,364,13-20.
CrossRef - Campderros, M.E.; Acosta, A. , J. Marchese, Talanta 1998,47,19-26.
CrossRef - Narin, I.; Soylak, M. ; Elic, L.; Dogan, M., Talanta , 2000,52,1041-1049.
CrossRef - Akama, Y.; Ito, M.; Tanaka, Y. S., Talanta ,2000,52,645-653.
CrossRef - Ohta, K.; Tanahasi, H.; Suzuki, T. ; Kaneco, S., Talanta ,2001,53,715-722.
CrossRef - Cuculic, V.; Mlakar, M.; Branica, M. Anal. Chim. Acta ,1997,339, 181.
CrossRef - Moghimi, A.;Yousefi Siahkalrodi, S., Journal of Chemical Health Risks ,2013,3(3), 01-12.
- Hamed, M.A.;Egyptian Journal of Aquatic Research,2005,31(1), 31-41.
- Moghimi A., Afr J Pure Appl Chem. 2013, 7(2),79-90.
- Thurman, E.M.; Mills, M.S. ,Solid-Phase Extraction, Principles and Practice, 1998, Wiley, New York.
- Pawliszyn, J.; Solid-Phase Microextraction, Theory and Practice, 1997, Wiley-VCH, New York.
- Tuzen, M. ; Soylak, M. ; Citak, D. ; Ferreira, H.S. ; Korn M.G.A. ; Bezerra, M.A.,
CrossRef - J. Hazard. Mater., 2009,162, 1041-1048.
- Hagen, D.F.; Markell, C.G.; Schmitt, G.A. ; Anal.Chim. Acta 1990,236,157-165.
CrossRef - Krueger, C.J.; Fild, J.A. , Anal.Chem., 1995, 67,3363-3369.
CrossRef - Taylor, K.Z.; Waddell, D.S.; Reiner, E.J.; Anal. Chem. 1995, 67,1186-1192.
CrossRef - Yamini, Y.; Ashraf-Khorassani, M.; J.High Resolut. Chromatogr. 1994,17,634-639.
CrossRef - Huang, X.; Chang, X. ; He, Q. ; Cui, Y.; Zhai Y. ; Jiang, N.,J. Hazard. Mater. 2008,157,154 -159.
CrossRef - Pourreza, N. ; Mirzajani, R. ; Kiasat A. R. ; Abdollahzadeh, R. ,Quim. Nova ,2012,35,1945 -1953.
CrossRef - Mendil, D. ; J. Food Sci. 2012,77, 181 -189.
CrossRef - Zhai, U. ; Chang, X. ; Cui, Y. ; Lian, N. ; Lai, S. ; Zhen, H. ; He, Q., Microchim. Acta ,2006,154 ,253-259.
CrossRef - Ghaedi, M. ; Fathi, M.R. Shokrollahi, A.; Shajarat, F., Anal. Lett. 2006, 39, 1171-1179.
CrossRef - Kera, D. ; Tekin, N., Microchim. Acta , 2005,149 ,193-198.
CrossRef - Meyer, J. C. ; Geim, A. K. ; Katsnelson, M. I. ; Novoselov, K. S. ; Booth, T. J.; Roth, S., Nature ,2007, 446, 60-68.
CrossRef

This work is licensed under a Creative Commons Attribution 4.0 International License.
About The Author
![]()
A New Edition of Web of Science
Journal Impact Factor
2022: 0.5
Five Year: 0.8
Journal is Indexed in

Cabells Whitelist
![]()


