Improvement of Efficiency and Electrical Energy Consumption of AB74 Degradation Process using A Novel Cylindrical Batch Photochemical Reactor.
Mohammad Ebrahim Olya*1, Yaser Akhi1 and Reza Marandi2
1Department of Applied Chemistry, Faculty of Chemistry, North Tehran Branch, Islamic Azad University, Tehran, Iran. No 9, Daftari Alley, Shariati St, Tehran, Iran.
2Department of Environmental Engineering, Faculty of Engineering, North Tehran Branch, Islamic Azad University, Tehran, Iran. No 79, Ghobadian Alley, Valiasr St, Tehran, Iran.
DOI : http://dx.doi.org/10.13005/ojc/320303
Article Received on : May 07, 2016
Article Accepted on : June 19, 2016
Optimization of electric energy consumption in degradation of Indigo Carmine based on a new cylindrical batch suspension photocatalytic reactor designing concerning the main engineering parameters such as mixing, reaction kinetic, mass transfer, catalyst illumination, and inherent potential of contaminant was done. The most degradation efficiency was observed within in air flow rate 1.2L.min-1, initial hydrogen peroxide concentration 0.0294mol.L-1, pH between 2-3, initial dye concentration 10mg.L-1, and initial TiO2 dose 2g.L-1. Applying optimum condition eventuated 76.09% TOC reduction after 60 min reaction time. The results show that designed reactor is extremely affective in reduction of operational cost.
KEYWORDS:Advanced oxidation processes; Acid Blue 74; TiO2 nanoparticles; photochemical reactor
Download this article as:| Copy the following to cite this article: Olya M. E, Akhia Y , Marandib R. Improvement of Efficiency and Electrical Energy Consumption of AB74 Degradation Process using A Novel Cylindrical Batch Photochemical Reactor. Orient J Chem 2016;32(3). |
| Copy the following to cite this URL: Olya M. E, Akhia Y , Marandib R. Improvement of Efficiency and Electrical Energy Consumption of AB74 Degradation Process using A Novel Cylindrical Batch Photochemical Reactor. Orient J Chem 2016;32(3). Available from: http://www.orientjchem.org/?p=17866 |
Introduction
Synthetic dyes are used extensively in different industries such as textile, cosmetics, food, pharmaceutical, tanning, paper, etc. It has been estimated that 1-20% of the world dye production is released into the environment during synthesis, processing, and finishing, which causes serious problems to the environment, because dyes are generally non-biodegradable, toxic, potentially carcinogenic, and non-aesthetic pollutants that reduce light penetration in the contaminated waters and threat aquatic life practically [1-5]. Therefore, dye removal of wastewaters using non-biological methods is necessary since as mentioned before, most of these compounds are non-biodegradable, and less than 10 azo dyes are purged with biological methods [6]. Other techniques such as adsorption, ion exchange, filtration, and coagulation only succeeded in transfering of dyes from water to another phase and they will require the secondary purification of solid wastes, regeneration of adsorbent or filteration that make the process more costly [3,7-9].
Advanced Oxidation Processes (AOPs) have been shown as a promising alternative techniques. These processes generally involve generation and use of powerful but relatively nonselective transient oxidizing species, primarily the hydroxyl radical (•OH) that would even mineralize refractory pollutants [8,10,11]. Different types of AOPs, such as UV/H2O2, UV/TiO2, and UV/H2O2/TiO2 were successfully used to treat various pollutants in water [12-17]. In these processes, the powerful hydroxyl radical with a high oxidation potential (2.8 eV), is degradation agent. It can oxidize variety of organic compounds and non-selectively attack to molecules that is an advantage for oxidizing agent in wastewater treatment. The ability of performance under ambient conditions, complete mineralization of organic carbon into CO2 are some other considerable advantages of AOPs. Moreover, TiO2 photocatalyst is widely available, biological inert, inexpensive, non-toxic, and shows a relatively high chemical stability [1,8,10,18,19].
In spite of mentioned advantages some important commitments including drastic limitation in the depth of UV light penetration because of strong adsorption on catalyst and contaminants, the necessity of uniform radiation of catalyst surface, recombination of photogenerated electron-holes on the catalyst surface, signalize the significance of reactor designing [20-22]. In the present paper an optimization on amount of electrical energy consumption for treatment of Indigo Carmine as a specific contaminant concerning suitable reactor designing and effect of key operating parameters such as initial air flow rate (F), initial hydrogen peroxide concentration ([H2O2]0), initial solution pH, initial dye concentration ([AB74]0), and initial TiO2 dose has been done.
Experimental
Reagents
5,5′- Indigotin disulfonic acid disodium salt (85%), commercially named C.I. Acid Blue 74 or AB74, was obtained from Merck and used without purification. The physicochemical characteristics of the mentioned dye are given in Table 1. Hydrogen peroxide (30% W/W), H2SO4 (98%), and NaOH (>98%) were also obtained from Merck. Titanium dioxide was supplied by Plasmachem (P25).
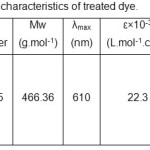 |
Table 1: Physicochemical characteristics of treated dye. Click here to View table |
Photocatalyst characterization
To characterize crystalline phase and the size of TiO2 particles, XRD analysis was used with Scherrer equation. The experiment was carried out with a STOE transmission diffractometer. Interpretation of spectrum shows that photocatalyst is composed of anatase and rutile structures with 80:20 ratios, and the average size of particles was estimated to be 21.5nm (Fig. 1). Fig. 2 shows the TEM bright-field image of Plasmachem TiO2 particles that confirms the aforementioned average size.
 |
Figure 1: XRD diffractogram of TiO2. Click here to View Figure |
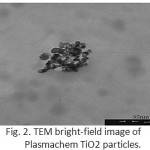 |
Figure 2: TEM bright-field image of Plasmachem TiO2 particles. Click here to View Figure |
Photocatalytic degradation procedure
In each experiment 1L of the dye solution was prepared using distillated water with the desired initial dye concentration. The desired pH was adjusted through adding diluted aqueous solution of H2SO4 or NaOH (different concentration of H2SO4 or NaOH was prepared for preventing changes in volume). Dye solution was poured into the photochemical reactor and the required amount of H2O2 and TiO2 was added. During irradiation, samples were collected at regular intervals and were centrifuged at 4000 rpm to remove any suspended solid before analysis. Degradation process was studied by monitoring the UV-Vis absorption spectra at λmax (610nm) and TOC analysis results. Degradation percentages were calculated using following formulas:

where A0(610) and A(610) are the absorbency at t=0 and desired time respectively.
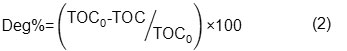
where TOC0 and TOC are the total organic carbon at t=0 and desired time recpectively.
Result and Discussion
Reactor designing
Photocatalytic reactor designing is faced to more complications than traditional reacor. Besides catalyst installation, mixig, reaction kinetic, mass transfer, another engineering parameter namely catalyst illumination becomes appear. An excellent interaction between light absorption, transport processes, reaction kinetic leads to strong coupling of physicochemical phenomena which is the major problem in designing of photocatalytic reactor. The amount of catalyst that can be activated determines the water treatment capacity of the reactor, so that the illumination parameter has the most importance [20-22]. In order to achievement of highest catalyst surface exposure to illumination a suspension photocatalytic reactor was concerned. By placement of illumination source (Osram 15W low-pressure mercury lamp, maximum emission at 254.7nm) in the center of the vessel most utilization was achieved. Concerning to the illumination source place that causes some limitations in agitation agent, air was injected into the solution through two tubes as the agitator (Fig. 3).
 |
Figure 3: Photoreactor Click here to View Figure |
Moreover existent oxygen in air would be changed to Singlet molecular oxygen by irradiation of Indigo Carmine that has a key role in wastewater treatment [23]. The photosensitization process for this species is as follows:
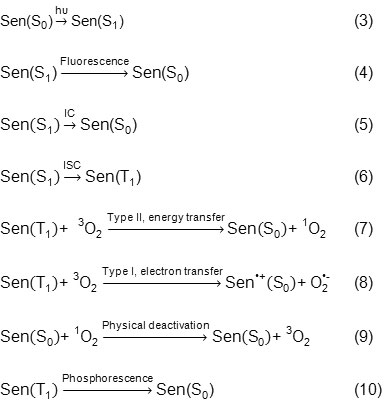
Type ІІ mechanism includes 1O2 production through energy transfer between T1 photosensitizer state and ground state 3O2 (Eq. 7). Type І mechanism includes abstraction of hydrogen atom or electron transfer between the excited photosensitizer and a substrate which finally produces oxygen radical. One example from reaction type І is making superoxide due to transfer of electron from one excited sensitizer to 3O2 (Eq. 8). Energy transfer from the excited Indigo Carmine to 3O2 is equal to ET=27-32 Kcal.mol-1. Also, considering the fact that energy difference between triple-ground and first excited singlet state of oxygen is 22.5 kcal.mol-1, so Indigo Carmine in the excited triplet state can react with 3O2 to produce 1O2 in accordance with Eq. 7. The amount of 1O2 produced by Indigo Carmine is affected by certain parameters like sensitizer and oxygen concentration, temperature, and irradiation time. Quantum yield of 1O2 production for Indigo Carmine is estimated to be about 0.3–0.6 [24]. Two methods are suggested for deactivation of 1O2:
![]()
The first method just leads to singlet oxygen deactivation and non-consumption of O2 and no product is produced (physical quenching).
![]()
In the second method quencher reacts with the singlet oxygen and new product is produced (chemical quenching).
Researches have shown that excited oxygen in singlet state is about 1V more oxidizing than oxygen with basic energy and is much more electrophilic. It can immediately react with unsaturated C-C bonds and neutral nucleophiles like sulphides, amines and anions. While excited triplet molecules can act as efficient sensitizers of singlet oxygen, in most of the cases, they themselves can act as efficient quenchers of this species. This process could lead to photobleaching and photodegradation. Photobleaching is most seen in degradation of dyes with singlet oxygen [23]. Therefore using this inherent specific of Indigo Carmine could improve reaction kinetic and consequently decrease the reaction time and electrical energy consumption.
The effect of initial air flow
In order to evaluate the influence of UV, H2O2, Aeration, and H2O2/Aeration on the degradation process preliminary experiments were carried out before the main experiments. Results show that the influence of these parameters on the dye decolorization was negligible. Therefore, combination of UV irradiation and oxidation agent is obligatory to start the decolorization reaction.
As results shown in Fig. 4, decolorization percentage after 100 min is equal to 92.3%, 95.1%, 96.9%, 100% and 100% in 0.3, 0.6, 0.9, 1.2 and 1.5 L.min-1 air flow rates respectively, so we can choose 1.2 L.min-1 as the optimum air flow rate. This is because of an increase in system turbulence, gas-liquid interfacial and mass transfer coefficient, each of which supply sufficient oxygen for oxidation process [7].
![Fig. 4. Effect of F on decolorization percentage, [AB74] = 20 mg.L⁻¹, pH=Natural, t= 100 min, T=25˚C.](http://www.orientjchem.org/wp-content/uploads/2016/06/Vol32No3_Impr_Ebra_fig-4-150x150.jpg) |
Figure 4: Effect of F on decolorization percentage, [AB74] = 20 mg.L⁻¹, pH=Natural, t= 100 min, T=25˚C. Click here to View Figure |
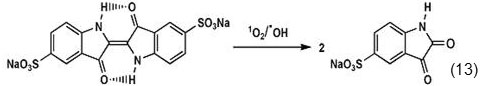
LC-MS and 1HNMR studies have shown that Indigo Carmine will be destroyed and converted to Isatin (Eq. 13).
Self-decay rate constant (Kd) is equal to (1.9 ± 0.3) x10 4 s-1. As already mentioned, single oxygen causes oxidative degradation of indigo carmine through reaction with central C=C bond. Also, oxidation may be done through reaction with superoxides produced in type І mechanism (Eq. 14) [3,24,25].
![]()
The effect of initial hydrogen peroxide concentration
The attack of photon on H2O2 and formation of hydroxyl radical (Eq. 15) is the main step in UV/Aeration/H2O2 process [25-27].
![]()
Increase of initial hydrogen peroxide concentration to the optimum value due to an increase in the formation of hydroxyl radicals leads to a dramatic rise in degradation percentage of AB74. But it should be noted that hydroxyl and superoxide radicals can react or recombine according to the following reactions:
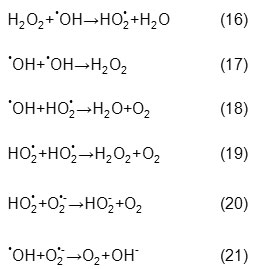
According to these reactions, hydroxyl radical assists in competition reactions instead of reaction with dye molecules and will be recombined or consumed consequently degradation rate will decrease, therefore defining appropriate amount of initial hydrogen peroxide concentration is an important step to avoid an excess amount of reagent [28,29,30]. Fig. 5 shows the optimum value of the relative hydrogen peroxide concentration, which is expressed as the mass ratio of the H2O2 concentration to that of the dye (H), is 50 (molar ratio is about 685.5, [H2O2]0=0.0294 mol.L–¹). This value varies in different experimental conditions and reactors. For instance, the optimum H2O2/AB74 molar ratio in a batch reactor with a 15W low-pressure mercury lamp was 5000, as reported by Galindo et al. [3] and 1000 in a semi batch reactor with a 15W UV lamp, as reported by Aleboyeh et al. [31]. This ratio decreased to 685.5 in this investigation, a fact that reveals better operation of the designed photoreactor which can consequently reduce costs through reduction of consumed reagents and process time, in fact, lower energy consumption reduces costs.
![Fig. 5. The effect of initial hydrogen peroxide concentration on decolirozation percentage, F=1.2 L.min-1, [AB74] = 20 mg.L⁻¹, pH=Natural, t=90s, T=25˚C.](http://www.orientjchem.org/wp-content/uploads/2016/06/Vol32No3_Impr_Ebra_fig-5-150x150.jpg) |
Figure 5: The effect of initial hydrogen peroxide concentration on decolirozation percentage, F=1.2 L.min-1, [AB74] = 20 mg.L⁻¹, pH=Natural, t=90s, T=25˚C. Click here to View Figure |
The effect of initial pH
Industrial wastewaters have various pH values; therefore, degradation of AB74 in the range of pH=2-10 was studied. The highest rate of degradation was observed at pH=2-3. Further increase in pH up to 10 has a reverse effect on the degradation rate, as illustrated in Fig. 6, increase in pH from 3 to 10 decreases decolorization percentage from 100% to 71.5%. This is due to several factors:
![Fig. 6. The Effect of Initial pH on decolirozation percentage, F=1.2 L.min-1, [AB74]= 20 mg.L⁻¹, H=50, t=60s, T=25˚C.](http://www.orientjchem.org/wp-content/uploads/2016/06/Vol32No3_Impr_Ebra_fig-6-150x150.jpg) |
Figure 6: The Effect of Initial pH on decolirozation percentage, F=1.2 L.min-1, [AB74]= 20 mg.L⁻¹, H=50, t=60s, T=25˚C. |
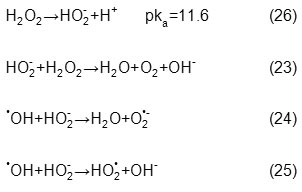
First, in alkaline pH values, H2O2 will decompose more to H2O and O2 instead of •OH, because the first-order self-decomposition constant of H2O2 (Eq. 22) at pH 7.0 and 10.5 are 2.29×10⁻² and 7.40×10⁻² min-1, respectively, that is approximately 3.2 times at pH=10.5 [32].
![]()
Second, in alkaline pH values, hydrogen peroxide and hydroxyl radicals concentration decrease (Eqs. 23-25), because hydroperoxy anion concentration (conjugate base of H2O2) increases at these pHs (Eq. 26), reacts with hydrogen peroxide and hydroxyl radicals consequently reduces the rate of dye degradation.
Third, the labile H atom in AB74 molecule is carried with N atom which is converted to the deprotonated form (conjugated base) in alkaline pH values. Degradation of this deprotonated form is less because hydroxyl radicals mostly oxidize organic compounds by hydrogen abstraction (Eq. 27) [33-35].
![]()
The effect of initial dye concentration
By increasing the initial dye concentration, k values and consequently degradation rate decreases (Fig. 7). Initial k values for dye solutions with 10, 20, 30, 40 and 50 mg.L-1 concentrations are 0.0523, 0.0376, 0.0246, 0.0182 and 0.0173 (s-1), respectively. This refers to the molar absorption coefficient of AB74 at 254nm that is nearly thousandfold of H2O2 (18.7×10³ versus 18.61 L.mol-1.cm-1). Therefore, increase in dye concentration acts like an inner filter and the solution becomes impermeable to UV radiation and since H2O2 absorbs smaller fraction of UV light, fewer hydroxyl radicals are produced [3].
![Fig. 7. Pseudo-first order decay curve at different [AB74] in UV/Aeration/H2O2 process, F=1.2 L.min-1, H=50, pH=Natural, t=60s, T=25˚C.](http://www.orientjchem.org/wp-content/uploads/2016/06/Vol32No3_Impr_Ebra_fig-7-150x150.jpg) |
Figure 7: Pseudo-first order decay curve at different [AB74] in UV/Aeration/H2O2 process, F=1.2 L.min-1, H=50, pH=Natural, t=60s, T=25˚C. Click here to View Figure |
The effect of initial TiO2 dose
Absorption of a photon with adequate energy, equal to or more than band-gap energy of the TiO2 (3.2 eV), initiates the process (Eq. 28). Consequently, an electron is promoted from the valance to the conduction band of the semiconductor, resulting in generation of a free electron and a positive hole. The photogenerated holes can oxidize the dye or react with OH– or H2O and oxidize them into •OH. The photogenerated electrons can reduce the dye or react with electron acceptors like O2 (reducing it to superoxide radical anion (O2•-)) or with H2O2 (reducing it to hydroxyl radicals) [1,7,10,36]. Recombination of photogenerated electron-holes is a serious problem in the use of photocatalysts, which is the main reason of energy dissipation and reduction of the quantum yield [1,10,39,37]. It has been demonstrated, providing the proper amount of oxygen is an important factor in the process that prevents recombination of photogenerated electron-holes [7,37]. The appropriate design of reactor in this research provides sufficient amount of oxygen for scavenging photogenerated electrons and preventing energy dissipation.
![]()
Influence of catalyst amount on degradation efficiency was studied, as results in Fig. 8 show, after 9 minutes of irradiation, decolorization percentages are 51.1%, 61.2%, 79.8%, 94%, 100% and 93.9% at initial TiO2 amounts of 0.05, 0.1, 0.5, 1, 2 and 3g.L-1 respectively. Therefore, an increase in initial TiO2 amount up to the optimum value (2g.L-1) leads to higher degradation rate due to increase in the number of active sites on the surface of photocatalyst and consequently an increase in hydroxyl and superoxide radicals. But, if this amount exceeds the optimum value, it can retard dye degradation because suspension will be impermeable toward UV radiation and will prevent illumination. Moreover, agglomeration of TiO2 particles masks part of the active sites [7,36,38-40].
![Fig. 8. The effect of initial TiO2 dose on decolorization percentage, F=1.2 L.min-1, [AB74] = 20 mg.L⁻¹, pH=Natural, t=9min, T=25˚C.](http://www.orientjchem.org/wp-content/uploads/2016/06/Vol32No3_Impr_Ebra_fig-8-150x150.jpg) |
Figure 8: The effect of initial TiO2 dose on decolorization percentage, F=1.2 L.min-1, [AB74] = 20 mg.L⁻¹, pH=Natural, t=9min, T=25˚C. Click here to View Figure |
Comparison of the UV/Aeration, UV/Aeration/H2O2, UV/Aeration/TiO2, and UV/Aeration/H2O2/TiO2 processes
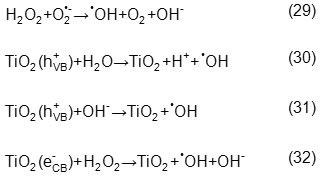
Through comparing decolorization rates at the optimum conditions of each AOP, it was found that decolorization rates are 1.5, 1.5, 9, and 100 min in UV/Aeration/H2O2/ TiO2, UV/Aeration/H2O2, UV/Aeration/TiO2, and UV/Aeratio processes respectively. As results show decolorization rate is equal in two first processes surprisingly, but TOC results show a significance difference between them so that 76.09%, 65.22%, 55.43%, 7.47% TOC reduction were obtained after 60 min in each process. Mineralization rate variation is due to an increase in concentration of hydroxyl radicals in UV/Aeration/H2O2/TiO2 process according to Eqs. 29-32.
Economic computations
Recently, International Union of Pure and Applied Chemistry (IUPAC) provided a method for computing the amount of electrical energy consumption in advanced oxidation processes. Regarding pseudo first order reactions, the parameter of electrical energy per order (EEo) is defined as the necessary electrical energy in terms of kWh to reduce 90% of pollutant concentration in 1m3 of the contaminated water. This parameter is calculated according to the following equations:
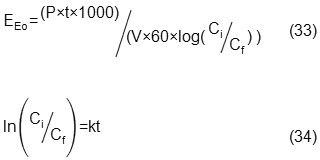
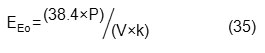
where P is the rated power (kW) of the AOP system, t is the irradiation time (min), V is the volume of wastewater in the reactor (L), Ci is the initial concentration of pollutant, Cf is the final concentration of pollutant and k is the pseudo first order rate constant (min-1). Using the above two equations we can reconstruct EEo as follows [41]:
With the use of the defined parameters, if the price of electricity for every kWh is 10 ¢, we can set the table 2 for AB74 degradation.
Table 2: Processes electricity cost, F=1.2 L.min-1, [AB74] = 20 mg.L–¹, H=50, [TiO2]=2g.L-1, pH=Natural, T=25˚C.
|
Process |
K(min-1) |
EE0(kWhm-3order-1) |
Cost |
| UV/Aeration |
0.0247 |
23.32 |
233.2 |
| UV/Aeration/TiO2 |
0.4472 |
1.288 |
12.88 |
| UV/Aeration/H2O2/TiO2 |
2.256 |
0.255 |
2.55 |
Conclusion
Many important parameters are effective in selection of a wastewater treatment technology including economic issues, environmental regulations, final quality of the purged wastewater, operational conditions (maintenance, control and safety) and the ability to update equipment. Although all these parameters are important, but as usual, the economic parameter is take priority. Since destruction of organic pollutant in water is a process which consumes electrical energy and this energy is considered as the main part of operational cost, so estimating the amount of energy consumption in the process can give us valuable information. During this work a precise calculation and optimization of electric energy consumption base on contaminant properties, process type, and other engineering parameters were done. Results confirmed extreme influence of studied parameters on operational cost.
References
- Konstantinou, I.K.; Albanis, T.A.; Appl. Catal. B: Environ. 2004, 49, 1–14.
CrossRef - Sun, J.; Wang, X.; Sun, J.; Sun, R.; Sun, S.; Qiao, L.; J. Mol. Catal. A: Chem. 2006, 260, 241–246.
CrossRef - Galindo, C.; Jacques, P.; Kalt, A.; J. Photochem. Photobiol. A: Chem. 2001, 141, 47–56.
CrossRef - Saikia, J.; Das, G.; J. Environ. Chem. Eng. 2014, 2, 1165-1173.
CrossRef - Bansal, P.; Sud, D.; Desalination. 2011, 267, 244–249.
CrossRef - Forgacs, E.; Cserhati, T.; Oros, G.; Environ. Int. 2004, 30, 953–971.
CrossRef - Chakrabarti, S.; Dutta, B.K.; J. Hazard. Mater. 2004, B112, 269–278.
CrossRef - Andreozzi, R.; Caprio, V.; Insola, A.; Marotta, R.; Catal. Today. 1999, 53, 51-59.
CrossRef - Gutpa, V. K.; Jain, R.; Agarwal, S.; Shirvastava, M.; Colloids Surf., 2011, A378, 22–26.
- Topuduti, K.; Tay, S.; Monschein, E.; Advanced photochemical oxidation processes, U.S.Environmental Protection Agency Publication, (1998).
- Autin, O.; Hart, J.; Jarvis, P.; MacAdam, J.; Parsons, S. A.; Jefferson, B.; Wat. Res. 2013, 47, 2041-2049.
CrossRef - Slokar, Y.M.; Marchal, A.M.L.; Dyes Pigm. 1998, 37, 335-356.
CrossRef - Tanaka, K.; Padermpole, K.; Hisanaga, T.; Wat. Res. 2000, 34, 327-333.
CrossRef - Baran, W.; Makowski, A.; Wardas, W.; Dyes Pigm. 2008, 76, 226–230.
CrossRef - Guillard, C.; Disdier, J.; Herrmann, J.M.; Lehaut, C.; Chopin, T.; Malato, S.; Blanco, J.; Catal. Today. 1999, 54, 217-228.
CrossRef - Yang, H.; Li, G.; An, T.; Gao, Y.; Fu, J.; Catal. Today. 2010, 153, 200–207.
CrossRef - Rizzo, L.; Selcuk, H.; Nikolaou, A. D.; Pagona, S. M.; Belgiorno, V.; Desalin. Water Treat. 2014, 52, 1414–1421.
CrossRef - Vohra, M.S.; Davis, A.P.; Wat. Res. 2000, 34, 952-964.
CrossRef - Oturan, M. A.; Aaron, J. J.; Crit. Rev. Environ. Sci. Technol. 2014, 44, 2577–2641.
CrossRef - Mukherjee, P.S.; Ray, A.K.; Chem. Eng. Technol. 1999, 22, 253-260.
CrossRef - Ray, A.K.; Chem. Eng. Sci. 1999, 54, 3113-3125.
CrossRef - Periyathamby, U.; Ray, A.K.; Chem. Eng. Technol. 1999, 22, 881-888.
CrossRef - DeROsa, M.C.; Crutchley, R.J.; Coord. Chem. Rev. 2002, 233-234, 351-371.
- Gandra, N.; Frank, A.T.; Gendre, O.L.; Sawwan, N.; Aebisher, D.; Liebman, J.F.; Houk, K.N.; Greer. A.; Gao, R.; Tetrahedron. 2006, 62, 10771-10776.
CrossRef - Crittenden, J.C.; Hu, S.; Hand, D.W.; Green, S.A.; Wat. Res. 1999, 33, 2315-2328.
CrossRef - El-Dein, A.M.; Libra, J.A.; Wiesmann, U.; Chemosphere. 2003, 52, 1069–1077.
CrossRef - Stefan, M.; Hoy, A.; Bolton, J.; Environ. Sci. Technol. 1996, 30, 2382-2390.
CrossRef - Aleboyeh, A.; Aleboyeh, H.; Moussa, Y.; Dyes Pigm. 2003, 57, 67–75.
CrossRef - Muruganandham, M.; Swaminathan, M.; Dyes Pigm. 2004, 62, 269–275
CrossRef - Chang, M.W.; Chung, C.C.; Chern, J.M.; Chen, T.S.; Chem. Eng. Sci. 2010, 65, 135-140.
CrossRef - Aleboyeh, A.; Aleboyeh, H.; Moussa, Y.; Environ. Chem. Lett. 2003, 1, 161- 164.
CrossRef - Chu, W.; Chemosphere. 2001, 44, 935-941.
CrossRef - Aleboyeh, A.; Moussa, Y.; Aleboyeh, H.; Dyes Pigm. 2005, 66, 129-134.
CrossRef - Beltran, F.J.; Gonzalez, M.; Gonzalez, J.F.; Wat. Res. 1997, 31, 2405-14.
CrossRef - Galindo, C.; Kalt, A.; Dyes Pigm. 1998, 40, 27-35.
CrossRef - Elmolla, E. S.; Chaudhuri, M.; Desalination. 2010, 252, 46–52.
CrossRef - Yamazaki, S.; Matsunaga, S.; Hori, K.; Wat. Res. 2001, 35, 1022-028.
CrossRef - Huang, M.; Xu, C.; Wu, Z.; Huang, Y.; Lin, J.; Wu, J.; Dyes Pigm. 2008, 77, 327–334.
CrossRef - Olya, M. E.; Pirkarimi, A.; Sep. Purif. Technol. 2013, 118, 557–566.
CrossRef - Gutpa, V. K.; Jain, R.; Mittal, A.; Saleh, T. A.; Nayak, A.; Agarwal, S.; Sikarwar, S.; Mater. Sci. Eng. 2012, C32, 12–17.
- Daneshvar, N.; Aleboyeh, A.; Khataee, A.R.; Chemosphere. 2005, 59, 761-767
CrossRef

This work is licensed under a Creative Commons Attribution 4.0 International License.
![]()
A New Edition of Web of Science
Journal Impact Factor
2022: 0.5
Five Year: 0.8
Journal is Indexed in

Cabells Whitelist
![]()


