Evaluation of Nigerian Source of Kaolin as A Raw Material for Mullite Synthesis
Ajanaku Kolawole Oluseyi1*, Aladesuyi Olanrewaju1, Mousumi Pal2 and Swapan Kumar Das1,3,4
1Covenant University, Km.10, Idiroko Road, Canaanland, Ota, Ogun State, Nigeria
2Jadavpur University, Kolkata-700032, India
3Formerly, CSIR-Central Glass and Ceramic Research Institute, Kolkata – 700032, India
4Guest Faculty, Ceramic Engineering, University Colleges of Science and Technology, Calcutta University, Kolkata - 700009, India
Corresponding Author’s Email: kola.ajanaku@covenantuniversity.edu.ng
DOI : http://dx.doi.org/10.13005/ojc/320333
Article Received on : January 15, 2016
Article Accepted on : February 25, 2016
Article Published : 23 May 2016
In the present study, a new source of kaolinitic clay (Al2O3.2SiO2.2H2O) collected from Abule Onikosin Road in Abeokuta area of Ogun State, Nigeria was first processed to remove the stony materials adhered to its surface and subsequently characterized with respect to its chemical analysis, TG-DTA, particle size spectrum and identification of mineralogical phases by XRD technique. The identified endothermic peak at 516.39oC for dehydroxylation in the DTA curve and observed deformed XRD profile confirm that the clay belongs to disordered kaolinitic clay. The high SiO2 content (59.26 wt%) compared to theoretical value (46.54 wt%) of well-ordered kaolinite is due to excess silica and this has been revealed in XRD pattern as quartz peak. The compact samples of this processed clay powder on heating in the temperature range of 1400-1600oC resulted almost densified and impervious sample at 1600oC. The densification occurred by viscous flow mechanism. Silica together with impurity oxides (Fe2O3, TiO2) in the clay forms glassy phase in the above temperature range and that accompany the formation of mullite (3Al2O3.2SiO2) crystals. The XRD and FESEM studies conducted on heated samples revealed the formation of mullite needle, the amount and aspect ratio of which increases with increase in heating temperature. The EDAX studies confirm the presence of Al, Si, O as major elements which also support mullite formation in the heated compact samples. This new sources of kaolinitic clay identified in Nigeria is found to be suitable for mullite synthesis and it is advantageous due to its low temperature mullitization unique microstructure.
KEYWORDS:Kaolinite;disordered structure;mullite;TG-DTA;phase transformation;sintering
Download this article as:| Copy the following to cite this article: Oluseyi A. K, Olanrewaju A, Pal M, Das S. K. Evaluation of Nigerian Source of Kaolin as A Raw Material for Mullite Synthesis. Orient J Chem 2016;32(3). |
| Copy the following to cite this URL: Oluseyi A. K, Olanrewaju A, Pal M, Das S. K. Evaluation of Nigerian Source of Kaolin as A Raw Material for Mullite Synthesis. Orient J Chem 2016;32(3). Available from: http://www.orientjchem.org/?p=16362 |
Introduction
Kaolinite, the most common clay mineral, has the theoretical formula (OH)4Al2Si2O5 (frequently expressed as Al2O3.2SiO2.2H2O). When pure, it has the composition (by mass) of alumina 39.56 %, silica 46.54 %, water 13.90 %, with a 1:1 sheet silicate structure composed of a [Si2O5]2- layer and an [Al2(OH)4]2+ layer. Commercial kaolin contains 80 – 90% of the clay mineral, contaminated mainly with quartz and fined grade mica or hydrous mica but seldom with appreciable proportions of feldspar1, 2.
Kaolin is usually produced by the weathering of pegmatites or micaceouschist. Pegmatite has been mentioned to contain kaolinised alkali-feldspar with quartz and abundant mica3. Hydrolysis, desilication and hydration are the typical reaction sequences for the formation of kaolin4. It is reported that the reactions continue not only by chemical means but also by colloidal transfer. Improper removal of potassium by weathering process may lead to the formation of illitic clays (2:1 sheet silicates) instead of kaolinite. Kaolin is found in two types of deposits5, 6 namely (a) as residual kaolin, where the clay is found replacing their parent rock from which it was formed and (b) as sedimentary kaolin, composed of particles transported from the original point of formation by stream action and settled in deposits at the bottom of relatively quiet water, often with some alteration. The purity of residual kaolin depends on the purity of the parent rock, the completeness of decay, the amount of unwanted components lost by solution and the amount of impurities brought in from other sources. Sedimentary kaolin is seen as clay materials that have been washed out of rock masses and deposited in stratified layers by the action of water. Purification takes place both during transport and in the deposit. Both highly and poorly crystalline variety of kaolin occurs in different deposits. The degree of crystalinity of clays is generally expressed as the “Hinkley Index”7. The degree of crystalinity depends on extent of ionic substitution within the octahedral and tetrahedral layer of kaolinite lattice. Highly crystalline kaolin offers lower plasticity due to lower charge imbalance in the lattice, whereas poorer crystalinity kaolin offers considerably more plasticity.
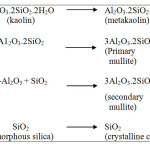
Kaolinitic clay mineral is one of the major raw materials for the production of various types of ceramic products having certain valuable properties. Most important one is the formation of mullite crystals during heating at higher temperatures which has several applications in ceramic products by providing good mechanical strength to the body. The applications for many clay based ceramic products are determined by their physical properties which, in turn, may depend on their chemical and mineralogical composition and particle size1. Mullite crystallization is a common phenomenon involving the thermal transformation of kaolinite8. Nevertheless, the amount of SiO2 together with the impurities in kaolinite forms a glassy phase and cristoballite to accompany the formation of mullite at a temperature higher than 1000oC9, 10. The quantity and development of mullite phase determines the final properties of the products to a great extent. The different phases formed during heating of kaolin at different temperatures have been reported by many authors and the summarized sequence of reactions is shown below10. After the removal of chemically combined water, kaolin is converted to metakaolin at above 600oC followed by formation of another metastable phase alumino-silico spinel (2Al2O3.3SiO2). In the temperature range of 950 – 980oC, primary mullite (3Al2O3.2SiO2) starts forming together with gamma alumina, another metastable phase and amorphous silica. It is reported that gamma alumina combine with amorphous silica and by chemical reaction forms mullite in the temperature range of 1200 – 1250oC11. At 1240 – 1250oC temperature, secondary mullite appears together with amorphous silica. Finally, in the temperature range of 1240 – 1350oC, amorphous silica converts to crystalline cristoballite.
 |
Scheme 1 Click here to View scheme |
A survey of clay deposits carried out by the geological survey of Nigeria identified the principal clay deposits12. Although some of the deposits are small, there are many that are vast and can serve as the source of raw material for the building industry13. Such variety of clays with higher amount of impurity oxides such as Fe2O3, TiO2, Na2O and lower amount of Al2O3, SiO2 may be suitable for manufacturing building bricks but not suitable for mullite synthesis due to inadequate Al2O3 : SiO2 ratio and presence of higher amount of impurity oxides. In a typical properties in the phase analysis of ceramics materials indicates the importance of Al2O3 : SiO2 ratio in the type of shapes that will encourage mullite formation14. Good quality kaolin is found in Kastina state of Nigeria and it is certified by mining experts as one of the best and cleanest kaolinitic mineral resources that lie beneath kankara soil15,16. The clay was characterized with X-ray diffraction studies and result shown that kaolinite is the dominant mineral phase with minor amounts of quartz, goethite and muscovite16. It was reported that low kaolinitic clays can also be used in the production of geopolymer bricks after calcination17. Ekiti state of Nigeria has shown sedimentary and secondary deposition of clays in very large quantities. Geologically, these clays were mainly found to be refractory clay group after some scientific examinations. A study exploited the characteristic properties of Ekiti-kaolin mineral and reported new areas of applications in glass matrix composites, reinforced particles in friction lining material in addition to the existing development of ceramic brake pad for automobile industry18. Several authors studied the suitability of Nigerian sources of kaolinitic clay minerals for the development of refractory products19,20. Another study examined the fundamental properties of different soil sample of clay from Ebonyi state of Nigeria21. The findings of the research work would help in oil prospecting operations, process modification and development of clay refractory products particularly for foundry22.
In the present study, an attempt has been made to evaluate a particular source of kaolin collected from Abule Onikosin Road in Abeokuta area of Ogun state which is located within latitude 7O8’32” N and longitude 3O27’3″ E south western part of Nigeria as a raw material for the synthesis of mullite (3Al2O3.2SiO2) which is considered to be an important precursor for variety of ceramic products. The detail physico-mechanical properties, phase and microstructural evolution on heating this kaolin at higher temperatures have been investigated and various application possibilities of mullite thus obtained have been discussed.
Experimental
The kaolinitic clay mineral was collected from Abule Onikosin Road in Abeokuta area of Ogun State, Nigeria and it was dried and agglomerated lumps were broken to separate the stony materials adhered to the clay mass. After separating the stony materials, the clay was wet milled in a pot mill for four hours after which the clay slurry was sieved through 60 mesh BS sieve. The slurry passed through 60 mesh and was collected and dried in an oven till the moisture content reduced to less than 0.5 wt%. The dried mass was powdered and the following tests were conducted.
Chemical analysis
Different analytical techniques were used to determine the chemical constituents present in the above processed clay. SiO2 and Al2O3 were estimated by volumetric method. CaO and MgO were determined complexometrically and Fe2O3 and TiO2 were determined by spectrophotometry method23. Na2O and K2O were determined by flame photometry and loss on ignition by usual technique.
Thermo-gravimetric and Differential thermal analysis (TG-DTA)
The thermo gravimetric and differential thermal analysis of the processed clay sample was performed in a non-isothermal condition and in nitrogen atmosphere up to 1250oC at a heating rate of 10 oC/min using simultaneous TG-DTA apparatus [NETZSCH STA 449].
Particle size analysis
The dry powdered sample was subjected to particle size distribution measurement using particle size analyzer [Microtrac S 3500].
X-ray Diffraction studies
The minerological phases present in the processed clay sample were determined using X-Ray diffractometer [PAN Anlytical], using CuKα radiation. The XRD data were recorded in step-scan mode with step size 0.05O and step time 75 sec from 10-80O.
After characterization of the processed clay, the powder was moistened with 5- 6 wt% water and rectangular samples (65 mm × 14 mm × 5 mm) were prepared by compacting in a hydraulic press at a pressure of 350 Kg/cm2. The pressed samples were dried in an oven at a temperature of 110oC for 24 hrs. The dried samples were then subjected to heating in the temperature range of 1400-1600oC. The heated samples were finally subjected to the following characterization: Percent Linear Shrinkage (%LS); Bulk density (BD); Percent Water absorption (%WA) and Percent Apparent porosity (%AP); Flexural strength; X-ray diffraction studies for phase identification; Field emission scanning electron microscopic study and energy dispersive X-Ray analysis (FESEM and EDAX).
The percent linear shrinkage was determined by measuring length of the sample before firing and after firing. Bulk density, percent water absorption and percent apparent porosity were measured by conventional water displacement method following Archimedes principle. The flexural strength of the heated samples were determined by three point bending method using INSTRON 5500R. For scanning electron microscope study, samples were grinded with SiC powder and water and then the samples were polished with diamond paste. The polished surfaces of each sample were with water and acetone followed by gold coating [Edwards, Scancoat].
Secondary electron image (SEI) of etched surface was observed by FESEM [Zeiss]. For EDAX analysis OXFORD was used.
Results and Discussion
Characteristics Of The Processed Kaolinitic Clay
Table 1 provides the results of chemical analysis of the processed clay material. This clay contains higher amount of SiO2 (59.26 wt% compared to a theoretical value of 46.5 wt% in pure kaolinitic clay), Fe2O3 and TiO2 and lower amount of Al2O3. The obtained SiO2 : Al2O3 ratio is also in correlation with what is obtainable in Zambia clay minerals3. The excess SiO2 is due to presence of free quartz. The presence of Fe2O3 and TiO2 in clay may promote sintering of the clay compact and formation of mullite at lower temperatures.
Table 1: Chemical analysis of the processed Clay
| Constituents(wt%) |
SiO2 |
Al2O3 |
Fe2O3 |
TiO2 |
CaO |
MgO |
Na2O |
K2O |
LOI |
|
59.26 |
24.04 |
3.87 |
1.46 |
0.39 |
0.14 |
0.74 |
0.3 |
9.4 |
The TG-DTA study (Figure 1) revealed the presence of one endothermic peak at 516.39oC which is due to removal of water of crystallization (dehydroxylation). The temperature of dehydroxylation depends on the structural layer stacking order. It is known that disordered kaolinite dehydroxylate at less than 570oC and ordered kaolinite between 570-630oC24. Hence the kaolinite used in this study may be disordered type. This is confirmed by X-ray diffraction study. The exothermic peak at 993.51oC is attributed towards transformation of amorphous metakaolin (Al2O3.2SiO2) to crystalline mullite (3Al2O3.2SiO2). The TG curve shows 9.042% mass loss which supports the chemical analysis data.
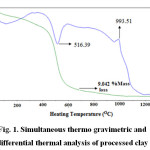 |
Figure 1: Simultaneous thermo gravimetric and differential thermal analysis of processed clay Click here to view figure |
The measurement of particle size distribution of the processed clay powder is shown in Figure 2. The nature of the curve confirms monomodal distribution with d50 value 1.655μm. The detail particle size spectrum analysis calculated from the curve is provided in Table 2. The particle size distribution data of the clay powder provides important information for sintering the clay body. The spectrum data as obtained here confirms that the clay used in this study is finer in size and it will react faster to attain equilibrium phases.
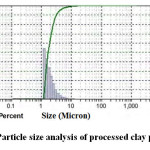 |
Figure 2: Particle size analysis of processed clay powder
|
Table 2: Particle size distribution of the processed clay powder
|
Percentile |
10.00 |
20.00 |
30.00 |
40.00 |
50.0 (d50) |
60.00 |
70.00 |
80.00 |
90.00 |
95.00 |
|
Size (μm) |
1.247 |
1.321 |
1.404 |
1.515 |
1.655 |
1.827 |
2.056 |
2.403 |
3.4 |
4.04 |
X-ray diffraction pattern of the processed clay powder is shown in Figure 3. The XRD peaks obtained indicate that the clay used in this study mainly consists of kaolinite Al2Si2O5(OH)4 and quartz (SiO2) as crystalline phases. However, when comparing the diffraction pattern with well-ordered kaolinitic clay, it may be observed that the diffraction pattern in the present kaolinitic clay is slightly deformed and this indicate that the kaolinite used in this study belongs to disordered type of kaolin which is also buttressed by the DTA result. Earlier study also revealed the disorder in the crystal structure cause deformation of X-ray diffraction profile25. Hence it may worthwhile to carry out a detail study on the structural disorder of these Nigerian sources of natural kaolinite using the model on computer simulation of XRD data26. The high intensity quartz peak observed in the diffraction pattern may be due to the presence of excess silica in the clay as found in chemical analysis.
![Fig. 3. X-Ray Diffraction pattern of processed Clay sample [K=Kaolinite, Q=Quartz]](http://www.orientjchem.org/wp-content/uploads/2016/05/Vol32No3_EVA_AJAN_fig-3-150x150.jpg) |
Figure 3: X-Ray Diffraction pattern of processed Clay sample [K=Kaolinite, Q=Quartz]
|
Characterization Of Fired Kaolinitic Clay Compacts Densification Study And Strength Development
The results of LS, BD, WA and AP are shown in Figure 4. It may be observed that %LS and BD increases with increase in heating temperature and %WA and %AP decreases with increase in heating temperature due to densification. No significant variation is observed in the temperature range of 1400 – 1500OC. However, at 1600oC, the samples are almost densified and %AP considerably reduced to 3.80% from a value of 24% at 1500oC. It can be inferred that the densification of a clay body at higher temperature proceeds by forming a viscous alumina-silicate liquid phase that permeate the pores and pull the grains together leading to consolidation of the clay matrix. Different impurity oxides namely Fe2O3 and TiO2 present in the clay used in this study might have entered the glassy phase, decreasing its viscosity and made this glass more fluidised resulting in higher shrinkage at 1600oC.
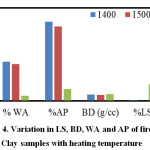 |
Figure 4: Variation in LS, BD, WA and AP of fired Clay samples with heating temperature
|
Figure 5 illustrates the variation in flexural strength of the fired clay samples in relation to heating temperature. It may be revealed that with the increase in heating temperature flexural strength steadily increases and reaches its highest value (≈19MPa) at 1600oC. This is due to higher densification of the clay body at this temperature. The XRD and FESEM results discussed in later section confirm the presence of well-developed mullite crystals in the 1600oC heated samples and this has contributed towards strength development.
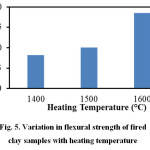 |
Figure 5: Variation in flexural strength of fired clay samples with heating temperature |
Phase Identification and Microstructural Study
X-ray diffraction study was carried out to identify the crystalline phases formed during heating of the kaolinitic clay compacts at three different temperatures (1400, 1500 and 1600oC) and the pattern is provided in Figure 6. At all temperatures, quartz and mullite are the major crystalline phases observed from this XRD pattern. The effect of temperature on the mullite formation is not very significant in the lower temperature range but an increasing trend is observed at higher temperatures and it is more pronounced at 1600oC. The extent to which mullitization process proceeds depends upon the extent of order of the kaolinite. It has been reported that well-ordered kaolinite affords maximum opportunity for the formation of mullite since the proper alignment of octahedral elements carried over into metakaolinite is in accord with the requirements imposed by the mullite lattice27. Since the kaolinite used in the present study is disordered type, its mullitization behaviour on heating is different from well-ordered kaolinite. In the present investigation, mullitization occurred also in presence of foreign ions (Fe+3, Ti+4) which help to form mullite from the glass by replacing Al+3 in its structure.
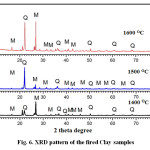 |
Figure 6: XRD pattern of the fired Clay samples
|
The microstructural studies on the samples heated at three different temperatures was conducted using Field Emission Scanning Electron Microscope (FESEM) technique. The microphotographs have been shown in the Figures 7, 8 and 9 for 1400, 1500 and 1600oC heated samples respectively along with their EDAX results. Clusters of well-developed mullite needles were observed in 1400oC heated compact itself due to the presence of large amount of liquid phase (Figure 7). The existence of liquid phase encourages the exposure of low-energy crystallographic faces. Mullite needles which exhibit low-energy faces are therefore formed. The aspect ratio of mullite crystals increases with increase in heating temperature. The mullite needles observed in 1500oC heated compacts is larger than 1400oC specimen (Figure 8). An earlier study examined the microstructure evolution of mullite during sintering of kaolin powder compacts and observed almost similar findings in their 1400 and 1500oC heated specimens28. However, very well crystallized mullite needles were seen throughout the matrix in their samples without any quartz grains which may be due to use of well-ordered pure variety kaolinitic clay. Due to the presence of excess silica in the presently used kaolinitic clay, few quartz grains are also observed in the matrix. The EDAX analysis reveals the presence of Si, Al, O as major element which supports the formation of mullite.
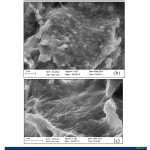 |
Figure 7: Photomicrograph at 1400oC at different position and magnification
|
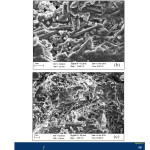 |
Figure 8: Photomicrograph at 1500oC at different positionand magnification
|
The microstructure of 1600OC heated specimen looks more compact (Figure 9) due to maximum densification. The matrix is wetted by formation of more liquid phases at this temperature. Another study investigated the microstructure evolution and phase transformation of different sintered kaolin powder compacts and found that densification of kaolinite compact take place through viscous flow during heating at high temperatures as we observed in our present study29. The EDAX analysis of 1600oC heated specimen also confirms the presence of Si, Al and O and support the formation of mullite.
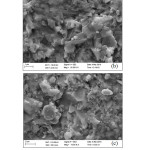 |
Figure 9: Photomicrograph at 1600oC at different position and magnification |
The mullite synthesized from the Nigerian kaolin in the present study may be tried in its aggregate form of different size fractions for the production of medium duty refractory products.
Conclusion
A Nigerian source of Kaolin used in this study is a disordered type of kaolinitic clay as confirmed by DTA and XRD results. High SiO2 together with the impurities Fe2O3 and TiO2 in the kaolin forms glassy phase to accompany the formation of needle shaped mullite at 1400oC itself and mullite content increases with increase in heating temperature. Densification of the kaolin compacts takes place through viscous flow mechanism and the highest densification is achieved at 1600oC. The mullite needles are formed in-situ within the compacts during sintering. The study revealed that the mined kaolin can be utilized for the synthesis of mullite after physical beneficiation. Advantages of using this presently available Nigerian source of kaolin powder as the starting material for mullite synthesis are (1) low temperature mullitization and (2) unique microstructure. Attempts will be made in future work to increase the mullite content further by adding very fine calcined alumina to this processed clay powder which will react with excess SiO2 and form mullite. Selective dopants will also be utilized to stimulate sintering process.
References
- Grim, R. E. “Applied Clay Minerology” – MacGraw-Hill Book Co. Inc. N. Y., Toronto, London, 422 (1962).
- Murray, H. H. Clay Minerals 1999, 34, 39-49. http://dx.doi.org/10.1180/000985599546055.
CrossRef - Xavier, M. G.; Banda, S. F.; Chama, C. C. Orient J. Chem. 2013, 29(4) http://dx.doi.org/10.13005/ojc/290460
CrossRef - Murray, H. H.; Keller, W. D. Clay Minerals Society 1993, 1-341.
- Ries, H. “Clays: Their occurrence, properties and uses” 3rd edition, John Wiley, N. Y. (1927).
- Pawlee, C. W.; Mcvay, T. N. J. Am. Ceram. Soc. 1927, 10(8), 598. http://dx.doi.org/10.1111/j.1151-2916.1927.tb16430.x.
CrossRef - Hinkley, D. N. Proceedings of the 11th National Conference on Clays & Clay Minerals, Ontario, Canada, 1962, 229-235.
- Carty, W. M.; Senapati, U. J. Am. Ceram. Soc. 1998, 81, 3-20. http://dx.doi.org/10.1111/j.1151-2916.1998.tb02290.x.
CrossRef - Brindley, C. W.; Nakahira, M. J. Am. Ceram. Soc. 1959, 42, 319-324. http://dx.doi.org/10.1111/j.1151-2916.1959.tb14316.x.
CrossRef - Kingery, W. D. “Introduction to Ceramics” Wiley, N. Y., 78-79; 87; 532-540 (1976).
- Kuo-Chung, L.; Gareth, T.; Angel, C.; Jose, S. M.; Salvador de Aza, J. Am. Ceram. Soc. 1994, 77(6), 1545-1552. http://dx.doi.org/10.1111/j.1151-2916.1994.tb09755.x.
CrossRef - Otoko, G. R.; Ephraim, M. E. Int. J. of Eng. & Tech. Res. 2014, 2(2), 1-8.
- Chinwah, J. G.; Otoko, G. R. J. of the Nigerian Inst. of Structural Eng. 1978, 8(6), 22-29.
- Zhukov, I. A.; Dedova, E. S.; Buyakova, S. P.; Kulkov, S. N.; Levkov, R. V.; Mamontov, G.; Promakhov, V. Orient J. Chem. 2016, 32(1).
- Aderemi, B. O. Nigerian J. of Scientific Research 2004, 4(2), 7-12.
- Iori, J. A.; Myina, O. M.; Ekanem, E. J.; Lawal, A. O. Research Journal of Applied Sciences, Engineering and Technology 2011,3(5), 440-446.
- Qhatani, M.; Nasser, Y. M. Ceramics-Silikaty 2010, 54(2), 160-168.
- Aderiye, J. Intl. J. of Technology Enhancement and Eng. Research 2014, 2(3), 84-88.
- Ahmed, S. A. “Development of phosphate bonded fireclay refractory castables” M.Sc. Thesis, Chemical Eng. Dept., Ahmadu Bello University, Zaria (1986).
- Aniyi, J. A. “Investigation of the refractory property of Kankara clay” M.Sc. Thesis, Chemical Eng. Dept., Ahmadu Bello University, Zaria (1985).
- Nweke, E. S.; Ugwu, E. I. The Pacific J. of Science and Technology 2007, 8(2), 190-193.
- Lawal, A. O.; Abdullahi, Y. Science World Journal 2010, 5(3), 17-20.
- Hillebrand, W. F.; Lundell, G. C. E. “Applied Inorganic Analysis” 2nd edn. John Wiley and Sons, N.Y. (1953).
- Gamelas, J.; Ferraz, E.; Rocha, F. Colloids and Surfaces A: Physicochemical and Engineering Aspects 2014, 455, 49-57. http://dx.doi.org/10.1016/j.colsurfa.2014.04.038.
CrossRef - Deluca, S.; Slaughter, M. American Mineralogist 1985,70, 149-158.
- Artioli, G.; Bellotto, M.; Gualtieri, A.; Pavese, A. Clay and Clay Minerals 1995, 43(4), 438-445. http://dx.doi.org/10.1346/CCMN.1995.0430407.
CrossRef - Johns, Wm. D. “High temperature phase changes in kaolinite” Part of Ph.D thesis submitted in the University of Illinois, June (1953).
- Chen, C. Y.; Lan, G. S.; W. H. Tuan, Ceramics International 2000, 26, 715-720. http://dx.doi.org/10.1016/S0272-8842(00)00009-2.
CrossRef - Ghorbel, A.; Fourati, M.; J. Bouaziz, Material Chemistry and Physics 2008, 112(3), 876-885. http://dx.doi.org/10.1016/j.matchemphys.2008.06.047.
CrossRef

This work is licensed under a Creative Commons Attribution 4.0 International License.
![]()
A New Edition of Web of Science
Journal Impact Factor
2022: 0.5
Five Year: 0.8
Journal is Indexed in

Cabells Whitelist
![]()


