Characterization Micro/Nanostructures of Barium Strontium Titanate
Abdelhalim Elbasset1,2, Farid Abdi1 , Taj-Dine Lamcharfi1 and Nor-Said Echatoui1
1LSSC Department of Electrical Engineering, Faculty of Science and Technology (FST), University Sidi Mohamed Ben Abdellah Y, Fes, Morocco.
2Department of Physics, University Sidi Mohammed Ben Abdellah, Faculty of Science D -M, B.P.1796 , Fès- Atlas Morocco.
Corresponding Author E-mail: elbasset.abdelhalim@gmail.com
DOI : http://dx.doi.org/10.13005/ojc/320326
Article Received on : April 06, 2016
Article Accepted on : May 25, 2016
Structural characteristics of Ba0.0975S0.025TiO3 (BS0.025T) ceramics calcined at different temperatures at 800, 850 and 900°C for 4 hours hove been investigated. Results DRX showed that the change in the cell parameter along a axis (a) is more important than that along c axis and is accompanied by spacing of these parameters. In addition they indicate that the diminuation of symmetry is caused by the increase of the calcination temperature This trend towards the tetragonale phase was confirmed by Raman spectroscopy. Electronic scan microscopy (SEM) has given the grains mean size, the latter increase and reaches a mean size of approximately 1.97 μm when the calcination temperature increases equals 900°C.
KEYWORDS:Structural characteristics; DRX; Raman spectroscopy
Download this article as:| Copy the following to cite this article: Elbasset A, Abdi F, Lamcharfi T, Echatoui N. Characterization Micro/Nanostructures of Barium Strontium Titanate. Orient J Chem 2016;32(3). |
| Copy the following to cite this URL: Elbasset A, Abdi F, Lamcharfi T, Echatoui N. Characterization Micro/Nanostructures of Barium Strontium Titanate. Orient J Chem 2016;32(3). Available from: http://www.orientjchem.org/?p=17856 |
Introduction
Barium titanate, BaTiO3 formula was discovered in the late 1940. It is the first single ferroelectric oxide known and today remains a model material for the study of ferroelectricity. Employed as a solid ceramic or thin layer, barium titanate is widely used in the industry for its dielectric and piezoelectric properties 1). This material possesses nonlinear properties and may be developed for the realization of new frequency converters by frequency doubling by phase matching. This ternary compound with a perovskite structure is probably one for which literature is the most abundant and is qualified as one of the most prolific among the analyzed inorganic structures. Its properties, both optical and electrical, were proved to be technologically very promising, such as for example, the mirror conjugation pumper phase, the linear resonator, the phasing of laser sources and finally the active waveguides 2). On the other hand the potential of BaTiO3 is linked particularly to the existence of piezoelectric properties 3-5). The study of these properties is necessary before any development.The ultimate goal of this work is to study the effect of heat treatment temperature on the structural state of doped strontium barium titanate.
Synthesis
Solutions of barium acetate, Strontium carbonate and the ground Ti are mixed in stoichiometric proportions, depending on the chemical formulation Ba0.0975S0.025TiO3 under agitation for 5 min. The destabilization of this solution is assured by evaporation of the solvent in an oven at the temperature of 80°C for 96h.The different steps in the preparation of the Ba0.0975S0.025TiO3 powders are similar to those we have in our previous work 6). The xerogel obtained is ground in an agate mortar. Raw powder, after grinding, is calcined in air at different temperatures 800, 850 and 900°C for 4 h, in a programmable oven. The effect of temperature on the structure of the obtained samples was studied by X-ray diffraction (RX), Raman spectroscopy and scanning electron microscopy (SEM).
Result
Fig.1 shows XRD spectra of Ba0.0975Sr0.025TiO3 powders calcined at different temperature for 4 hours. Thes specter reveal the crystallization of the powders in the perovskite phase with the presence of secondary microphase at 800 °C; this crystallization temperature is clearly lower than that of other processes, such as conventional solid and co-precipitation methode 3-5) and even for the sol-gel preparation method 10). On the other hand the secondary phase disappears at the calcination temperature 850 °C for 4 hours. It is also observed that the crystallization peaks of the perovskite phase are becoming closer and more intense when the calcination temperature increases. This indicates a better crystallization of the phase. However, the increase of the calcination temperature causes the appearance of double peaks ((200) and (002)) in the vicinity of 41 in 2θ, therefore, increased heat treatment may increase the quadracity of the ceramic 11) and a sharp peak with narrow peak width is an indicator of lrge grain size 12-13). On the other hand it is noted that the change in the lattice parameter along a axis is greater than that along c axis and spacer supports the lattice parameters a and c (Figure 2 ). We can learn from these analyzes that the observed decreasing symmetry is caused by the increase of the calcination temperature. Figure 3 shows the morphology and the grain size of the BS0.025T ceramic sintered at 1100 °C for 8 hours. The grains formed have a relatively uniform size and fairly regular. On the other hand it is important to note that the grains formed have a rather variable form with calcination temperature increase. Indeed for the calcination temperature 850 °C, the medium is of the order of 0.69 µm which increases and reached an average size of about 1.97 µm when the calcination temperature increases to 900 °C.
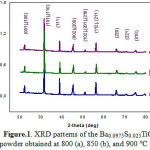 |
Figure 1: XRD patterns of the Ba0.0975 S0.025TiO3 powder obtained at 800 (a), 850 (b), and 900 °C (c). |
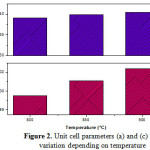 |
Figure 2: Unit cell parameters (a) and (c) variation depending on temperature |
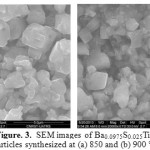 |
Figure 3: SEM images of Ba0.0975S0.025TiO3 nanoparticles synthesized at (a) 850 and (b) 900 °C for 4 h |
Raman spectra of the powder Ba0.0975Sr0.025TiO3 calcined at various temperatures are shown in Figure 4. Between 200 and 300 cm-1, there are two modes A (LO1) and A (TO2) boated around 218 and 247 cm-1 respectively, however the increase of the calcination temperature causes a gradual decrease in the intensity thereof to the appearance of a single broadband at 900 °C.
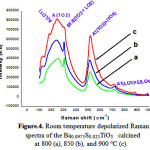 |
Figure 4: Room temperature depolarized Raman spectra of the Ba0.0975S0.025TiO3 calcined at 800 (a), 850 (b), and 900 °C (c). |
We also observed a narrow band around 305 cm−1 associated with the modes B1 and E(TO3 + LO2), and a wide and asymmetrical strip with 520 cm−1 associated with the modes A1(TO3) and E(TO4) and another wide peak (not very intense) around 720 cm−1 associated with the modes A1(LO3) and E(LO4). One may also note the increase in intensity of the mode E(LO4)/A1(LO3) by against that of E (TO3 + LO2) / B1 becomes very important. This is closely related to the significant increase in lattice parameters observed above in Figure 2. This indicates a trend towards the tetragonal phase. Indeed, many researchers agree on the fact that the presence of E (TO3) to 305cm-1 mode around. Who comes from idle F2U of the cubic phase, is a characteristic of the tetragonal phase of the unit cel BT 14-15). And that the decrease of the number of Raman bands is a consequence of an increase in the lattice symmetry 13,16). Those are the consequence of shift of frequencies of the Raman modes. Besides, we have observed the presence of two bands at around 117 and 804 cm-1, which have not been reported in the literature; these bands are not detectable on the spectrum recorded at 900°C, and their presence may be closely related to the secondary phase BaCO3, in accordance with DRX observation.
Conclusion
The structural analysis results found by XRD and Raman spectroscopy showed that the effect of heat treatment temperature is to change the structure from the pseudo cubic phase to the tetragonal phase by the large increase in the lattice parameter a. therefore heat treatment temperature decreases the symmetry of Ba0.0975S0.025TiO3. Moreover, this study showed that the increase of the temperature of calcination lead a good crystallization of the Ba0.0975S0.025TiO3 samples, but also to a large increase in the grain size.
References
- Hana, N .; Adel, M. ; and Mohamed, M. Orient J Chem. 2013, 29(3), 937-944
- Scott, J. F. Materials Science and Engineering B: Solid-State Materials for advanced Technology, 2005, l. 120, 6- 12.
- Rawat, M. ; Yadav, K.L. Ceram. Int. 2013, 39, 3627–3633.
CrossRef - Wei-Gang, Y.; Bo-Ping, Z.; Nan, M.; Lei, Z. Journal of the European Ceramic Society . 2012, 32, 899–904
CrossRef - Kyung-Su, L.; Jung-Hyuk, K.; Ceramics International. 2013, 39, S701–S704
CrossRef - Elbasset,A.; Abdi, F.; Lamcharfi,T.; Sayouri, S.; Aillerie, M . J International Review of Physics (IREPHY). 2013, 7 (3), 87–93.
- Schunemann, P. G.; Temple, D. A.; Hathcock, R. S.; Tuller, H. L.; Jenssen, H. P.; Gabbe, D. R.; and Warde, C. JOSA B. 1988, 5 (8), 1685-1696.
CrossRef - Robert, N.; Barry, S.; Wechsler, A.; and West, L. Appl. Phys. Lett. 1995, 67, 1352
CrossRef - Kellati, M.; Thése de la faculté des sciences Dhar Mehraz, Fes, 2002.
- Omari, M.H.; Thése de la faculté des sciences Dhar Mehraz, Fes, 2000.
- Hernandez-Cruz, D.; Sahouli, B.; Tork, A.; Knystautas, J.; and Lessard, R. A. Proceedings of SPIE 4296, Conf. Practical Holography XV and Holographic Materials VII. 2001, 244-248.
- Tika, P. S .; Novesar, J .; Syukri; Zefri. A.; Asregi, A. Orient J Chem. 2014, 30(4), 6362.
- ABO-ALMAGED, H. H.; Khattab. R. M.; and Sadek, H. E. H. Orient J Chem. 2016, 32(1), 243-251
- Chaves, A.S.; Katiyar, R.S.; Porto, S.P.S. Phys. Rev.B. 1974, 10, 3522.
CrossRef - Sanjarjo, J.A.; Katiyar, R.S.; Porto, S.P.S. Phys. Rev. B. 1980, 22, 2396.
CrossRef - Loubbidi, L.; Naji, M.; Orayech, B;. Chagraoui, A.; Igartua, J. M.; Moussaoui, A.; Tairi, A.; and AitSidiAhmed, O. Orient J Chem. 2016, 32 (1), 47-57.
CrossRef

This work is licensed under a Creative Commons Attribution 4.0 International License.
![]()
A New Edition of Web of Science
Journal Impact Factor
2022: 0.5
Five Year: 0.8
Journal is Indexed in

Cabells Whitelist
![]()


