A New Method for Prediction of Wastewater Treatment Efficiency in the Photo catalytic Processes
M. E. Olya
Department of environmental research, Institute for color science and technology, Tehran, Iran.
Corresponding Author Emaill: Olya-me@icrc.ac.ir
DOI : http://dx.doi.org/10.13005/ojc/320319
Article Received on : December 17, 2015
Article Accepted on : January 31, 2016
Article Published : 25 Jun 2016
For the first time, in the present study, a new approach of using the color properties of acid red 18 decolourization behavior by synthetized nano photocatalytic TiO2-Ag2O. In this manner two color system (CIE L*a*b* and CIE L*C*hº) used to calculate the color properties (lightness, Chroma and hue) of samples during the decomposition process. MATLAB software was used to transfer absorbance data obtained from VU-Vis spectrophotometer to L*, a*, b*, C* and hº. Effect of key operator parameters such as pH, catalyst dosage, [H2O2]/Dye=H were evaluated during the process. The results of this research indicated a good correlation between theoretical results (based on color characteristic results) and experimental results. Also decolourization behavior could be predicted using the CIE color system.
KEYWORDS:Color properties; Dye removal; Nano catalyst; Wastewater treatment
Download this article as:| Copy the following to cite this article: Olya M. E. A New Method for Prediction of Wastewater Treatment Efficiency in the Photo catalytic Processes. Orient J Chem 2016;32(3). |
| Copy the following to cite this URL: Olya M. E. A New Method for Prediction of Wastewater Treatment Efficiency in the Photo catalytic Processes. Orient J Chem 2016;32(3). Available from: http://www.orientjchem.org/?p=18059 |
Introduction
Industrial wastewater often contains significant amounts of non-biodegradable organic compounds. The elimination of these contaminants is necessary before a biological treatment of these effluents. Common ways of wastewater treatment include adsorption, sedimentation, chemical analysis, biological methods, and advanced oxidation procedures [1–3]. However, these approaches are not without their disadvantages. Biological methods, for example, take much time and cannot degrade complicated dyes [3]. Among the different methods that have been applied to dye degradation advanced oxidation processes (AOPs), in which oxygen- based radicals (ºOH–, HO2–, and ºO2–) are generated in situ from water and O2 is considered more appropriate [4- 7]. AOPs methods have been applied for degradation of different colored compounds using UV-Vis light in presence of H2O2 or a mixture of H2O2 and a photo-catalyst. This method usually produces a highly reactive hydroxyl (ºOH) and superoxide anion (ºO2–) radicals which are responsible of degradation of the dyes into simpler and safer organic compounds such as water-carbon dioxide. Between the different photo catalysts, TiO2 is one of the most widely used semiconductor photo catalysts; its unique characteristics are well documented. TiO2 is also used in antifogging and anti-corrosion surfaces, photo catalytic lithography and photo chromic materials [8]. Major limitations such as UV irradiation and fast recombination of hole-electron pairs within nanoseconds, lead in application of additives such as Pt, Pd and Au for improving the photo catalytic efficiency of TiO2 [9-12]. Silver (Ag) is a suitable and nontoxic element which improves the TiO2 bioactivity because of its inborn antibacterial activity against different microorganisms [13-15].
Using the other science point of prospect could help to have better feedback from research.”Color Technology” concerns the science and technology associated with creating, controlling and characterizing the visual appearance of materials, and images [16, 17]. Color is one of the most important qualities which is considered in many applications such as foods [18], cosmetics [19] art, architectural [20, 21], health care [22] and many other applications which affects every moment of our lives. In the present study for the first time, a mathematical relation between color sciences and wastewater treatment is proposed. So, the color properties of C.I. AR18 were measured during the decolourization with TiO2-Ag2O nano photocatalytic, and process by MATLAB software.
Color attributes and color system
Hue, Chroma, and lightness demonstrate three-dimensional of color. These attributes provide three coordinates that could be applied to “map” color in a color space. CIE Color Systems or Commission International de l’Eclairage (the International Commission on Illumination), is responsible for international recommendations of colorimetry. In 1931, the CIE established standards for a series of color spaces or system that represent the visible spectrum. Using these systems, the varying color spaces of different viewers and devices against repeatable standards are compared. The ultimate destination of the CIE was to develop a repeatable system of color communication standards for manufacturers of paints, inks, dyestuffs, and other applications. These standards’ most important purpose was to offer a general framework for color matching. The CIE Color Systems utilize three coordinates to locate a color in a color space. These color spaces include:
• CIE XYZ
• CIE L*a*b*
• CIE L*C*hº
Those three-dimensional formats are also a very convenient way to compare the relationship between two or more colors. When a color is expressed in CIE L*a*b*, L* defines lightness, a* denotes the red/green value and b* the yellow/blue value. Fig 1 shows the color-plotting diagram for L*a*b*. A color measurement movement in the +a direction depicts a shift toward red. Along the b* axis, +b movement represents a shift toward yellow. The center L* axis show L = 0 (black or total absorption) at the bottom. At the core of this space is gray. While CIE L*a*b* uses Cartesian coordinates to calculate a color in a color space, CIE L*C*hº uses polar coordinates and can be derived from CIE L*a*b*. The L* defines lightness, C* specifies Chroma (Purity, Saturation) and hº denotes hue angle (Fig 1).
![Fig.1: (a) the color-plotting diagram for L*a*b*(b) the color-plotting diagram for L*c*hº [24]](http://www.orientjchem.org/wp-content/uploads/2016/06/Vol32_No3_New_M.-E_Fig1-150x150.jpg) |
Figure 1: (a) the color-plotting diagram for L*a*b*(b) the color-plotting diagram for L*c*hº [24] |
Both L*a*b* and L*C*h° attributes could be derived from a measured color’s spectral data:
L* = 116 (Y/Yn) 1/3 – 16
a* = 500 [(X/Xn) 1/3 – (Y/Yn) 1/3]
b* = 200 [(Y/Yn)1/3 – (Z/Zn)1/3]
L* =116 (Y/Yn)1/3 – 16
C* = (a2 + b2)1/2
h° = arctan (b*/a*)
Xn, Yn, Zn, are reference white values for the white illumination [16, 17, 23].
Materials and Method
Catalyst preparation
The sol solution prepared by adding 70 mL of ethanol to 500 mL beaker that had been stirred by a magnetic stirrer then added 5 mL diethanolamin and 20 mL TBOT slowly with mixing the ethanol solution. The mixture was stirred by a magnetic stirrer during addition and for a further 120 min after addition of the precursor at room temperature. Then, mixture of 1mL deionizer water and 15mL ethanol limit was added drop by drop to ethanol solution rotation and kept stirring for 2hr.
The second stage, adding of AgNO3 in absolute ethanol (with 1:110 M) and stirred with 5 minutes. Then added mixture of ethanol and distilled water (1:2:10 M) slowly with fast mixing and stirred for 15 minutes a transparent sol was obtained. Then added to get Ag2O to TiO2 sol (1:5 M) to obtain Ag2O-TiO2 sol-gel. 24hr until was dried to Proximity air and for 10 minutes at 350ºCand 5hr at 500 ºCunder thermal function. Finlay was cold sample natural to procure nano composite.
Catalyst characterization
The synthesized catalyst was characterized by XRD analysis. The result certifies Ag2O-TiO2 couple production. Using the Deby- Scherrer equation the particle size was measured 25-26 nm. According to SEM analysis the surface morphology was verified as a well-ordered and good size distribution of spherical particles.
Photocatalytic reactor and chemical materials
All of the experiments were evaluated in a batch
photocatalytic reactor equipped a low pressure UV lamp (Philips, 15 W) with a total volume of The colored solution was mixed during the process by a magnetic mixer
All of the chemical materials such as chemical solutions were purchased from Merck. Also Acid red 18 (AR18) was obtained from Saujanya Marketing Company India and the characteristics of the dye was presented in this research.
Spectrophotometric analysis
A VU-Vis spectrophotometer (PerkinElmer, USA) was used for absorbance measurement of samples. Spectral absorbance data of samples, then transformed into CIE L*a*b* and CIE L*C*hº colorimetric coordinates under CIE standard illuminant D65 and a CIE 1964 standard colorimetric observer using MATLAB software. The Program wrote to calculate this transform is reported in appendix 1.
Result and Discussion
Decolorization Results
The XRD pattern of synthesized Ag2O/TiO2 photocatalyst is shown in Fig.2.a. The XRD patterns, the average particle diameter of the synthesized Ag2O/TiO2 was found to be in the nanometer range as calculated from the Debye-Scherer equation. The crystallite size of the samples was about 25-26 nm. The morphology of the samples obtained in the presence of Ag2O is illustrated in Fig.2.b. The analyses performed on silver dioxide nanoparticles of titanium dioxide nanoparticles confirmed.
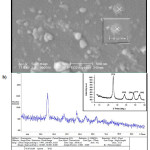 |
Figure 2: SEM image and XRD pattern of Ag2O-TiO2
|
Photocatalyst experiments
The photocatalytic activities of the prepared catalysts were investigated through degradation of AR18 in a semi-batch photocatalytic reactor and the effects of key operator parameters were studied
The influence of testing parameters
The effect of Ag2O on decolourization process was evaluated on 20 mg.L-1 colored solution using 0.01, 0.02, 0.04 and 0.06 gr.L-1 of Ag2O as a catalyst the optimum dosage of the catalyst (0.02 gr.L-1) obtained in this process. Fig. 3.a, shows Due to the experiments results conducted and observed values, the best efficiency was in 0.02 gr.L-1 of catalyst because larger amount of catalyst can prevent from UV light reaching to the solution, also the effect pH on the dye decolourization was evaluated different values of pH (3 – 9) with a fixed amount of catalyst loading (0.02 gr.L-1) was investigated occurred. At fig.3.b presents, the most Adsorption of the dye on the catalyst surface happens at pH of 6.28 that was natural pH of dye. Finally H2O2 concentration effect, (H= [H2O2/Dye]) on the process efficiency was studied and result were shown in fig.3.c. Decolourization percentage increase with increasing the H amount up to on optimum value and after it, there is not a significant variable. [25-26].
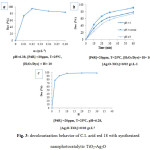 |
Figure 3: decolourization behavior of C.I. acid red 18 with synthesized nanophotocatalytic TiO2-Ag2O
|
Color characteristics of decolourized samples
Fig.4.a. illustrates the variation of lightness in both CIE L*a*b* and CIE L*C* hº system. The results show that increasing the time of treatment, increase lightness to the value of 100 similar to the pure water. Increasing the lightness indicate that increasing the time, decrease the concentration of C. I. AR18 in solution as expected and confirmed by the treatment result (section 4.1.).
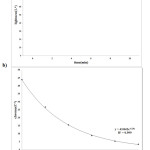 |
Figure 4: Variation of decolourized solution lightness and Chroma during time of treatment |
The variation of Chroma (Purity, Saturation) in CIE L*C*hº is shown in fig.4.b. The results show a reduction in Chroma during the time of treatment. This reduction shows that increasing the time; the concentration of the dyes decrease in the solution. It confirms the efficiency of TiO2-Ag2O nano photocatalytic in decolourization process.
The hue angles of C.I. AR18 solution change from 10 to 72º by a linear equation increasing the time of treatment (fig.5). Those hue angles are related to the real color which are also calculated by MATLAB and illustrate in fig. 5.
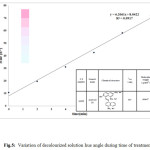 |
Figure 5: Variation of decolourized solution hue angle during time of treatment Click here to View figure |
Fig.6.a. shows the variation of a* during the decolourization. The results show that a* decrease in exponential rate to achieve a constant value. Decreasing the positive value of a* mean that the amount of red color in the solution decreases with time, which, indicate the reduction in dye concentration. The Positive b* value of the samples (fig.6.b) indicates that the presence of impurities in C.I. Acid red 18 with yellow color. TLC chromatography is used to demonstrate the presence of impurities. Fig.6.b. also shows that decreasing the value of b* with time happen in an interesting way. It seems that the impurities in C.I. AR18 resist to treatment until 4s, since b* value does not significantly change. While After 4s, b* value start to reduce which implies the decomposition of impurities.
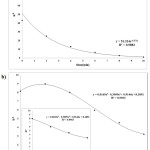 |
Figure 6: Variation of decolourized solution a* and b* during time of treatment
|
The fitted equations for a*, L*, and c* are the logarithmic equations as below
a* = 51.324e-0.371x (1)
L* = 10.267ln(x) + 80.669 (2)
c* = 43.842e-0.26x (3)
The logarithmic trend lines equation of a*, L*, and c* show that, increasing the time to more than 10 min is not the useful and proper way to increase the efficiency of treatment. Since as the results show all trend lines become linear after 10 min and it seem that no more change will happen. The processes were evaluated after 10 min of reactions to approve the fitted equations.
Economic study
There are the different important parameters to select a good and effective method for dye removal process. Among of these, economic study has an important role in the different sectors of the industries.
The economic study of this process could be evaluated using the following equation [27-28]
EE= (P×t×1000) ÷ (V×60×Log (TOCo/TOC)) (4)
Where: P is power of the lamp, t is time, V is volume and TOCo and TOC are respectively amount of organic carbon in 0 and 10 minutes. According to the following equation (K is kinetic constant)
Ln (TOCo/TOC) =Kt (5)
Following equation to be achieved:
EE=2/303(P×1000)/ (V×60×K) (6)
EE/O= (32/8×P) / (V×K) (7)
The photocatalytic degradation of various organic compounds by means of illuminated photo catalyst is formally described by the Langmuir–Hinshelwood kinetics model:

When the adsorption is relatively weak and/or the reactant concentration is low (KC<<1) [29], neglecting KC in the denominator and integrating with respect to time t, the above equation can be simplified to the pseudo-first order kinetic model equation:

where dC/dt is the rate of dye degradation (mol.L-1.min-1); C0 =initial concentration of the dye (mol.L-1), C=concentration of the dye at time t (mol.L-1); t=irradiation time (min), κ=kinetic constant (mol.L-1.min-1), K=the adsorption coefficient of the dye onto the photocatalyst particle (L.mol-1), kapp =the apparent rate constant calculated from the curves (min-1). According to linear correlation between kapp and Ln C0/C, EE could be calculated by equation 6. [29].
Table 1 presents the EE/O values of the different dye concentrations as a results, EE/O and electrical cost of the process have a direct relation witch the dye concentration.
Table 1: Economic calculation
|
40 |
30 |
20 |
C (ppm) |
|
0.1307 |
0.1806 |
0.2225 |
K |
|
1.13 |
0.817 |
0.663 |
EE/O |
Conclusion
Using color properties of materials (lightness, hue and Chroma) to characterize the properties of them is very common in different industries. The aim of this study is to use the color properties of wastewater to investigate the decolourization behavior of C.I. acid red 18 with synthesized TiO2-Ag2O nano photocatalytic. The color characteristics show that increasing the time of treatment, increase lightness (L*) and decrease Chroma (C*) of the samples, which both indicate that the concentration of the dye in sample decrease during decolourization. This result also confirmed by a* results. Positive value of a* (which denotes the red color of samples) decreases during the decolourization, which represent the reduction in the amount of red dye in solution. Positive value of b* demonstrate the presence of yellow impurities in C.I. AR18. The existence of impurities is also confirmed by TLC results. The b* value is starting to change after 4 min of decolourization. Therefore, it seems that the impurities resist to decomposition until 4 min. due to the results of the present study, color characteristics could be used to predict of the dye decolourization process in the wastewaters.
Apendix1.
Clc;
Close all;
Clear all;
cd (‘D:\’) ;
[num txt] = xlsread (‘Book1.xls’,’Sheet1′,’A2:G602′);
Num = flipud (num);
s=find (num (:, 1)==400) ;
e=find (num (:, 1)==700) ;
R=num(s: 10: e, 2:7);
XYZ=my_r2xyz (R, 400, 700,’d65_64′);
Lab=xyz2lab (XYZ,’d65_64′);
C=makecform (‘lab2lch’);
lch= applycform (lab, C) ;
C = makecform (‘xyz2srgb’);
rgb= applycform (XYZ/100,C) ;
rgb = reshape (rgb,[6 1 3]) ;
imtool(rgb)
Reference
- C.A, Basha., N.S, Bhadrinarayana., N, Anantharaman., K.M, Meera Sheriffa Begum., J., Heavy metal removal from copper smelting effluent using electrochemical cylindrical flow reactor. Hazard. Mater. 2008,152 (1), 71–78.
CrossRef - M, Bayramoglu., M, Kobya., O,T, Can., M, Sozbir., Operating cost analysis of electrocoagulation of textile dye wastewater. Sep, Purif, Technol. 2004, 37 (2), 117–125.
CrossRef - O,T, Can., M, Kobya., E, Demirbas., M, Bayramoglu., Treatment of the textile wastewater by combined electrocoagulation. Chemosphere. 2006, 62 (2), 181–187.
CrossRef - F, Chen, P. Fang, Y, Gao, Z. Liu, Y, Liu, Y. Dai, Chem. Eng. J, 2012, 204–206 107.
- M, Chamam., C.M, Földvár., A.M, Hosseini., A, Tungler., E, Takács., L, Wojnárovits., Rad, Phys, Chem. 2012, 81, 1484.
- B, Han., J.K, Kim., Y, Kim., J.S, Choi., K.Y, Jeong., Rad. Phys. Chem. 2012, 81, 1475.
- L.A.W, Abdou., O.A, Hakeim., M.S, Mahmoud., A.M, El-Naggar., Chem. Eng. J. 2011, 168 ,7528.
- A, Fujishima., X, Zhang., D.A, Tyrk., Surf, Sci, Rep. 2008, 63, 515–582.
- H, Gerischer., A, Heller., J, Phys., Chem., The role of oxygen in photooxidation of organic molecules on semiconductor particles. 1991, 95, 5261–5267.
- G, Rothenberger., J, Moser., M, Gratzel., N, Serpone., D.K, Sharma., J. Am.,. Charge carrier trapping and recombination dynamics in small semiconductor particles. Chem. Soc. 1985, 107, 8054–8059.
CrossRef - L, Zang., W, Macyk., C, Lange., et al., Visible-light detoxification and charge generation by transition metal chloride modified titania. Chem. Eur. J. 6, 2000, 379–384.
CrossRef - A, Dawson., P.V, Kamat., Photo induced fusion and photo catalysis of gold-capped TiO2 (TiO2/Gold) nano particles Semiconductor-metal nano composites. J, Phys, Chem. B 2001, 105, 960–966.
CrossRef - M.S, Lee., S.S, Hong., M, Mohseni., A Chem, Synthesis of photo catalytic nano sized TiO2–Ag particles with sol–gel method using reduction agent. J. Mol, Catal. 2005, 242, 135–140.
CrossRef - V, Rupa., D, Manikandan., D, Divakar., T, Sivakumar., Effect of deposition of Ag on TiO2 nano particles on the photo degradation of reactive yellow-17. J. Hazard, Mater. 2007, 147, 906–913.
CrossRef - S.X, Liu., Z.P, Qu., X.W, Han. C.L, Sun., a mechanism for enhanced photo catalytic activity of silver-loaded titanium dioxide Catal, Today 93. Color research and technology, 2004, 877–884.
- Roy S, Berns., Fred W, Billmeyer., Max Saltzman., Wiley., Principles of color technology, 2000.
- Mark D., Fairchild., Wiley., Color Appearance Models, 2013.
- Milind Ladanyia, Elsevier., Citrus Fruit: Biology., Technology and Evaluation., USA, 2010.
- John Gra., The World of Hair Color, 2004.
- Ruth Johnston-Feller., Color Science in the Examination of Museum Objects: None destructive Procedures, 2001.
- K. Nassau., Elsevier., 1997. Color for Science, Art and Technology.
- Color in the health care environment., Proceedings of a special workshop held at the National Bureau of Standards, Gaithersburg., Maryland, 1976, USA.
- The Color Guide and Glossary, www. xrite.com.
- J.R, Guimarães., M.G, Maniero., R, Nogueira de Araújo,, A comparative study on the degradation of RB-19 dye in an aqueous medium by advanced oxidation processes. Journal of Environmental Management. 2012, 110, 33–9.
CrossRef - H, Shu., M, Chang., H, Fan., Effects of gap size and UV dosage on decolorization of C.I. Acid Blue 113 wastewater in the UV/H2O2 process. Journal of Hazardous Materials. 2005, 118, 205–11.
CrossRef - Bai, J., Zhou, B.X., Li, L.H., Zheng, Q., Liu, Y.B., Shao, J.H., Zhu, X.Y., Cai, W.M., A new glass substrate photoelectrocatalytic electrode for efficient visible-light hydrogen production: CdS sensitized TiO2 nanotube arrays. J. Mater, Sci. 2008, 1880–1884.
CrossRef - Zheng, Q., Zhou, B.X., Bai, J., Li, L.H., Jin, Z.J., Zhang, J.L., Li, J.H., Liu, Y.B., Cai, W.M., Zhu, X.Y, Self-Organized TiO2 Nanotube Array Sensor for the Determination of Chemical Oxygen Demand. Adv. Mater. 2008, 1044–1049.
CrossRef - Y.A, Shaban., M.A, El Sayed., A.A, El Maradny., R.K, Al Farawati., M.I, Al Zobidi., Photocatalytic degradation of phenol in natural seawater using visible light active carbon modified (CM)-n-TiO2 nanoparticles under UV light and natural sunlight illuminations. Chemosphere. 2013, 91, 307–13.
CrossRef - B, Gözmen., M, Turabik., A, Hesenov., Photocatalytic degradation of Basic Red 46 and Basic Yellow 28 in single and binary mixture by UV/TiO2/periodate system. J. Hazard. Mater. 2009, 164, 1487–95.
CrossRef

This work is licensed under a Creative Commons Attribution 4.0 International License.
![]()
A New Edition of Web of Science
Journal Impact Factor
2022: 0.5
Five Year: 0.8
Journal is Indexed in

Cabells Whitelist
![]()


