Panantoprazole sodium sesquihydrate complexes: Synthesis, characterization, potentiometric determination and DNA interaction
1Department of Chemistry, Faculty of Science, Suez University, Suez, Egypt.
2Department of Chemistry, Faculty of Science, Cairo University, Giza, Egypt.
3Chemistry Department, Faculty of Science and Arts, University of Jeddah, Alkamel, Kingdom of Saudi Arabia. Corresponding author Email: wael.hegazy@suezuniv.edu.egDOI : http://dx.doi.org/10.13005/ojc/320234
Download this article as:
![]()
The synthesis and characterization of solid complexes for pantoprazole sodium sesquihydrate with Cd(II), Hg(II) and Zn(II) metals in molar ratios M:L = 1:2 was studied. The complexes are stable in the solid state and are soluble only in DMF and DMSO. The metal complexes were characterized by elemental analysis, molar conductivity measurements, magnetic susceptibility, UV spectrophotometry, IR, Mass spectra, TGA/DTG analysis. Potentiometric measurements for these metal complexes were studied.
KEYWORDS:Pantoprazole; complexes; potentiometry; Proton Pump Inhibitors; DNA interaction
Introduction
Pantoprazole sodium sesquihydrate is benzimidazole derivatives which have biological activity to inhibits gastric acid secretion [1]. Pantoprazole act as good ligand as it have several coordination mode [2-4]. Many drugs enhance its pharmacological and toxicological properties by their complexation with metal ions. Cd(II), Hg(II) and Zn(II) [5]. In this paper, ,any techniques were used to characterize the prepared pantoprazole complexes. DNA interaction of these complexes wer given.
Experimental
Solid complexes
All complexes were prepared according to the following procedure. The pantoprazole ligand (0.5 mmol) is dissolved in 10 cm3 H2O. The metal salt (0.25 mmol) dissolved in 10 cm3 H2O is added dropwise with continues stirring to the ligand solution. The formed precipitate was filtered, washed with hot water and dried. Synthesized solid complex was characterized by elemental analysis, IR, mass spectrometry, electrical conductivity, magnetic susceptibility, UV spectroscopy and thermal analysis.
![Fig.1: Linearization curves of [Cd(PNZ)2(H2O)2]H2O complex (first decomposition step).](https://www.orientjchem.org/wp-content/uploads/2016/05/Vol32_No2__Pan_W.-H_Fig1-150x150.jpg) |
Figure 1: Linearization curves of [Cd(PNZ)2(H2O)2]H2O complex (first decomposition step). Click here to View figure |
![Fig. 2: Linearization curves of [Hg(PNZ)(H2O)Cl]H2O complex (first decomposition step).](https://www.orientjchem.org/wp-content/uploads/2016/05/Vol32_No2__Pan_W.-H_Fig2-150x150.jpg) |
Figure 2: Linearization curves of [Hg(PNZ)(H2O)Cl]H2O complex (first decomposition step). Click here to View figure |
Physical Measurements
The electronic absorption spectra were obtained by 10-5 M DMF solution in 1 cm quartz cell using Shimadzu-1601PC UV-Visible automatic recording spectro-photometer. The CHNS elemental analysis was estimated using Thermo Flasha Eager 300. The infrared spectra were analyzed (KBr disc) in the 400-4000 cm-1 range using perkin Elmer 1650 FT-IR instrument. TGA were obtained using a Shimazdu DTG – 60H in a dynamic air atmosphere (30 cm min-1) at a heating rate of 10 °C min-1. Conductivity of the dissolved complexes were carried out at room temperature on freshly prepared 10-3 M DMF solutions using Jenco Model 1671 Dual Display Bench Top instrument pH/ORP (redox)/conductive. Magnetic susceptibility measurements were carried out using the modified Gouy method [6] on MSB-MK1 balance at room temperature using mercury(II) tetrathiocyanatecobaltate(II). The effective magnetic moment μeff, per metal atom was calculated from the expression μeff=2.83√x.T B.M., where x is the molar susceptibility corrected using Pascal’s constant for the diamagnetism of all atoms in the complexes. Mass spectra were done by AMD Intectra Gmb HDP10. Data system EI/8 Kv spectrometer.
Kinetic Parameters
In order to assess the influence of the structural properties of the ligand and the type of metal on thermal behavior of the complexes, the order n and the heat of activation E at the various decomposition stages were determined from TGA and DTG thermograms using the Coats-Redfern equations in the following form [7].
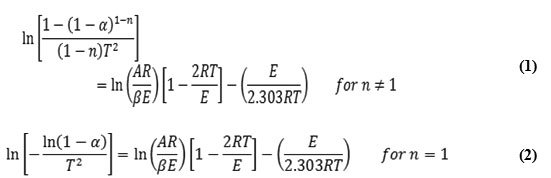
Where: α is fraction of weight loss, T is temperature (K) ,n is order of reaction, A is pre-exponential factor, R is molar gas constant, Ea is activation energy, β is heating rate.
The correlation factor r is computed using the least squares method for equations (1) and (2). Linear curves were drawn for values equal 0.5, 1, 1.5, 2, 2.5 and 3. The value of n which gave the best linear plot was chosen as the order parameter for the decomposition stage of interest and the heat of activation was calculated from its slope [8,9].
The activation entropy ΔS, the activation enthalpy ΔH and the free energy of activation ΔG were calculated using the following equations:
K and h are the Boltzman’s and Plank’s constants.
DNA Interaction
All the experiments involving the binding of complexes with CT-DNA were carried out in a double distilled water and adjusted to pH 7.2. Absorption titration experiments were performed with fixed concentrations of the compounds (1×10⁻⁴ molL-1) with varying concentration of DNA (0–60 μM). While measuring the absorption spectra, an equal amount of DNA was added to both the test solution and the reference solution to eliminate the absorbance of DNA itself. The values of the intrinsic binding constants Kb were calculated by regression analysis using the equation [10].
![]()
where [DNA] is the concentration of CT-DNA in base pairs and εa, εf and εb are extinction coefficients of the apparent, free and bound metal complex, respectively and Kb is the equilibrium binding constant. In the plots of [DNA]/(εa– εf) versus [DNA], Kb is given by the ratio of slope to the intercept.
![Fig.3: Linearization curves of [Hg(PNZ)(H2O)Cl]H2O complex (second decomposition step).](https://www.orientjchem.org/wp-content/uploads/2016/05/Vol32_No2__Pan_W.-H_Fig3-150x150.jpg) |
Figure 3: Linearization curves of [Hg(PNZ)(H2O)Cl]H2O complex (second decomposition step). Click here to View figure |
![Figure 4: Linearization curves of [Hg(PNZ)(H2O)Cl]H2O complex (third decomposition step).](https://www.orientjchem.org/wp-content/uploads/2016/05/Vol32_No2__Pan_W.-H_Fig4-150x150.jpg) |
Figure 4: Linearization curves of [Hg(PNZ)(H2O)Cl]H2O complex (third decomposition step). Click here to View figure |
Potentiometric study
All materials employed in the present investigation were of A.R. grade products. [amino succinic acid] C4H7NO2 (Aspartic acid), [2-amino-propanoic acid] C3H7NO2 (Alanine), [2-amino-3-imidazole propanoic acid] C6H9N3O2 (Histidine), C4H9NO3 (Threonine), C3H7NSO2 (Cysteine), and C9H11NO2 (Phenylalanine), were purchased from Sigma-Aldrich Company and were used without purification. To account for preparation of metal ion amino acid solutions of exactly a 1:1 ratio, we also determined, by potentiometric pH titration, the molecular weight of these amino acids.
Results and Discussions
Elemental analysis
The elemental analysis of the solid complexes of pantoprazole are recorded in Table (1). It is clear that the formula of the Hg2+ and Zn2+ complexes may be represented as [M(PNZ)(H2O)Cl]H2O, while for Cd2+ complex represented as [Cd(PNZ)2(H2O)2]H2O.
Table 1: Analytical data and magnetic moments of the PNZ and its complexes
|
Compound |
Chemical formula |
% Found (Calcd.) |
meff.(298°K) (B.M) |
|||||
|
C |
H |
N |
S |
M |
||||
|
PNZ |
C16H14F2N3O4S.Na.1.5H2O |
43.2 (44.4) |
3.0 (3.24) |
9.4 (9.7) |
6.5 (7.4) |
________ |
||
|
Zn-PNZ |
[Zn(PNZ)(H2O)Cl]H2O |
36.3 (36.97) |
3.2 (3.47) |
8 (8.08) |
5.8 (6.16) |
12.1 (12.5) |
Diamagnetic |
|
|
Cd-PNZ |
[Cd(PNZ)2(H2O)2]H2O |
40.7 (41.24) |
3.4 (3.65) |
8.9 (9.02) |
6.5 (6.87) |
11.8 (12.07) |
Diamagnetic |
|
|
Hg-PNZ |
[Hg(PNZ)(H2O)Cl]H2O |
28.5 (29.34) |
2.6 (2.75) |
6.1 (6.42) |
4.5 (4.89) |
29.9 (30.65) |
Diamagnetic |
|
Molar conductivity measurements
The complexes were dissolved in DMF and the molar conductivities of 10−3 M of their solutions at 25±2 °C were measured. Table (2) shows the molar conductance values of the complexes. It is concluded from the results that the complexes are found to have molar conductance values of 6–18.8 Ω-1 cm2 mol-1 indicating that these complexes are non-electrolytes. It, also, indicate the bonding of the chloride anion to the metal ions.
Table 2: Physical data of the PNZ ligand and its complexes
|
Compound |
Chemical formula |
M. Wt |
% Yield |
Color |
ʌm (Ω-1cm2mol-1) |
Melting Point (°C ) |
|
PNZ |
C16H14F2N3O4S.Na.1.5H2O |
432.38 |
82 |
Off white |
— |
137 |
|
Zn-PNZ |
[Zn(PNZ)(H2O)Cl]H2O |
519.26 |
70 |
Off white |
6 |
170 |
|
Cd-PNZ |
[Cd(PNZ)2(H2O)2]H2O |
931.16 |
73 |
Faint brown |
5.4 |
160 |
|
Hg-PNZ |
[Hg(PNZ)(H2O)Cl]H2O |
654.47 |
62 |
Faint red |
7 |
155 |
Electronic spectra measurements and magnetic susceptibility
The UV-Visible spectra of the ligand and its complexes were recorded in DMF at room temperature. The electronic spectrum of ligand showed only one intense band at 34246 cm-1, which was assigned to n→π* transition of the C=N chromophore. The complexes of Zn(II), Hg(II) and Cd(II) is diamagnetic and have only one peak in the UV region. According to the empirical formula, Cd(II) complex has an octahedral geometry while both Zn(II) and Hg(II) have tetrahedral geometry.
![Fig. 5: Linearization curves of [Zn(PNZ)(H2O)Cl]H2O complex (first decomposition step).](https://www.orientjchem.org/wp-content/uploads/2016/05/Vol32_No2__Pan_W.-H_Fig5-150x150.jpg) |
Figure 5: Linearization curves of [Zn(PNZ)(H2O)Cl]H2O complex (first decomposition step). Click here to View figure |
![Fig.6: Linearization curves of [Zn(PNZ)(H2O)Cl]H2O complex (second decomposition step)](https://www.orientjchem.org/wp-content/uploads/2016/05/Vol32_No2__Pan_W.-H_Fig6-150x150.jpg) |
Figure 6: Linearization curves of [Zn(PNZ)(H2O)Cl]H2O complex (second decomposition step) Click here to View figure |
IR spectra and mode of bonding
IR spectra for the ligand and its complexes shown in Table (3). In the free ligand, the band at 1373 cm−1 is assigned to υ (C-N). After complexation, this band is shifted to higher frequency in the three complexes. Shifting of the υ(C-N) vibration is due to C-N → M coordination [11]. Characteristic band at 3498 cm−1 is assigned to presence of water in the ligand structure; similarly presence of coordinated water is confirmed by the presence of band at 3372-3440 cm−1 [12]. Coordinated water molecule is also noticed as a weak band at 815-820 cm−1 due to rocking mode while band at 450-630 cm−1 indicated the presence of water of crystallization [13]. In addition, IR spectrum of the ligand revealed a sharp band at 1035 cm−1 due to υ(S=O) of side chain, which is shifted to higher frequency after complexation in all complexes, suggesting that oxygen atom of the side chain also contributes to the complexation. New bands appeared in the spectra of the complexes at 633-733 cm−1, corresponding to O →M and 410-540 cm−1 due to the N →M vibrations which support the involvement of N and O atoms in complexation with metal ions under investigation [14].Characteristic strong band at 1486 cm−1 is assignable to the stretching vibration of aromatic C=N group in benzimidazole ring that remained unchanged after complexation which confirmed the non-coordination of this group[15]. Another band appear at the spectra of Hg(II) and Zn(II) complexes at 865-900 cm-1 due to Cl– vibration which support the involvement of Cl atom in complexation of these complexes. All this discussion indicates that the ligand is bidentate and coordinating via O, N atoms.
Table 3: IR spectral data of the PNZ and its complexes (cm-1)
|
Compd. |
OH (str) |
CH3 (str) |
C=C (str) |
C=N (str) |
C-N (str) |
CـC (str) |
CـO (str) |
CـF (str) |
S=O (str) |
OـH (bend) |
MـN |
MـO |
Water of crystallization (Rocking mode) |
|
Ligand |
3498 |
3376 (assym) 3190 (sym) |
1590 |
1486 |
1373 |
1298 |
1228 (assym) 1166 (sym) |
1116 |
1035 |
— |
— |
— |
— |
|
Zn-Complex |
3408 |
3088(assym) 2984(sym) |
1585 |
1484 |
1423 |
1299 |
1231(assym) 1172(sym) |
1119 |
1064 |
817 |
865 |
539 |
687 |
|
Cd-Complex |
3411 |
3095(assym) 2990(sym) |
1587 |
1490 |
1408 |
1303 |
1237(assym) 1171(sym) |
1121 |
1066 |
820 |
— |
410 |
683 |
|
Hg-Complex |
3440 |
3079(assym) 2946(sym) |
1619 |
1501 |
1437 |
1323 |
1264(assym) 1173(sym) |
1122 |
1077 |
817 |
930 |
532 |
712 |
Mass spectra
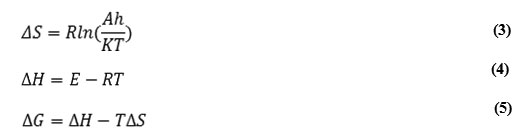
The mass spectral data shows did not show any of the required molecular ion peaks, but it could be deduced through studying of the assigned fragmentation peaks. All complexes have the same fragmentation, which have the main fragments [a], [b], [c], [d], [e], [f] at m/z= 180(4.5), 116(8.5), 90(10.2), 78(14), 50(50.3) and 64(36.2) (as fragments of ligand), which confirm the proposed structure of complexes. This was also confirmed by the appearance of a peak at 179.5(7.9), 127(2.8), 291.5(5.1) and 321(5.6) for fragments [g], [h], [i] and [j] respectively. The most prominent peaks were assigned as shown in the following fragmentation (Scheme.1).
 |
Scheme 1: Fragmentation pattern for PNZ-complexes |
Thermal analysis
The thermal behavior of the PNZ-Complexes were characterized using TGA/DTG method. The decomposition stages, temperature ranges and decomposition products as well as the found and calculated weight loss are given in Table (4). The activation energies and kinetic parameters were calculated using Coats-Redfern equation [7] and the values are given in Table (5).
Table 4: TGA and DTG data of the PNZ and its complexes
|
Compound |
Temp. range °C |
DTG °C |
Mass loss% |
Process |
Product |
Residue% and type |
|
|
Found |
Calcd. |
Found (Calcd.) |
|||||
|
[Zn(PNZ)(H2O)Cl]H2O |
117.96-321.99 322.96-425.49 426.41-506.41 506.9-797.41 |
228.53 410 491.64 603.34- 781.4 |
30.27 7.09 4.646 27.49 |
29.97 7.36 4.42 27.25 |
Dehydration+Coordination sphere partial decomposition Coordination sphere partial decomposition Ligand partial decomposition Ligand partial decomposition |
2H2O + Cl + 0.22 Ligand 0.1 Ligand 0.06 Ligand 0.37 Ligand |
Not complete |
|
[Cd(PNZ)2(H2O)2]H2O |
39.22-121.1 121.1-302.91 302.91-388.77 388.77-801.09 |
72 233.1 306.51 421.67 |
3.1 32.26 5.94 20.93 |
3.86 32.29 5.75 20.53 |
Dehydration+Coordination sphere partial decomposition Coordination sphere partial decomposition Ligand partial decomposition Ligand partial decomposition |
2H2O H2O + 0.42 Ligand 0.15 Ligand 0.43 Ligand |
Not complete |
|
[Hg(PNZ)(H2O)Cl]H2O |
35.36-256.77 256.77-398.45 398.45-680.02 |
38.24 228.06 347.78 588.44 |
33.56 31.45 33.814 |
33.1 31.55 33.57 |
Dehydration+Coordination sphere partial decomposition Coordination sphere partial decomposition Final decomposition |
2H2O + Cl 0.54 Ligand 0.05Ligand + Hg |
1.83 Carbon (1.75) |
Table 5: Kinetic parameters for the first decomposition step of the PNZ-complexes
|
Comp. |
Step |
E |
A |
n |
R |
ΔH |
ΔG |
ΔS |
|
[Zn(PNZ)(H2O)Cl]H2O |
1 |
324.2186 |
1.03E+16 |
3 |
0.9977 |
320.0488 |
291.3221 |
57.2781 |
|
2 |
92.07861 |
3432.793 |
1.5 |
0.8861 |
83.31232 |
281.2472 |
-187.723 |
|
|
[Cd(PNZ)2(H2O)2]H2O |
1 |
48.86083 |
859168.6 |
1.5 |
0.9717 |
44.65311 |
113.3337 |
-135.706 |
|
[Hg(PNZ)(H2O)Cl]H2O |
1 |
61.81923 |
3828334 |
1 |
0.9772 |
57.65342 |
119.3837 |
-123.199 |
|
2 |
26.67542 |
36056564 |
1 |
0.9651 |
21.51425 |
87.52501 |
-106.335 |
|
|
3 |
189.056 |
57501102 |
3 |
0.9273 |
181.894 |
272.4992 |
-105.179 |
E, ΔH, ΔG in KJ.mol-1
ΔS in J.mol-1.k-1
A in S-1
Cadmium complex undergo decomposition in four steps. Dehydration of the complex takes place in the 39-121 °C range with DTG peak at 72 °C associated with weight loss of 3.1 % (Calcd. 3.86 %). Coordination sphere decomposition for the cadmium complex is concerning with the elimination of the coordinated water and partial decomposition of the ligand. It takes place with DTG maxima at 233 °C in the 120.4-302.9 °C range. The ligand is continued to decompose at maxima 306.5 and 421.7 °C in the range of 302.9-388.7 and 388.7-801 °C, respectively with no definite final product since the decomposition process is not complete at 800 °C.
TGA/DTG curves of the mercury complex are characterized by three decomposition steps. The first step takes place in the 35.4-256.7 °C range with DTG peaks at 38.2 and 228°C. Observed mass loss is 33.6 % against calculated one of 33.1% corresponding evolution of crystallization water, coordinated water, chloride ion and partial decomposition of the ligand. The ligand is continued to decompose at 256.7 °C and end with final decomposition at 398.4 °C. The final decomposition is attributed to the evaporation of Hg metal with weight loss of 33.8 % against calculated one of 33.6 %. Carbon is remained as final product.
Thermal decomposition of zinc complex takes place in four stages. The first stage starts at 117.9-321.9 °C range. This was accompanied with mass loss of 30.3 % (Calcd. 29.9%) with maximum DTG at 228.5 °C, which attributed to the volatilization of the hydrated water, coordinated water, chloride ion and partial decomposition of the ligand. The second decomposition stage takes place in the 322.9-425.5 °C range with maxima at 410 °C, which correspond decomposition of ligand. The third decomposition stage takes place at 426.4-506.4 °C range with maximum DTG at 491.6 °C which attributed to further decomposition of ligand with mass loss of 4.6 % (Calcd. 4.4 %). The final decomposition stage occurs in the range 506.9-797 °C with maxima at 603 and 781 °C with no definite final product since the decomposition process is not complete at 800 °C.
From the TGA curves, the order n, activation energy E, and pre-exponential factor A of the different thermal decomposition steps of the complexes have been elucidated by the method of Coats-Redfern [7]. Some examples of the linearization curves for the complexes, which were obtained, are presented in Figs. (1-6). The values of correlation coefficients of linearization curves of the complexes and their reaction orders are given in Table (5).The activation energy E and enthalpy of activation ΔH of the three complexes are expected to increase proportional to decrease in their radii [14]. The activation energy of the tetrahedral [Zn(PNZ)(H2O)Cl]H2O complex is larger than [Hg(PNZ)(H2O)Cl]H2O complex.
The shorter the radius of metal ion, the easier the ligand approaches the central atom. As a result, metal-ligand interaction becomes stronger, the detachment of the link becomes more difficult and E values increase [15,16]. The negative values of the entropies in the decomposition reactions of the complexes Table (5) indicate that the reactions are slower than normal[17-19] and the activated complexes have more ordered structure than the reactants[20,21].
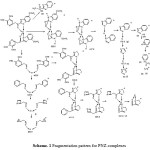
Based on the above analytical data and physicochemical properties, the following structures are proposed in which the metal ion is coordinated through C-N, sulphonyl groups S=O, the coordinated water and the coordinated anion.
 |
Scheme 2: Complexes of Cd-PNZ, Hg-PNZ and Zn-PNZ |
DNA Interaction
UV-Vis Absorption spectra (Figs. 7,8) were obtained by titration of (1×10⁻⁵ – 1×10⁻⁴ M) complex solution with increasing concentration of DNA. In absence of DNA, the spectrum is characterized by a peak at 293 nm. The absorbance of the peak increased gradually as DNA concentration increased.
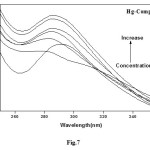 |
Figure 7: Effect of concentration of DNA on the absorption band at λ = 293 nm (Hg-Complex = 1×10⁻⁴ molL-1) Click here to View figure |
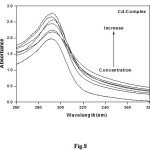 |
Figure 8: Effect of concentration of DNA on the absorption band at λ = 293 nm (Cd-Complex = 1×10⁻⁴ molL-1) Click here to View figure |
The spectral changes reflect the corresponding changes in DNA in its conformation and structures after the drug bound to DNA. Intercalative mode of binding usually results in hypochromism and bathochromism due to strong stacking interaction between an aromatic chromophore and the base pairs of DNA. On the other hand, metal complexes which non-intercalatively or electrostatically bind with DNA may result in hyperchromism and hypsochromism. The absorption spectra show clearly that the addition of DNA to the complexes lead to strong hyperchromism accompanied by the slight hypsochromismto the [DNA]/[complex] (Fig. 9).
![Fig. 9: Plot of [DNA]/(εa−εf) versus [DNA]](https://www.orientjchem.org/wp-content/uploads/2016/05/Vol32_No2__Pan_W.-H_Fig9-150x150.jpg) |
Figure 9: Plot of [DNA]/(εa−εf) versus [DNA] Click here to View figure |
Obviously, these spectral characteristics suggest that all the complexes interact with DNA via electrostatically with the base pairs of DNA[22].
In order to evaluate quantitatively the DNA-binding strength, the intrinsic DNA-binding constant, Kb of the complexes has been estimated to be in the range [0.121– 0.382 M-1] and is listed in the Table (6).
Table 6: The Binding constant of complexes with DNA
|
SD |
R |
Binding constant (Kb) |
Complex |
|
0.1904 |
0.9596 |
0.121 |
Hg-PNZ |
|
0.0769 |
0.9685 |
0.137 |
Cd-PNZ |
pH-metric Measurements
The formation of various 1:1:1 ternary complex species are inferred from the Potentiometric-pH titration curves. Initial estimates of the stability constants of the resulting species and the acid dissociation constants of pantoprazole, and amino acids have been refined with the HYPERQUAD computer program [23]. The quality of the fit during this refinement was judged by the values of the sample standard deviations and the goodness of fit χ 2 (Pearson’s Test). At σE = 0.1 mV (0.001 Ph error) and σV = 0.005 cm3, the values of S in different sets of titrations were between 1.0 and 1.7 and χ 2 was between 12.0 and 13.0. The scatter of residuals (Eobs-Ecalc) versus pH reasonably random, without any significant systematic trends, thus indicating a good fit of the experimental data of the expected model systems under our experimental conditions. Furthermore, the formation constants values of the different 1:1 metal ion- amino acids have been determined under identical conditions. This is made with the aim to compare the stability of the formed 1:1:1 ternary complex with of the corresponding 1:1 binary metal complexes.
All the initial estimates of the formation constants of the different binary and ternary complexes formed in the present investigation have been refined using HYPERQUAD computer program.
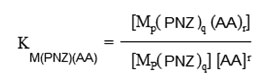
Which refers to the addition of amino acids to the binary complex MP(PNZ)q. The overall complexation reaction involving protonation is,
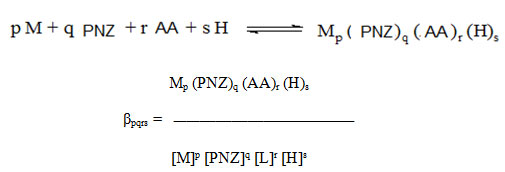
Which, AA = amino acids, PNZ = Pantoprazole, M = Cd(II), Zn(II).
The data points collected in the pH range 3.0-11.0 were used for the calculations and refinements. The formation constants of all the binary and the ternary complexes studied are given in Tables (7,8).
The pH metric titration curves in case of PNZ ligand before the acid curve indicating that in acidic solutions each molecule of the ligand is in association with one equivalent of proton. This proton should be attached with the lone pair of electrons present on the nitrogen of the ring in the case of PNZ. PNZ show one step acid dissociation due to deprotonation of one secondary amine group.
LH ↔ L– + H+
Representative set of experimental titration curves, obtained according to the sequence for different M-PNZ reveals that below pH 7.5 formation of different M-PNZ binary complexes take place. This is clear from the appeared divergence of each of the 1:1 binary M-PNZ titration curve from that of the corresponding free PNZ curve. Binary complexes are stable up to pH 5-8 in case of different metal ions. Hydrolysis of the complexes leads to the formation of hydroxo-complex species. The nature of the pH titration curves indicates that stepwise complex formation take place through deprotonation of secondary amine group. The acid dissociation constant value are for pantoprazole (pKa = 6.2±0.02)[5]. The acid dissociation constant values for amino acids are in good agreement with those found in the literature[24].
Of the 20 α-amino acids that commonly occur in proteins; about half contain side chain donor atoms that are at least potentially capable of forming a chelate ring with metal ion bound at the α-amino nitrogen. If the α-amino and α-carboxylate groups that occur in the free amino acids also chelate the metal ion, then two chelate rings will be formed.
The order of stability constants of M + PNZ + Alanine is Cd > Zn.
Phenylalanine, as its name indicates, contains a phenyl ring attached in place of one of the hydrogen of alanine. The order of stability constants of M + PNZ + Phenylalanine is Zn > Cd.
Aspartic acid contains two acidic side chains. This amino acid is often called aspirate to emphasize that its side chain is usually negatively charged at physiological pH. The order of stability constants of M + PNZ + Aspartic acid is Cd > Zn .
Table 7: Formation constants for the binary M + amino acids (AA) and M-PNZ ligand complexes at 25 ± 0.1oC and I = 0.1 mol.L-1 KNO3
|
LogM(PNZ) |
logM(Cys) |
LogM(His) |
logM(Thr) |
LogM(Asp) |
logM(Phe) |
logM(Ala) |
Metal Ions |
|
6.21± 0.03 |
8.89± 0.02 |
3.98± 0.04 |
4.16± 0.02 |
5.86± 0.02 |
4.11± 0.03 |
4.12± 0.02 |
Cd (II) |
|
7.15± 0.02 |
8.45± 0.03 |
4.94± 0.02 |
4.9± 0.02 |
6.97± 0.02 |
4.96± 0.02 |
5.81± 0.02 |
Zn (II) |
± refers to three times standard deviation
The amino acid histidine in its dicationic form contains four acidic protons. As the pH increased the successive pKa values for potone removal are carboxylic acid imidazolium. –N(3)-H, side chain ammonium imidazole –N(1)-H. The imidazole (1)-NH is very weakly acidic (pKa = 14.4) and thus it does not dissociate in the measureable pH range. It has been argued strongly that metal ion binding on the aromatic imidazole ring occurs only at pyridine nitrogen, as the energy required for binding to occur at a pyrrole nitrogen is prohibitive [25]. The order of stability constants of M + PNZ + Histidine is Zn > Cd.
Threonine contains aliphatic hydroxyl group. It can be thought of as hydroxylated version of valine with hydroxyl group in place of one of the valine methyl groups. The hydroxyl groups of threonine make them much more hydrophilic and reactive than valine [26]. As the alcoholic hydroxy group is so weakly acidic (pKa> 14) that is does not undergo dissociation. The order of stability constants of M + PNZ + Threonine is Zn > Cd.
Table 8: Formation Constants for M + Pantoprazole (PNZ) + Amino Acids (AA) 1:1:1 Ternary Complexes at 25.0 ± 0.1oC and I = 0.1 mol.L-1
|
logM(Cys)(PNZ) |
LogM(His)(PNZ) |
logM(Thr)(PNZ) |
LogM(Asp)(PNZ) |
logM(Phe)(PNZ) |
logM(Ala)(PNZ) |
Metal ion |
|
19.58b± 0.02 |
1.56a± 0.02 |
1.96a± 0.02 |
19.11b± 0.02 |
2.18a± 0.02 |
15.47b± 0.02 |
Cd (II) |
|
18.29b± 0.03 |
2.89a± 0.02 |
3.91a± 0.02 |
17.83b± 0.03 |
3.59a± 0.02 |
3.91a± 0.02 |
Zn (II) |
Cystein contains three dissociable protons, the last two of these deprotonations, those of the ammonium and the thiol groups take place in overlapping processes. Cystein is typical ambidentate ligand, the possible metal binding sites are different in nature. COO– is rather hard, S– is fairly soft and NH2 is borderline. The -SH and -NH3+ groups have relatively high pKa values, and the sulfur atoms behaves as bridging ligands. Thus a great variety of metal complexes may be formed, including protonated and polynuclear complexes with monodentate and different bidentate and tridentate bonding modes. The order of stability constants of M + PNZ + Cystein is Cd > Zn.
The observed different orders may be attributed to different types of interactions depending on metal ion different geometrical behavior during the formation of binary and ternary complexes in solution.
Conclusion
From elemental analysis it can be concluded that the formula of the Zn2+ and Hg2+complexes can be represented as [M(PNZ)(H2O)Cl]H2O,while Cd2+ represented as [Cd(PNZ)2(H2O)2]H2O, the molar conductance for the complexes were measured in DMF and showed that PNZ-complexes are non-electrolytes. From magnetic susceptibility and UV spectroscopy it’s found that Zn-PNZ, Cd-PNZ and Hg-PNZ complexes are diamagnetic where Zn and Hg have tetrahedral geometry, while Cd have octahedral geometry. IR spectra for ligand and its complexes showed that the pantoprazole act as bidentate ligand which form complexes with metals through C-N and S=O groups, also the spectra showed new peaks due to M-N and M-O which confirmed the involvement of N and O atoms in complexation with metal ions. The mass spectral data showed that three complexes formed with molar ratio M:L = 1:2. Thermal analysis showed the different decomposition stage of the metal complexes, which appear the presence of water of hydration in all complexes. The activation energy E and enthalpy of activation ΔH of the complexes are expected to increase proportional to decrease in their radii.
References
- Yogita, B.; Om, S. Bioorg. Med. Chem.1995, 20, 6208–6236.
- Suman, M.; Supriya, D.; Bharti, J. RJPBCS 2010, 1, 394-400.
- Mohamed; G. G.; Ibrahim, N. A.; Attia, H. A. Spec. chim. Acta A 2009, 72, 610–615.
CrossRef - Tiwari, C. R. Search Res. 2011, 3, 24-28.
- Tiwari, C. R. JERAD 2012, 6, No. 3A.
- Figgis, B. N.; Lewis, J.: in Lewis, J.; Wilkins, R. G. (Eds.) 1960 Magnetochemistry of complex compounds in Modern Coordination chemistry, Interscience, New York.
- Coats, A.W.; Redfern, J. P. Nature 1964, 68, 201.
- Cotton, F. A.; Wilkinson, G.; Murillo, C. A.; Bochmann, M. Advanced Inorganic Chemistry, Sixth Ed. 1999 Wiley, New York.
- Koley M. K.; Sivasubramanian S. C.; Varghese B.; Manoharan P. T.; Koley A. P. Inorg. Chim. Acta 2008, 361, 1485.
CrossRef - Wolfe A.; Shimer G. H.; Meehan T. Biochem. 1987, 26, 6392.
CrossRef - Mohamed, G. G.; El-Gamel, N. E. A.; Nour El-Dien, F. A. Synth. React. Inorg. Met.-Org. Chem. 2001, 31, 347.
CrossRef - Kohout, J.; Hvastijova, M.; Kozisek, J.; Diaz, J. G.; Valko, M.; Jager, L.; Svoboda, I. Inorg. Chim. Acta 1999, 287, 186.
CrossRef - Uçan, S.Y.; Uçan, M.; Mercimek, B. Synth. React. Inorg. Met.-Org. Chem. 2005, 35, 417-421.\
CrossRef - Sari, N.; Gurkan, P.; Arslan, S. Transit. Met. Chem. 2003, 28, 468-474.
CrossRef - Shyamala, B. S.; Lakshmi, P. V. A.; Raju, V. J. J. Sci. Res. 2010, 2, 525–537.
- Silverstein, R. M.; Webster F. X. Spectrometric identification of organic compounds 2007 Wiley interscience, India, Delhi, 102.
- Sallam S. A. Trans. Met. Chem. 2006, 31, 46.
CrossRef - Sangari, H. S.; Sodhi, S. Thermo Chim. Acta 1990, 171, 49.
CrossRef - Styczen, E.; Warnke, Z.; Wyrzykowski, D. Thermo Chim. Acta 2007, 454, 84.
CrossRef - Indria, V.; Parameswaran, G. J. Therm. Anal. 1993, 39, 1417.
- Frost, A. A.; Pearson, R. G. Kinetics and Mechanicsm 1961, Wiley interscience, New York.
- Nagababu, P.; Naveena, J.; Latha, L.; Prashanthi, Y.; Satyanarayana, S. J. Chem. Pharm. Res. 2009, 1, 238.
- Gans, P.; Vacca, A. J. Talanta 1996, 43, 1739.
CrossRef - Martell, A. E; Smith, R. M. Critical Stability Constants 1975, vol. 1and 2, Plenum Press, New York.
- Sundberg, R. J.; Martin, R. S. Chem. Rev. 1974, 74, 471.
CrossRef - Berg, J. M.; Tymoczko, J. L.; Stryer, L. The Molecular Design of Life-Protein Structure and Function 2003, Biochemistry, Fifth Edition.


![]()


