The study of inorganic ion composition and chemical properties of rain water over Tehran city
Dina Abdemanafi1*, Amir-Hussain Meshkatee2, Sohrab Hajjam2 and Majid Vazifedoust3
1Department of Meteorology, College of Basic Sciences, Tehran Science and Research Branch, Islamic Azad University, Tehran, Iran. 2Department of Meteorology, College of Basic Sciences, Tehran Science and Research Branch, Islamic Azad University, Tehran, Iran. 3Water Engineering Department, faculty of agricultural sciences, University of Guilan, Iran. Corresponding Author Email: d.abdemanafi@srbiau.ac.ir
DOI : http://dx.doi.org/10.13005/ojc/320141
Article Received on :
Article Accepted on :
Article Published : 29 Feb 2016
Concentrations of major inorganic ions( ), PH,Total Dissolved Solids (TDS), Electrical Conductivity (EC), Total Alkalinity and Total Hardness in bulk precipitation samples collected in the Tehrancity of I.R. of Iran were analyzed.Results show that concentrations of the found substances were higher over the Mehra bad station. The mean concentration of ions indicated that, , and were the main anions, while Ca2+,Na+,NH4, and Mg2+ were the maincations.Measured PH had shown that autumn and winter precipitation were mostly acidic while the spring and summer were mostly alkaline. The pH ranged from 4.6 to 8.1 with a mean of 6.3.The alkaline cations and also Bicarbonate anion acted as acid neutralizers and buffered the acidity of rain. The Bicarbonate anion had the highest concentration, among all other ions, over both stations and plays an important role in reduction of the acidity of the rain water.Study upon the potential sources of the ions over Tehran by means of Correlation Analysis, Enrichment Factor and Principle Component Analysis indicate that existence of Qom salt lake and desert in the south of the city were the main source of the and . There are anthropogenic sources for . The other ions were from anthropogenic and dust origin.
KEYWORDS:Air pollution; Precipitation; Scavenging; Source assessment; chemistry
Download this article as:| Copy the following to cite this article: Abdemanafi D, Meshkatee A. H, Hajjam S, Vazifedoust M. The study of inorganic ion composition and chemical properties of rain water over Tehran city. Orient J Chem 2016;32(1). |
| Copy the following to cite this URL: Abdemanafi D, Meshkatee A. H, Hajjam S, Vazifedoust M. The study of inorganic ion composition and chemical properties of rain water over Tehran city. Orient J Chem 2016;32(1). Available from: http://www.orientjchem.org/?p=14330 |
Introduction
Precipitation is one of the most efficient mechanisms for washing the atmospheric pollutants, specifically particulate ones out.The process has two very important consequences (one good and one bad). The good one is that it clears atmosphere from many substances that have adverse impacts on many aspects of life whereas the bad one is that their reaction with rain water leads to the formation of some dangerous and destructive substances that have great impacts on both,the natural environment as well as man made constructions.Precipitation chemistry plays an important role in understanding the air quality in a study area, because the concentrations and distribution of chemical components in rain depend on a variety of emission sources.
Realizing that, a lot of effort has been made in order to identify the nature and type of those particulates, especially in urban environment ([1]; [2]; [3]; [4]; [5]; [6]; [7]; [8]; [9]; [10];[11];[12]). Study upon the atmospheric pollutants and their nature in Tehran atmosphere goes back to 1991, when Is maeili Sari [2], initially attempted to identify the nature of atmospheric pollutants over Tehran by sampling rain waters from synoptic and climatology stations (also, he did the same research for one station in Tehran [3].The results for two researches have shown and also compared with present study in the section of results and discussion.
The city of Tehran (figure 1), the capital of I. R. of Iran is a mega-polis with more than 10 million population.The growth of the city during the last 30 years has turned the city to one of the most polluted cities in the country particularly during the autumn and winter.The geographical conditions of the city are the other most important factor affecting the city environmental condition and the nature of the particles that may be found in its atmosphere. The city long term annual average precipitation is 300 mm. It receives its precipitation mainly during autumn, winter (the most polluted period of the year) and spring. Consequently, understanding the impact of matter and substances that enter into the Tehran atmosphere on the precipitation is very important. Tehran is located in the south foot of central part of Alborz mountain range, where the height range varies between 2000 and 4000 m above mean sea level. Tehran is one of the industrialized cities of the country. Factories and industrial units are mainly located in southwest and east of the city. Tehran is also located in northern outskirt of Iran central desert. There is a salt lake in the south of the city called Qom salt lake that is the end rout of some main streams in the central part of the Alborz mountain range. Due to the impact of the climate change, dam construction on those rivers and extensive water usage, the lake is almost dry for a substantial proportion of the year. The city, also, ends to a plain on its northeastern part. Tehran rainy season starts at the middle of the autumn and ends in the middle of the spring. This does not mean there is no precipitation occurrence during other parts of the year, but if it rains it will not be that significant and it is mostly a trace.
Despite the fast city growth and significant increase in the number of the motor vehicles since those studies, no other study has been done to examine the impact of these two factors on the nature and concentration of the atmospheric pollutants over the city.This study aimed to provide a detailed evaluation of the chemical composition of precipitation in the Tehran and to evaluate the relative contributions of various sources.
Data and Methodology
Sampling Sites and Sample Analysis
In this article, two Mehrabad and Aghdasiyeh synoptic stations were selected for rain water sampling. Aghdasiyeh synoptic station started to work in 1988 andis located in the northeast of Tehran, the area with highest annual average of precipitation among other areas of the city. According to Iranian Meteorological Organization records, the annual average of precipitation in this area is 420mm. Mehrabad synoptic station is the oldest meteorological station of the city that started to work in 1951 and is located in Mehrabad airport at the west of Tehran. Considering the distribution of the industrial units and factories, buildup areas, aerial and ground traffics and transportations, local daily atmospheric circulation, and the geographical location of the station, it could be claimed that the station is prone to substantial periods of air pollution from both natural and anthropogenic sources. The annual average of precipitation over this station is 231mm. Figure1 and table 1, gives information about the geographical location of the two stations relative to the city.
Rain water samples were collected manually. The rain water collectors were located at 1.5m height above the roof of the two stations’ buildings. To avoid any unwanted contamination of collected samples all bottles were washed with washing liquid, then strained six times by distilled water and finally drained byde-ionized water with electrical conductivity of less than 1.5μs/cm.Each sampling started at the time of the onset of each rainfall event. Then, the collected water transferred to glass bottles and was sent to the laboratory in less than 24 hours. The samples were kept in temperatures ranging from 2 to 40C during transfer to the laboratory. Sampling was taken place in autumn, winter and spring in the year of 2012 and 2013 as well as summer and autumn in the year of 2015. In total, 30 samples from the two stations were sent to laboratory for carrying out the analysis.
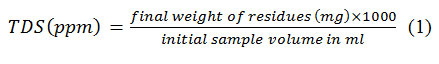
Samples anions and cations were measured by the Ion Chromatograph model 850 from Metrohm-Company and their pH and EC (inμs/cm) were measured by Multi-HQ40d. Bicarbonate and carbonate anions were calculated relative to methyl orange. TDS was calculated from the equation below (1):
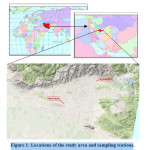 |
Figure 1: Locations of the study area and sampling stations. Click here to View figure |
Table 1: Characteristics of sampling stations in the Tehran.
| Station Name | Latitude | Longitude | Elevation(M) | Description |
| Mehrabad | 350 41′ | 510 19′ | 1190.8 | Urban(airport) |
| Aghdasieh | 350 47′ | 510 37′ | 1548.2 | Urban |
Source assessment
In this article, Enrichment Factors, Correlation Analysis and Principal Component Analysis had been used in order to identify the sources of ions found in sampled rain waters.
Since the early 1970’s a factor called Enrichment Factor (EF) is being used to identify the source(s) of substances that are found in the atmosphere or water. Many authors used this factor to identify the source(s) of ions that had been found in the rain water ([13]; [14]; [15]; [16]; [17]; [9], [18]. Rahn (1975) [19] introduced equation(2) for calculating EF for rain water.
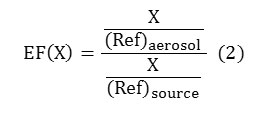
Where, X is the under study substances concentration and Ref stands for reference. Normally sodium is taken as reference aerosol for seawater and aluminium or calcium is taken as reference aerosol for land. Since there was not any aluminium among the identified substances in sampled rain water, calcium was used as reference aerosol. Equation3 and 4 were used for the calculation of EF’s for marine and land environments([10];[11]).
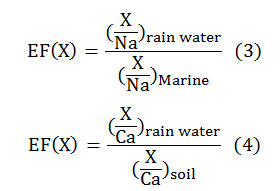
To calculate EF’s, denominators were adopted from Keene et al., (1986) [14] and Taylor (1964) [20] for marine and land environments, respectively.
If EF is near one it means the enrichment has happened by that source (sea or land). EFs higher than one indicate that the source(s) was somewhere else.
Another methods that had been used by some authors to identify the sources of ions found in sampled rain waters was Correlation Analysisand Principal Component Analysis which were both used in this paper ([21]; [10]; [22];[18]; [23]).
Results and Discussions
Physiochemical properties of rain water
Table 2 parts a and b show the volume-weighted mean, Volume-weighted standard deviation, minimum and maximum of PH, Total Alkalinity, EC, TDS andTotal Hardness for both the Aghdasieh and Mehrabad stations. Tocalculate volume-weighted averages and standard deviations formulas 5 and 6 were used ([24]; [21])
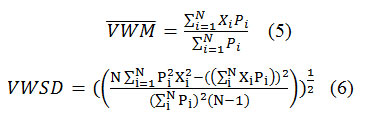
where Pi, Xi, and N are precipitation amount and entity concentration for ith sample and number of samples, respectively. Results show that in Aghdasieh the lowest measured pH was 4.72 and the highest was 7.95. The highest calculated Alkalinity was 33.58ppm. The same studies for Mehrabad indicate that the lowest and highest measured pH were 4.61 and 8.12, respectively. Again, the highest calculated Alkalinity was 40ppm. EC, TDS and Total Hardness were slightly higher at Mehrabad than Aghdasieh.They were 135μs/cm, 110ppm, and 57.95ppm in Aghdasieh and 195μs/cm, 130ppm, and 76.01ppm in Mehrabad, , respectively.
In figure 2, the mean ofpH, EC, TDS, Total Alkalinity and Total Hardness of rain water samples in different seasons of year and for both stations were shown. Results show that all of the values were the highest in spring and the lowest in winter.
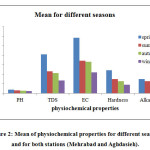 |
Figure 2: Mean of physiochemical properties for different seasons and for both stations (Mehrabad and Aghdasieh). Click here to View figure |
Major inorganicion
major Anions and Cations were found in the sampled rain waters. Tables 2a and b are showing the mean, max, min and standard deviation of inorganic major ions concentration. Volume-weighted mean and Volume-weighted standard deviation that are calculated from relations 5 and 6.The results indicate that concentration of all ions were higher in Mehrabad samples than Aghdasieh samples. At both sites, bicarbonate had the highest contribution in the total ion concentration by 35%. Sulfate, calcium and nitrate were the next high concentration contributors in the total concentration of ions by 22, 14 and 10 percents, respectively. Another interesting result of the examination of the chemical combination of sampled rain waters was the absence of carbonate among the found ions.
In figure 3, the mean of inorganic ion concentrations of rain water samples in different seasons of year and for both stations were shown. The results in figure (2) and (3), had shown that high concentrations of bicarbonate anion and calcium cation in rain water samples is probably the main cause of observed alkalinity during spring. The main source of those substances is gas and earth’s crust. According to Pruppacher and Klett (1997) [25] dusts are effective ice nuclease. However, they may effectively incorporate in the formation of rain droplets if sulfate aerosols sediment on them ([26]; [27]; [28]). This process may be considered possible, especially, in winter time, when the number of sources for sulfur dioxide emission increases significantly.Due to high concentrations of sulfate anion and calcium cation in the spring, this will prove that this is true.
Table 2: Mean,standard deviation, Min and Max of the ions’ concentrations, pH, EC, TDS, Total Hardness and Total Alkalinity in precipitation samples collected in Aghdasieh and Mehrabad.
|
Volume-weighted Std. Deviattion |
Max |
Min |
Volume-weighted mean |
Variable |
||||
|
Aghdasieh |
Mehrabad |
Aghdasieh |
Mehrabad |
Aghdasieh |
Mehrabad |
Aghdasieh |
Mehrabad |
|
|
6.41 |
12.62 |
33.58 |
40 |
10 |
8 |
21.99 |
24.25 |
|
|
0.81 |
1.05 |
3.24 |
3.096 |
0.02 |
0.029 |
0.28 |
0.5 |
|
|
2.5 |
0.1 |
8.12 |
0.197 |
0.08 |
0.11 |
1.24 |
0.07 |
|
|
1.93 |
3.43 |
7.54 |
10.79 |
0.33 |
0.193 |
1.69 |
3.28 |
|
|
0.62 |
0.718 |
2.23 |
2.104 |
0.02 |
0.1 |
0.31 |
0.55 |
|
|
4.1 |
6.37 |
17.99 |
19.209 |
1.06 |
1.13 |
5.18 |
7.54 |
|
|
6.95 |
13.75 |
27.15 |
37.667 |
0.24 |
0.15 |
10.02 |
14.70 |
|
|
1.84 |
2.69 |
6.56 |
8.608 |
0.38 |
0.23 |
2.8 |
2.85 |
|
|
1.03 |
1.12 |
3.18 |
4.951 |
0.27 |
1.57 |
1.33 |
3 |
|
|
5.21 |
8.47 |
20.89 |
25.068 |
2.42 |
1.28 |
9.42 |
9.64 |
|
|
1.39 |
1.77 |
5 |
6.02 |
0.4 |
0.18 |
1.85 |
1.94 |
|
|
0.86 |
1.37 |
2.84 |
3.504 |
0.13 |
0.13 |
0.75 |
1.52 |
|
|
0.98 |
11.55 |
7.95 |
8.12 |
4.72 |
4.61 |
6.35 |
6.33 |
PH |
|
25.94 |
52.40 |
135 |
195 |
35 |
30 |
68.96 |
91.48 |
EC |
|
21.18 |
36.37 |
110 |
130 |
21 |
19 |
46.25 |
60.87 |
TDS |
|
11.06 |
20.89 |
57.96 |
76.01 |
13.84 |
9.7 |
28.99 |
36.42 |
Total Hardness |
|
6.41 |
12.62 |
33.58 |
40 |
10 |
8 |
21.99 |
24.25 |
Total Alkalinity |
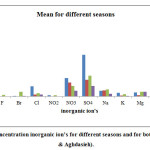 |
Figure 3: Mean of concentration inorganic ion’s for different seasons and for both stations (Mehrabad&Aghdasieh). Click here to View figure |
To investigatewhether there are some differences between this and the two other studies that had been made by Esmaeili Sari et al. in 1991 and 1997 ([2]; [3]) the results were compared (Figure 4-a &4-b).One of the most important results of this comparison is the observed trend of precipitation towards alkalinity since the study of Esmaeili Sari et al. (1991, 1997)([2]; [3]). Two reasons may be given for the observed trend. First, Esmaeili Sari et al. (1997) [3] study was carried out in the occasion of Iraq war on Kuwait and burning of the oil fields that emitted huge amount of sulfur dioxide in to atmosphere and second, is the impact of climate change that resulted in the longer dry period in Iran.The latter resulted in higher concentration of cations like calcium and magnesium and bicarbonate anion in the Tehran atmosphere due to more effective wind erosion of surface soils around Tehran as well as rise in the concentration observed for other anions and cations. Considering the main sources of those anions and cations their concentration increase could be attributed to the city population and area growth that inevitably led to a higher emission of particulate and gaseous pollutants into the city atmosphere.
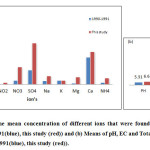 |
Figure 4: Compares (a) the mean concentration of different ions that were found in sampled rain waters in Aghdasieh station (1990-1991(blue), this study (red)) and (b) Means of pH, EC and Total alkalinity of rain water in Aghdasiyeh station (1990-1991(blue), this study (red)). Click here to View figure |
 
Acid Neutralization
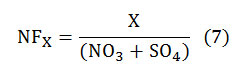
Acids are neutralized by bases such as NH3, anions (oxides, carbonates, or bicarbonates,etc.) and base cations like Ca+, Mg2+,K+,NH+4, etc Neutralization of the acids by these base cations was obtained by calculating the Neutralization Factor (NF) that had been introduced by Kulshrestha at al. in 1995 [4]:
Where, X is the cation concentration ([21]; [10]; [29]).The average neutralization effect of basic cations identified in the samples, i.e. Ca2+,Mg2+,K+ and Nh4+ for both sites are shown in Figure(5).Figure5 indicates that Calcium was the main neutralizer and Potassium’s role in neutralization was less than the other basic cations. Another conclusion that could be made is that because of the higher NF for all cations but Potassium at Aghdasieh, it could be expected that whenever taking a sample of rainfall in this site, it would be less acidic than samples collected in Mehrabad. The pH measurements also, confirm this result. The soil texture in the northeastern part of the city that is calcium reached, confirm the result, too (see http://www.ime.org.ir for more details).
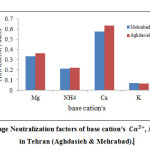 |
Figure 5: Average Neutralization factors of base cation’s , , in Tehran (Aghdasieh&Mehrabad). Click here to View figure |
Enrichment Factor
Results of the calculation of Enrichment Factor (EF)for SO24–, Ca2+, Mg2+, K+, Cl– by equation
3 and for SO24–, Mg2+, K+,Na+,NO3, Cl-by equation4 are presented in tables 3 and 4. According to the results, at both stations had roots in marine sources and magnesium came from both marine and land sources and the contribution from land sources were substantially higher than marine sources. The rest of EF’s calculated from both equations 3 and 4 are too high and indicate they are mainly from anthropogenic sources.
Table 3: Enrichment factors relative to seawater for rainwater constituents in Tehran (Aghdasieh and Mehrabad).
|
EF marine |
|||||||||||
|
132250 |
41.256 |
0.991 |
4.634 |
76.863 |
24.227 |
Mehrabad |
|||||
|
103500 |
38.896 |
0.879 |
3.814 |
72.431 |
21.361 |
Aghdasieh |
Table 4: Enrichment factors relative to soil for rainwater constituents in Tehran (Aghdasieh and Mehrabad).
|
EF soil |
|||||||||||
|
372.38 |
81.06 |
109.677 |
0.554 |
0.518 |
0.311 |
Mehrabad |
|||||
|
309.04 |
81.117 |
103.225 |
0.483 |
0.55 |
0.191 |
Aghdasieh |
Correlation Analysis
Another method that has been used by some authors to identify the sources of ions found in sampled rain waters was correlation analysis. The same procedure was followed in this study and the results are shown in Tables 5a and b. At Aghdasieh, the correlation coefficients range between 0.939 for nitrite and fluoride to 0.695 for pH and sulfate. Significant test of correlation coefficients showed that ions with anthropogenic origin are well correlated with each other. The same conclusions could be made for ions with natural origin. For example, the correlation coefficient between magnesium and bicarbonate is -0.823 in which all of them mainly come from natural sources.At Mehrabad station, again the highest observed significant correlation coefficient belongs to fluoride and nitrite by 0.909 and the lowest belongs to bicarbonate and pH by 0.718.
NH4F, NH4Cl,NH4NO3,NH4HSO4, NH4(SO2)NH4NO2 are common components of atmospheric aerosols ([30];[31]; [9]). All of them undergo reversible exchanges between gas and particle phase ([32]; [33]; [34]).The results of correlation analysis suggest that chemical reactions among emitted pollutants from both natural and anthropogenic sources resulted in the formation of secondary pollutants.Some of them like ammonium chloride and sodium nitrate are hygroscopic materials.The latter substances may also react with each other to produce NaCl, N2 and 2H2O in which the NaCl, is again an efficient hygroscopic substance. Solubility of chalk in acids may be regarded as the main reason for good observed correlation between calcium, sulfate and calcium, nitrate ions(CaCO3 + H2SO4 -> CaSO4 + H2O + CO2; CaCO3 + 2HNO3 –>Ca(NO3)2 + CO2 + H2O). Significant correlation between calcium and pH accompanied with the above results may be interpreted as the main role of calcium cation played in neutralization of acids in sampled rain waters. An astonishing result of the correlation study was its smallness between Na+ and Cl– for Aghdasieh samples and it’s relatively larger but negative value for Mehrabad samples. This result may be interpreted as an indicator that NaCl was not the main supplier of those cation and anion in sampled rain waters. Another interesting result is the observed high correlation between two sodium and potassium cations. Since both of them belong to the same group of substances in Mandeleev’s periodic table of elements and both are highly reactive and their main source is soil, interpreting the observed correlation is not that simple. However, highobserved correlation between potassium and sulfate at both stations and potassium and nitrate at Mehrabad may be related to the existence of crop fields around Tehran and use of the chemical fertilizers. The observed high and positive correlation between sulfate and PH in Aghdasieh station may be related to the soil structure in the northeastern part of Tehran which has a great amount of lime and calcium sulfate. The high but negative observed correlation between magnesium and bicarbonate in Aghdasieh may be designated to the reaction between two Mg 2+ and HCO3– which result in the formation of MgCO3.The other observed correlations among anions and cations are well in agreement with the results of other authors.
Table 5: Matrix of Pearson correlation coefficients for major ions and pH in (a)Aghdasieh, (b)Mehrabad stations.
(a)Aghdasieh
|
PH |
|||||||||||||
|
1 |
PH |
||||||||||||
|
1 |
0.056 |
||||||||||||
|
1 |
-0.532 |
0.104 |
|||||||||||
|
1 |
0.435 |
-0.361 |
0.577 |
||||||||||
|
1 |
0.182 |
0.105 |
0.637 |
-0.012 |
|||||||||
|
1 |
-0.148 |
0.959 |
0.939 |
-0.693 |
0.393 |
||||||||
|
1 |
-0.120 |
0.014 |
0.708 |
-0.112 |
0.122 |
0.431 |
|||||||
|
1 |
0.668 |
0.165 |
0.421 |
0.651 |
-0.127 |
-0.043 |
0.695 |
||||||
|
1 |
0.418 |
0.247 |
-0.2 |
0.767 |
-0.011 |
-0.303 |
0.487 |
0.241 |
|||||
|
1 |
-0.271 |
0.114 |
-0.131 |
0.696 |
-0.342 |
0.349 |
0.518 |
-0.823 |
0.022 |
||||
|
1 |
-0.587 |
0.359 |
0.640 |
0.729 |
-0.450 |
0.564 |
0.376 |
-0.338 |
0.575 |
0.432 |
|||
|
1 |
-0.225 |
0.617 |
0.5 |
0.285 |
-0.012 |
-0.007 |
0 |
-0.132 |
-0.106 |
-0.465 |
-0.266 |
||
|
1 |
0.522 |
0.177 |
0.375 |
0.443 |
0.799 |
0.488 |
0.271 |
-0.196 |
0.576 |
-0.078 |
-0.303 |
0.628 |
(b)Mehrabad
|
PH |
|||||||||||||
|
1 |
PH |
||||||||||||
|
1 |
0.718 |
||||||||||||
|
1 |
-0.15 |
0.06 |
|||||||||||
|
1 |
0.072 |
0.65 |
0.77 |
||||||||||
|
1 |
-0.44 |
-0.34 |
-0.44 |
-0.21 |
|||||||||
|
1 |
-0.48 |
0.36 |
0.90 |
0.365 |
0.185 |
||||||||
|
1 |
0.78 |
-0.57 |
0.75 |
0.5 |
0.22 |
0.45 |
|||||||
|
1 |
0.44 |
-0.003 |
-0.35 |
0.4 |
-0.3 |
0.083 |
0.46 |
||||||
|
1 |
0.79 |
0.419 |
0.162 |
-0.342 |
0.282 |
-0.123 |
0.282 |
0.055 |
|||||
|
1 |
0.26 |
0.07 |
0.66 |
0.84 |
-0.38 |
0.05 |
0.74 |
0.05 |
-0.11 |
||||
|
1 |
-0.16 |
0.14 |
0.55 |
0.51 |
0.02 |
-0.27 |
0.86 |
-0.22 |
0.86 |
0.87 |
|||
|
1 |
-0.2 |
0.52 |
0.76 |
0.68 |
0.18 |
0.13 |
0.24 |
-0.22 |
0.1 |
-0.22 |
-0.25 |
||
|
1 |
0.52 |
0.5 |
0.42 |
0.81 |
0.78 |
0.77 |
0.47 |
-0.71 |
0.67 |
0.16 |
0.67 |
0.44 |
Table 6: Varimax-rotated factor matrix of rainwater samples in Tehran (a) Aghdasieh station (b) Mehrabad station.
|
Communality |
Factor4 |
Factor3 |
Factor2 |
Factor1 |
|
|
0.953 |
0.4 |
0.7 |
0.20 |
0.50 |
PH |
|
0.907 |
0.04 |
0.77 |
0.54 |
0.09 |
|
|
0.981 |
0.24 |
0.10 |
0.95 |
0.03 |
|
|
0.903 |
0.01 |
0.06 |
0.32 |
0.89 |
|
|
0.537 |
-0.24 |
0.14 |
-0.36 |
-0.57 |
|
|
0.992 |
0.01 |
-0.23 |
0.96 |
-0.02 |
|
|
0.960 |
0.08 |
0.009 |
-0.14 |
0.96 |
|
|
0.970 |
0.56 |
0.08 |
0.09 |
0.8 |
|
|
0.923 |
0.94 |
0.08 |
-0.11 |
0.04 |
|
|
0.993 |
-0.004 |
-0.86 |
0.48 |
-0.11 |
|
|
0.981 |
0.09 |
0.40 |
-0.26 |
0.85 |
|
|
0.945 |
0.64 |
-0.73 |
-0.03 |
-0.03 |
|
|
0.952 |
0.82 |
-0.04 |
-0.08 |
0.50 |
|
|
20.11 |
20.32 |
21.35 |
30.49 |
% variance |
|
|
Natural |
Neutralization |
Secondary |
Anthropogenic & soil |
category |
| Communality |
Factor3 |
Factor2 |
Factor1 |
|
|
0.831 |
0.07 |
0.07 |
0.9 |
PH |
|
0.779 |
-0.19 |
-0.1 |
0.85 |
|
|
0.932 |
-0.22 |
0.93 |
-0.09 |
|
|
0.919 |
0.21 |
0.25 |
0.89 |
|
|
0.506 |
-0.41 |
-0.51 |
-0.26 |
|
|
0.977 |
0.06 |
0.98 |
0.09 |
|
|
0.904 |
0.38 |
0.72 |
0.48 |
|
|
0.923 |
0.88 |
-0.1 |
0.36 |
|
|
0.910 |
0.95 |
0.07 |
-0.005 |
|
|
0.870 |
0.25 |
0.87 |
-0.20 |
|
|
0.974 |
0.20 |
-0.07 |
0.96 |
|
|
0.876 |
0.83 |
0.14 |
-0.4 |
|
|
0.970 |
0.79 |
0.39 |
0.41 |
|
|
27.53 |
28.24 |
31.69 |
% variance |
|
|
Secondary |
Anthropogenic& soil |
Neutralization |
category |
Conclusion
The Study of chemistry of precipitation over Tehran indicated that major anions were HCO–a SO24– and NO–3 and major cations were Ca2+, Na+ and Mg2+. Concentration of all anions and cations were higher in Mehrabad samples than Aghdasieh ones. In both stations, the rainwater was typically alkaline as the pH value ranged from 4.6 to 8.1 with a volume-weighted mean value of 6.3.Acidity of rain waters was higher in Mehrabad samples (with minimum amount of 4.6). Observed higher acidity in Mehrabad may be attributed to the existence of factories, nearby passenger terminal, busier traffic condition(s) and more importantly local atmospheric circulation. In both stations, the alkaline Ca2+, Mg2+ cations and Bicarbonate anion acted as acid neutralizers and buffered the acidity of rain. This is due to the fact that the soils in and around the city of Tehran are CaSO4, CaCO3, and MgCo3, rich soils.Source identification has been done with several methods, indicated that SO24–, NO3–NO2–, F–, Br– and part of HCO3–, Cl and NH+4 came from anthropogenic sources, where Ca2+, Mg2+,K+, Na+ and the most part of HCO3– originated from natural sources (dust). There were also some secondary particles, namely NH4NO2 NH4F, NH4, Cl,NH4,NO3, NH4, NO3, NH4HSO4NH4 (SO4)2 in sampled rain waters.Due to urbanization, increase of usage of water resources and substantial reduction in precipitation amount, the main particulate matters found over Tehran were dust particles.Increase in atmospheric dust, especially in the spring, are quite clear from the values of total alkalinity, EC, pH, total hardness and TDS.Factories around Tehran, oil refineries, fossil fuels, agricultural activities, Qom salt lake and great desert in south of Tehran may be counted as the main sources of found materials in sampled rain waters. Consequently, it could be concluded that the chemistry of precipitation over Tehran influenced by short, medium and long distance sources.
- Likens, G. E., W. C. Keene, J. M. Miller, and J. N. Galloway. J. Geophys.1987,92, 299-314.
CrossRef - EsmailiSrai, A.Ir. of Iran Meteorological Organization. 1991, 1-200.
- EsmailiSrai, A. Ir. of Iran Meteorological Organization. 1997, 1-70.
- Kulshrestha, U.C., Sarkar, A.K., Srivastava, S.S., Parashar, D.C. Water, Air and Soil Pollution.1995,85, 2137–2142.
CrossRef - Kulshrestha, U.C., Sarkar, A.K., Srivastava, S.S., Parashar, D.C.Atmos. Environ. 1996, 37, 3019–3026.
CrossRef - Zunckel, M., Saizar, C., Zarauz, J. Atmos. Environ. 2003, 37, 1601–1611.
CrossRef - Hu, G.P., Balasubramanian, R., Wu, C.D. Chemosphere 2003, 51, 747–755.
CrossRef - Tang, A., Zhuang, G., Wang, Y., Yuan, H., Sun, Y. Atmos. Environ. 2005, 39, 3397–3406.
CrossRef - Zhang, M., Wang, S., Wu, F., Yuan, X., Zhang, Y. Atmos. Res. 2007, 84, 311–322.
CrossRef - Cao, Y.Z., Wang, Sh., Zhang, G., Luo, J., Lu, Sh. Atmos. Environ. 2009, 94, 462–469.
- Cerqueira, M.R.FM, Pinto, M.F.P., Derossi, I.N., Esteves, W.T., Santos, M.D.R., Matos, M.A.C., Lowinsohn, D., Matos, R.C. Atmospheric Pollution Research.2014, 5, 253‐261.
CrossRef - Park, S.,;Seo, B., Lee, G., Kahng, S., Jang, W.Atmosphere. 2015, 6, 732-750.
CrossRef - Rahn, K.A. Atmos. Environ. 1967, 10, 597–601.
CrossRef - Keene,W.C., Pszenny, A.P., Galloway, J.N., Hawley, M.E. J. Geophys. 1986,91, 6647–6658.
CrossRef - Vermette, S.J., Drake, J.J., Landsberger, S. Water Air Soil Pollut. 1988, 38, 37–53.
- Ahmed, A.F.M., Singh, P.R., Elmubarak, A.H. Atmos. Environ.1990, 24, 2927–2934.
CrossRef - Safai, P.D., Rao, P.S.P., Momin, G.A., Ali, K., Chate, D.M., Praveen, P.S. Atmos. Environ. 2004, 38, 1705–1714.
CrossRef - Budhavant, K.B., Rao, P.S.P., Safai, P.D., Granat, L., Rodhe, H. Atmos. Environ. 2014, 88, 59-65.
CrossRef - Rahn, K. A. A compilation. I. Extern. 1975, 4, 286-313.
- Taylor, S.R. Cosmochim. Acta1964, 28, 1273–1285.
CrossRef - Huang, K., Zhuang, G., Xu, Ch., Wang, Y., Tang, A. Atmos. 2008, 89, 149-160.
- Sorooshian, A., Shingler, T., Harpold, A., Feagles, C.W., Meixner, T., Brooks, P.H. Atmos. Chem. Phys., 2013, 13, 8615–8662.
CrossRef - Chune, S., Xueliang, D., Yuanjian, Y., Xiangrong, H., Biwen. W. ADV. IN ATMOS. 2014, 31, 1157–1166.
- Jain, M., Kulshrestha, U., Sarkar, A., Parashar, D. Atmospheric Environment 2000, 34, 5129–5137.
CrossRef - Pruppacher, H.R., and J.D. Klett.Microphysics of Clouds and Precipitation.1997, 954-960
- Levin, Z., E. Ganor, and V. Gladstein. J. Appl. Meteor., 1996, 35, 1511–1523.
CrossRef - Trochkine, D., Y. Iwasaka, A. Matsuki, M. Yamada, Y.S. Kim, T. Nagatani, D. Zhang, G.Y. Shi, and Z. Shen. J. Geophys. 2003, 108, 8642-8649.
CrossRef - Li, W.J., Shao, L.Y. Atmos. Chem. Phys. 2009, 9, 1863–1871.
CrossRef - Yang, F., Tan, J., Shi, Z.B., Cai, Y., He, K., Ma, Y., Duan, F., Okuda, T., Tanaka, S., Chen, G. Atmos. Chem. Phys.2012, 12, 2025–2035.
CrossRef - Bridgman, H. Global Air Pollution. Wiley, London.1994, 261.
- Seinfield, J.H. WileyInterscience, New York. 1986, 219.
- Pio, C.A. and Harrison, R.M. Atmos. Environ. 1987, 21, 1243–1246.
CrossRef - Matsumoto, K. and Tanaka H.Atmos. Environ. 1996, 30, 639–648.
CrossRef - Du, H ., Kong, L., Cheng, T., Chen, J.,Yang, X., Zhang, R., Han, Z., Yan, Z., Ma, Y. Aerosol and Air Quality Research.2010, 10, 589–59.
CrossRef

This work is licensed under a Creative Commons Attribution 4.0 International License.
![]()
A New Edition of Web of Science
Journal Impact Factor
2022: 0.5
Five Year: 0.8
Journal is Indexed in

Cabells Whitelist
![]()


