Sol-Gel Synthesis of Nio Nanoparticles and Investigation on Adsorption Capacity in the Removal of Cr(VI) From Aqueous Solution
1Department of Science, Maragheh Branch, Islamic Azad University, Maragheh, Iran
2Department of Applied Chemistry, North Tehran Branch, Islamic Azad University
Email: khosravi.morteza93@gmail.com
DOI : http://dx.doi.org/10.13005/ojc/320184
Download this article as:
![]()
In this study, the NiO nanoparticles were synthesized by sol-gel method, and their physicochemical properties were investigated through XRD, SEM-EDX, TEM, and BET-BJH. The TEM results showed that average nanoparticles size was smaller than 10 nm and that there was a good agreement between the TEM and XRD results. The results indicate that NiO nanoparticles are efficient adsorbent for the removal of Cr(VI) from aqueous solutions. The effects of adsorbent, adsorbate concentration, and pH were examined. The equilibrium data could be well described by Sips model. The results of adsorption kinetics study indicated that kinetics obeyed pseudo-second order kinetic model.
KEYWORDS:NiO nanoparticles; sol-gel method; adsorption; Cr(VI)
Introduction
Chromium (VI) contamination in the ground and surface waters is a global problem that grows day by day. This pollutant is dangerous to the environment and human health 1. Cr(VI) is used in industries such as metal plating, paint manufacturing, steel fabrication, leather tanning, etc 2. Various methods including precipitation, ion exchange, reverse osmosis and adsorption have been used for the removal of Cr(VI) from aqueous solution 3. Adsorption is an efficient and easy method which is widely used for wastewater treatment process and removal of heavy metal from aqueous solutions 4. The NiO, due to its high surface area and natural porosity that can interact with heavy metal ions, is a good candidate for the adsorption process5,6. Many types of natural and synthetic adsorbents have been used for adsorption of heavy metal ions from aqueous solution such as… Naeem et al. 3 investigated kinetic and thermodynamic behavior of Cd(II), Co(II) and Zn(II) adsorption from aqueous solution by NiO. Song et al. 7 found out that NiO nanosheets were efficient and recyclable adsorbent for dye pollutant removal, exhibiting much more favorable adsorptive properties than conventionally prepared nickel oxide powder obtained from thermal decomposition of nickel nitrate. Behnajady et al. 8 investigated the adsorption capacity of TiO2–P25 nanoparticles in the removal of a monoazo dye from an aqueous solution. They showed that TiO2-P25 nanoparticles had comparable adsorption capacity to other metal oxide nanoparticles in the adsorption of organic dyes. Kumar et al. 9 investigated the low-cost synthesis of metal oxide nanoparticles and their application in the adsorption of Cr(VI) in the aqueous solution. The prepared metal oxide nanoparticles (ZnO and SnO2), with specific surface area of 15.75 and 24.48 m2 g-1, indicated 9.38 and 3.09 mg g-1 Cr(VI) adsorption capacity, respectively.
this paper, NiO nanoparticles were synthesized by sol-gel method and used as adsorbent for the removal of Cr(VI) from aqueous solution. The effects of solution temperature, pH, initial Cr(VI) concentration, adsorbent dosage on adsorption capacity were investigated. The equilibrium data were tested with isotherm models, and the kinetics was deduced from the experimental results.
The Experiment
Materials and Methods
All the materials used in this study were of analytical grade and were obtained from the Merck. The nickel nitrate hexa-hydrate (Ni(NO3)2.6H2O) and citric acid were used for synthesis of NiO nanoparticles. The stock solutions of Cr(VI) were diluted with double distilled water to obtain working solutions of varying concentrations for further experiments. The pH was adjusted using 0.1 M HCl and 0.1 M NaOH.
Synthesis of NiO nanoparticles by sol – gel method
In this study, nickel oxide nanoparticles were synthesized by sol-gel method, in which the nickel nitrate solution was dripped in citric acid solution for 2 h. Then, the mixed solution was heated to 70 °C under mechanical stirring for about 18 h. The gel was dried at 110 °C for 24 h and finally calcined at 400 °C for 3 h.
Characterization methods
The samples were characterized by using the following methods: X-ray diffraction (XRD) transmission electron microscopy (TEM), scanning electron microscopy (SEM) and energy dispersive X-ray (EDX).
Adsorption experiments
The adsorption experiments were carried out by adding a fixed amount of adsorbent to 100 mL of Cr(VI) solution at a given initial concentration and pH and at a fixed temperature. The reaction vessels were placed on stirring with a constant speed of 1000 rpm. After mixing them, 5 mL of solution was sampled every 5 min, and the solution was centrifuged for 5 min to separate the adsorbent. The Filtrate was analyzed through UV/Vis spectrophotometer in the maximum wavelength of Cr(VI) 10. The effect of the important parameters such as the initial concentration of Cr(VI), (10, 20, 30, 40, 50, 60 mg L-1), dosage of the adsorbent (0.1, 0.2, 0.3, 0.4, 0.5, 0.6 g) and initial pH (4.7, 7, 9) were also investigated. Then, the adsorption percentage was calculated by using Eq. 1 as follows:
where C0 and Ci are the initial and the final concentration of Cr(VI), respectively. The amount of Cr(VI) adsorbed per unit mass of adsorbent (qe) was calculated using Eq. 2 as follows:
where C0 and Ce represent the initial and equilibrium concentrations (mg L-1), respectively; V is the volume of the Cr(VI) solution (L), and W is the weight of the NiO nanoparticles as adsorbent (g).
Result and Discussion
Characterization of NiO nanoparticles
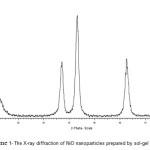
Fig. S1 illustrates the typical XRD pattern of NiO nanoparticles prepared by sol-gel method. The XRD pattern of NiO nanoparticles shows five primary peaks at 2Ө=37, 43, 63, 75 and 790. As seen in the Figure, the diffraction peaks are broader and have weak intensity due to the small size of particles 6. The crystallite size of NiO nanoparticles was estimated by Debye–Scherrer equation by using Eq. 3:
The average crystallite size of NiO nanoparticles was about 7 nm. The NiO nanoparticles obtained from the precipitation method used in our previous work 11 were larger in size (11 nm) than those prepared by the sol-gel method used in the present study. This indicates that the sol-gel method can be used for the synthesis of smaller nanoparticles.
 |
Scheme 1: The X-ray diffraction of NiO nanoparticles prepared by sol-gel method Click here to View scheme |
Typical TEM image of NiO nanoparticles is shown in scheme 2. There is a good agreement between the TEM and XRD results for the particlesize. The average size of NiO nanoparticles, as measured by TEM, was found lower than 10 nm.
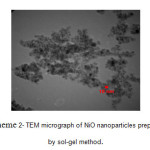 |
Scheme 2: TEM micrograph of NiO nanoparticles prepared by sol-gel method. Click here to View scheme |
The BET and BJH plots of nitrogen adsorption onto NiO nanoparticles are shown in scheme 3. The specific surface area and total pore volume of NiO nanoparticles were 109.36 m2g-1 and 0.1993 cm3 g-1, respectively. The plot of the pore size distribution (scheme 4) was determined by using BJH method from the desorption branch of the isotherm. The pore size distribution of NiO nanoparticles measured 3.09 nm. The NiO nanoparticles obtained from the precipitation method used in our previous work 11 had a low specific surface area and total pore volume compared to the NiO nanoparticles prepared by the sol-gel method (71.09 m2g-1 and 0.1761 cm3g-1) 11.
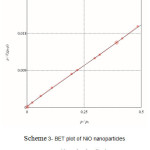 |
Scheme 3: BET plot of NiO nanoparticles prepared by sol-gel method. |
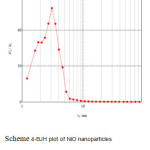 |
Scheme 4: BJH plot of NiO nanoparticles prepared by sol-gel method. |
The SEM micrograph in scheme 5 reveals the NiO nanoparticles have uniform size distribution.
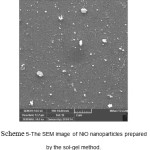 |
Scheme 5: The SEM image of NiO nanoparticles prepared by the sol-gel method. |
The data in scheme 6 show the EDX spectra for NiO nanoparticles prepared by the sol-gel method, which clearly show the peaks of Ni and O.
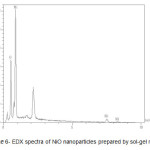 |
Scheme 6: EDX spectra of NiO nanoparticles prepared by sol-gel method. |
Adsorption studies
The effect of Cr(VI) initial concentration
The effect of Cr(VI) initial concentration on the adsorption percentage are shown in scheme 7. According to the Figure, the percentage of adsorption decreases with an increase in the initial concentration of Cr(VI) so that for initial concentration of Cr(VI) of 10 mg L-1, 0.2 g of adsorbent (NiO) dosage and pH=4.7, about 67% of the Cr(VI) was adsorbed during a contact time of 30 min, whereas for the initial concentration of Cr(VI) of 60 mg L-1, about 24% of the Cr(VI) was adsorbed during a contact time of 30 min. This can be explained by the saturation adsorbent sites which cause the adsorbent to uptake more Cr(VI) molecules 12,8. Other researchers have reported similar results for the adsorption of Zn on NiO nanoparticles and thallium (III) ion on ZnO nanoparticles 13,14.
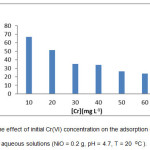 |
Scheme 7: The effect of initial Cr(VI) concentration on the adsorption of Cr(VI) from aqueous solutions (NiO = 0.2 g, pH = 4.7, T = 20 0C). |
The effect of adsorbent (NiO) dosage
The dosage of the NiO in the adsorption of Cr(VI) ranged from 0.1 to 0.6 g. scheme 8 shows the effect of NiO nanoparticles dosage on the adsorption percentage of Cr(VI). According to the Figure, the removal percentage increased from 45% with 0.1 g of NiO nanoparticles to about 86% with a dosage of 0.6 g. The increase of the adsorbent’s dosage causes the increase of the adsorption sites, which, in turn, makes the surface area expand 15,16. A number of researchers have reported similar results for the adsorption of Cr on ZnO and SnO2 and Pb(II) onto NiO nanoparticles 9,17.
![Scheme 8-The effect of NiO dosage on the adsorption capacity of NiO in the adsorption of Cr(VI) from aqueous solutions ([Cr]0 = 20 mg L-1, pH = 4.7, T =20 0C).](https://www.orientjchem.org/wp-content/uploads/2016/01/Vol32_No1_Sol_Nasi_sch8-150x150.jpg) |
Scheme 8: The effect of NiO dosage on the adsorption capacity of NiO in the adsorption of Cr(VI) from aqueous solutions ([Cr]0 = 20 mg L-1, pH = 4.7, T =20 0C). |
The effect of initial pH
The pH of solution is an important parameter in the adsorption of Cr(VI) onto NiO nanoparticles. The data in the scheme 9 indicate that the adsorption capacity increases significantly with a decrease in the pH. As the pH of the system decreases, the surface of NiO becomes positively charged and is then neutralized by the dichromate (Cr2O72-) ions present in the solution 18. Research has shown similar results for the adsorption of Cr(VI) on NiO nanoparticles prepared by the precipitation method and adsorption of arsenate from aqueous solution on binary mixed oxide of iron on silicon 11,4.
![Scheme 9- The effect of initial pH on the adsorption capacity of NiO in the adsorption of Cr(VI) from aqueous solutions ([Cr]0 = 20 mg L-1, NiO = 0.2 g, T = 20 0C).](https://www.orientjchem.org/wp-content/uploads/2016/01/Vol32_No1_Sol_Nasi_sch9-150x150.jpg) |
Scheme 9: The effect of initial pH on the adsorption capacity of NiO in the adsorption of Cr(VI) from aqueous solutions ([Cr]0 = 20 mg L-1, NiO = 0.2 g, T = 20 0C). |
Equilibrium isotherm studies
Equilibrium characteristics, referred to as adsorption isotherms, describe how the adsorbate interacts with adsorbent 19,20. The results indicated that the time needed to reach equilibrium, using 0.2 g of NiO nanoparticles with the Cr(VI) concentration in the range of 10 – 60 mg L-1, was 25 min. In order to obtain the maximum adsorption capacity and other characteristics of NiO nanoparticles, the Langmuir, Freundlich, Temkin, Redlich-Peterson, Sips, Toth isotherms were used. The isotherm parameters were evaluated by non-liner trial and error method using Polymath 6.0 software. The results are demonstrated in Table 1 21. Regression coefficient (R2), adjusted regression coefficient (R2adj.), and root mean square error (Rmsd) parameters were used to gauge the appropriateness of fit. Scheme 10 and scheme 11 show 2-parameter and 3-parameter isotherm models for the adsorption of Cr(VI) onto NiO nanoparticles, respectively.
Table 1: Isotherm model parameter values (±95% confidence level).
|
Model |
R2 |
R2adj |
Rmsd |
Parameters |
Parameters values |
|
2-p Langmuir |
0.99007 |
0.98808 |
0.08911 |
qm KL |
7.63 (±0.67) 0.21 (±0.09) |
|
2-p Freundlich |
0.98172 |
0.97806 |
0.12089 |
KF n |
2.65 (±0.0018) 3.81 (±0.003) |
|
2-p Temkin |
0.98859 |
0.98631 |
0.09550 |
ΔQ (J mol-1) KT |
1705.16 (±421.54) 3.24 (±3.34) |
|
3-p Redlich-Peterson |
0.99074 |
0.98611 |
0.08604 |
A B g |
1.95 (±2.34) 0.32 (±0.76) 0.94 (±0.3) |
|
3-p Sips |
0.99095 |
0.98643 |
0.08505 |
qm Ka α |
8.25 (±0.14) 0.18 (±0.01) 0.82 (±0.05) |
|
3-p Toth |
0.99074 |
0.98611 |
0.08604 |
qm KTh β |
6.90 (±4.39) 0.3 (±0.64) 0.94 (±0.3) |
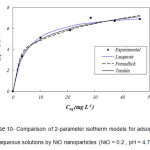 |
Scheme 10: Comparison of 2-parameter isotherm models for adsorption of Cr(VI) from aqueous solutions by NiO nanoparticles (NiO = 0.2 , pH = 4.7, T = 20 0C). |
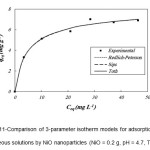 |
Scheme 11: Comparison of 3-parameter isotherm models for adsorption of Cr(VI) from aqueous solutions by NiO nanoparticles (NiO = 0.2 g, pH = 4.7, T = 20 0C). |
Langmuir isotherm
The Langmuir equation is probably the best known adsorption isotherm 22. This model is based on the following equation:
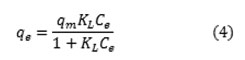
where Ce is the equilibrium concentration of solute (mg L-1), qe is the amount of adsorbate adsorbed at equilibrium (mg g-1), qm is the maximum adsorption capacity, and KL is the Langmuir adsorption model constant (L mg-1). The correlation coefficient (R2) was found to be 0.99007 for Langmuir, indicating a satisfactory fit to the experimental data and showing that the all the sites are uniform and the adsorbent has a homogeneous structure 23.
The maximum mono-layer capacity (qm) obtained from Langmuir model was 7.63 mg g–1. Table 2 lists maximum capacity of the mono-layer adsorption of Cr(VI) onto metal oxide nanoparticles reported in the literature. According to the results shown in the table, NiO nanoparticles prepared by sol-gel method in this work exhibited comparable adsorption capacity to other metal oxide nanoparticles but higher adsorption capacity than NiO nanoparticles prepared by precipitation method.
Table 2: Adsorption capacity of metal oxides for Cr(VI).
|
Adsorbent |
Synthesis method |
qm (mg g-1) |
Reference |
|
NiO |
Precipitation |
4.73 |
[11] |
|
SnO2 |
Precipitation |
3.09 |
[9] |
|
ZnO |
Precipitation |
9.38 |
[9] |
|
NiO |
Sol-gel |
7.63 |
This work |
Freundlich isotherm
The Freundlich isotherm is an empirical equation employed to describe heterogeneous adsorption 8. This model is based on the following equation:
![]()
where KF is Freundlich adsorption model constant (L g-1) and n is a measure of the deviation from linearity of the adsorption. According to the results shown in Table 1, the n value is 3.81. Thus, the adsorption process is a chemical system. The R2 of the Freundlich isotherm is 0.98172, showing that the experimental data are not in better agreement with this isotherm than with Langmuir isotherm.
Temkin isotherm
Temkin is concerned with determining the heat of adsorption and the adsorbate-adsorbate interactions 24, and is represented by following equation:
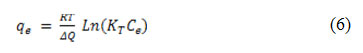
where T is absolute temperature (K), R is gas constant (J gmol-1 K-1), KT is Temkin model constant (L mg-1) and ΔQ is the heat of adsorption (J). ΔQ for adsorption of Cr(VI) onto NiO nanoparticles was 1705.16 J mol-1, which indicates an endothermic adsorption process.
Redlich–Peterson isotherm
This isotherm has the features of the both Langmuir and Freundlich isotherm equations 8. This model is based on the following equation:
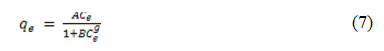
where A and B are Redlich–Peterson model constants (L mg-1) and g is model exponent. R2 value clearly shows that this isotherm can describe the experimental data fairly well. In this study, the g value is 0.94, which indicates that the isotherm is approaching the Langmuir isotherm, since when g=1, isotherm transforms to Langmuir model, and when g= 0, isotherm transforms to linear form of Freundlich isotherm (Henry’s law).
Sips isotherm
The sips or Langmuir–Freundlich isotherm was introduced by Sips in 1948. When the adsorbate concentration is low, this isotherm reduces to Freundlich isotherm, and when the adsorbate concentration is high, this isotherm reduces to Langmuir isotherm 25. This model is based on the following equation:
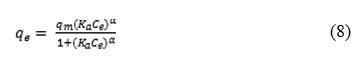
where Ka is sips model constant (L mg-1) and 15α”> is Sips model exponent. The R2 value for Sips isotherm is 0.99095, which shows that the experimental data have a better agreement with this isotherm. The value of α is closer to 1, indicating that the adsorption of Cr(VI) onto NiO nanoparticles is approaching Langmuir form more than Freundlich form 22.
Toth isotherm
This isotherm is associated with the potential theory 8 and is based on the following equation:
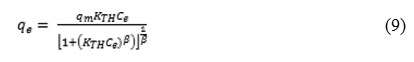
where KTh is Toth model constant (L mg-1) and β is Toth model exponent. Toth isotherm can be reduced into the Henry law in low concentrations and to Langmuir model when β is equal to one.
The β value is 0.94, which indicates that the isotherm is approaching the Langmuir model.
Adsorption kinetic studies
The rate of reaction is one of the key factors in designing of the adsorption systems. In this study, pseudo-first-order and pseudo-second-order kinetic models were investigated to find the best- fitted model for the experimental data. The plot of nonlinear regression of these models to the experimental data is shown in scheme 12. Also, all the parameters of these models are listed in Table 3.
![Scheme 12- Comparison of kinetic models for adsorption of Cr(VI) onto NiO nanoparticles (NiO = 0.2 g, [Cr]0 = 20 mg L-1, pH = 4.7, T = 20 0C).](https://www.orientjchem.org/wp-content/uploads/2016/01/Vol32_No1_Sol_Nasi_sch12-150x150.jpg) |
Scheme 12: Comparison of kinetic models for adsorption of Cr(VI) onto NiO nanoparticles (NiO = 0.2 g, [Cr]0 = 20 mg L-1, pH = 4.7, T = 20 0C). |
Table 3: Adsorption kinetics parameter values (±95% confidence level).
|
Model |
R2 |
R2adj |
Rmsd |
Parameters |
Parameters values |
|
Pseudo-first order kinetic model |
0.99261 |
099114 |
0.05613 |
K1 qe |
0.42(±0.16) 5(±0.21) |
|
Pseudo-second order kinetic model |
0.99745 |
0.99695 |
0.023295 |
K2 qe |
0.097(±0.18) 5.29(±0.22) |
Pseudo-first order kinetic model
This model is based on the following equation:
![]()
where qt and qe are the amounts of Cr(VI) adsorbed at contact time of t and at equilibrium (mg g-1), respectively. k1 is pseudo-first order kinetic model rate constant (min-1). As shown in Table 3, the R2 and R2adj of this model are lower than Pseudo-second order kinetic model, and Rmsd is higher than it. This suggests that the kinetics of Cr(VI) adsorption on NiO nanoparticles did not follow the pseudo-first-order kinetic model.
Pseudo-second order kinetic model
This model is based on the following equation:
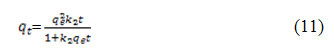
where k2 is pseudo-second order kinetic model rate constant (g mg-1 min-1). According to the results shown in Table 2 and scheme 12, this model has satisfactorily fit to the experimental data, as indicated by R2, R2adj and Rmsd. This model demonstrates the occurrence of two reactions: the first one is fast and reaches equilibrium quickly; the second is slow and can continue for a long time 26.
Intra-particle diffusion kinetic model
The adsorption of Cr(VI) on NiO nanoparticles may be controlled via external film diffusion and later by the intra-particle diffusion. Intra-particle diffusion kinetic model can be expressed as follows:
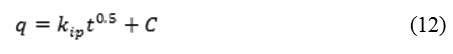
where kip is intra-particle diffusion kinetic model rate constant (mg g-1 min-0.5). Scheme 13 shows the intra-particle diffusion kinetic plot for the adsorption of Cr(VI) on NiO nanoparticles. According to this plot, there are two steps involved in the process. The first region corresponds to instantaneous adsorption on the external surface, and the second region is the gradual adsorption. In the other words, the second linear portion is due to intra-particle diffusion or pore diffusion. Therefore, the slope of the second linear portion of the plot has been considered the kip 26,27.
![Scheme 13-The intra-particle diffusion plot for adsorption of Cr(VI) onto NiO nanoparticles (NiO = 0.2 g, [Cr]0 = 20 mg L-1, pH = 4.7, T = 20 0C).](https://www.orientjchem.org/wp-content/uploads/2016/01/Vol32_No1_Sol_Nasi_sch13-150x150.jpg) |
Scheme 13: The intra-particle diffusion plot for adsorption of Cr(VI) onto NiO nanoparticles (NiO = 0.2 g, [Cr]0 = 20 mg L-1, pH = 4.7, T = 20 0C). |
Conclusion
Nanosized NiO material was prepared by sol-gel method. The NiO nanoparticles were characterized by XRD, TEM, SEM, EDX and BET-BJH surface area analysis. The average crystallite size of NiO nanoparticles was about 7 nm. The TEM results showed that there was a good agreement between the TEM and XRD results for the particle size. The BET analysis showed that the specific surface area and total pore volume of NiO nanoparticles were 109.36 m2g-1 and 0.1993 cm3 g-1, respectively. The SEM micrograph indicated that the NiO had uniform size distribution. The effect of Cr(VI) initial concentration revealed the decrease of adsorption percentage with the decrease of Cr(VI) concentration but the rise of the adsorption percentage with an increase in the dosage of the NiO nanoparticles. It was also found that the isotherm model and adsorption kinetics followed Sips isotherm and pseudo-second order kinetic model, respectively.
Acknowledgement
The authors gratefully acknowledge Islamic Azad University, North Tehran Branch, for providing facilities.
References
- Sheela, T., Arthoba Nayaka, Y., Kinetics and thermodynamics of cadmium and lead ions adsorption on NiO nanoparticles, Chem. Eng.J. 2012, 91, 123–131.
CrossRef - Cheng, B., Le, Y., Cai, W., Yu, J., Synthesis of hierarchical Ni(OH)2 and NiO nanosheets and their adsorption kinetics and isotherms to Congo red in water, J. Hazard. Mater. (2011), 185, 889–897.
CrossRef - Mahmood, T., Saddique, M.T. , Naeem, A., Mustafa, S., Zeb, N., Shah, K.H., Waseem, M., Kinetic and thermodynamic study of Cd(II), Co(II) and Zn(II) adsorption from aqueous solution by NiO, Chem. Eng.J. (2011), 171, 935–940.
CrossRef - Mahmood, T., Din, S.U., Naeem, A., Mustafa, S., Waseem, M., Hamayun, M., Adsorption of arsenate from aqueous solution on binary mixed oxide of iron and silicon, Chem. Eng.J (2012), 192, 90–98.
CrossRef - Hosny, N.M., Synthesis, characterization and optical band gap of NiO nanoparticles derived from anthranilic acid precursors via a thermal decomposition route, Polyhedron. (2011), 30, 470–476.
CrossRef - Wu, Y., He, Y., Wu, T., Weng, W., Wan, H., Effect of synthesis method on the physical and catalytic property of nanosized NiO, Mater. Lett., (2007), 61, 2679–2682.
CrossRef - Lifang, Ch., Juncheng, H., Ryan, R., Nio nanosheets as efficient and recyclable adsorbents for dye pollutant removal from wastewater, Nanotech., (2009),20, 275707
CrossRef - Behnajady, M.A., Yavari, Sh. Modirshahla, N., Investigation on adsorption capacity of TiO2-P25 nanoparticles in the removal of a manono-azo dye from aqueous solution: A comprehrnsive isotherm analysis, Chem. Ind. Chem. Eng. Q. (2014), 20, (1) 97-107.
CrossRef - Kumar, K. Y., Muralidhara, H.B., Arthoba Nayaka, Y., Balasubramanyam, J., Hanumanthappa , H., Low-cost synthesis of metal oxide nanoparticles and their application in adsorption of commercial dye and heavy metal ion in aqueous solution, Powder. Tech. (2013), 246,125–136.
CrossRef - Mohapatra, P., Samantaray, S.K. , Parida, K., Photocatalytic reduction of hexavalent chromium in aqueous solution over sulphate modified titania, J. Photochem. Photobiol., A, (2005), 170, 189–194.
CrossRef - Behnajady, M. A., Bimeghdar, S., Synthesis of mesoporous NiO nanoparticles and their application in the adsorption of Cr(VI), Chem. Eng. J. (2014), 239,105–113.
CrossRef - Chowdhury, S., Mishra, R., Saha, P., Kushwaha, P., Adsorption thermodynamics, kinetics and isosteric heat of adsorption of Malachite Green onto chemically modified rice husk, Desalination . (2011), 265, 159–168
CrossRef - Mahmood, T., Saddique, M.T., Naeem, A., Mustafa, S., J. Hussain, B. Dilara, Cation exchange removal of Zn from aqueous solution by NiO, J. Non-Crystalline Solids. (2011), 357, 1016–1020.
CrossRef - Dashti Khavidaki, H., Aghaie, H. , Shishehbore, M. R. , Adsorption of thallium (III) ion from aqueous solution using modified ZnO nanopowder, J. Phys. Theor. Chem. IAU Iran. (2011), 8, (3) 233-244.
- Gonen, F., Serin, S., Adsorption study on orange peel: Removal of Ni(II) ions from aqueous solution, Afr. J. Biotechnol. (2012) ,11, 1250–1258.
- Ozacar, M., Sengil, I.A., Adsorption of metal complex dyes from aqueous solutions by pine sawdust, Bioresour. Technol. (2005), 96, 791–795.
CrossRef - Ranran, W., Qiurong, L., Danyang, X., Haiyan, X., Hongxiao, L., Synthesis of NiO using pine as template and adsorption performance for Pb(II) from aqueous solution, Appl. Surface. Sci. (2013), 279,129–136
CrossRef - Naeem, A., Saddique, M.T., Mustafa, S., Tasleem, S., Shah, K.H. , Waseem, M., Removal of Co+2 ions from aqueous solution by cation exchange sorption onto NiO, J. Hazard. Mater. (2009),172, 124–128.
CrossRef - Modirshahla, N., Behnajady, M. A. , Shamel, A., Eskandari, H., Sorption study of C.I. Acid Red 88 from aqueous solutions onto sawdust, J. Phys. Theor. Chem. IAU Iran. (2010),7, (2) 77-81.
- Nandi, B.K. , Goswami, A., Purkai, M.K. , Adsorption characteristics of brilliant green dye on kaolin, J. Hazard, Mater, (2009), 161, 387–395.
CrossRef - El-khaiary, M.I. , Malash, G.F. , Ho, Y.S. , On the use of linearized pseudo-secondorder kinetic equation for modeling adsorption systems, Desalination. (2010), 257, 93–101.
CrossRef - Ho, Y.S. , Prter, J.F. , Mckay, G., Equilibrium isotherm studies for the sorption of divalent metal ions onto peat: copper, nickel and lead single component systems, Water Air Soil Pollut., (2001),141, 1–33.
CrossRef - Nuengmatcha, P., Mahachal, R., Chanthal, S., Thermodynamic and kinetic study of the intrinsic adsorption capacity of graphene oxide for malachite green removal from aqueous solution, Oriental journal of chemistry. (2014), 30, 1463-1474.
- Hameed, B.H., Tan, I.A.W., Ahmad, A.L., Adsorption isotherm, kinetic modeling and mechanism of 2,4,6-trichlorophenol on coconut husk-based activated carbon, Chem. Eng. J. (2008), 144, 235–244.
CrossRef - Subramanyam, B., Das, A., Study of the adsorption of phenol by two soils based on kinetic and isotherm modeling analyses, Desalination. (2009), 249, 914–921.
CrossRef - Alzaydien, A.S., Adsorption behavior of methyl orange onto wheat bran: Role of surface and pH, Oriental journal of chemistry. (2015), 31,643-651.
- Dogan, M., Abak, H., Alkan, M., Adsorption of methylene blue onto hazelnut shell: Kinetics, mechanism and activation parameters, J. Hazard. Mater., (2009),164, 172-181.
CrossRef


![]()


