Quantification of Diclofenac at Trace Levels in Pharmaceutical and Urine Samples Using Kinetic Spectrophotometric Method
Fatemeh Fallah, Masoud Reza Shishehbore* and Ali Sheibani
Department of Chemistry, Yazd Branch, Islamic Azad University, Yazd, Iran Corresponding Author Email: shishehbor47@iauyazd.ac.ir
DOI : http://dx.doi.org/10.13005/ojc/320181
Article Received on :
Article Accepted on :
Article Published : 05 Feb 2016
Diclofenac, a non-steroidal anti-inflammatory drug, is prescribed to reduce inflammation and as an analgesic reducing pain in certain conditions. In this study, a sensitive reaction system for quantitative determination of diclofenac was introduced. The method is based on the catalytic effect of diclofenac on the Orange G-bromate reaction system. The change in absorbance was followed spectrophotometrically as a criterion of the oxidation reaction progress at 478.5 nm. The effective reaction variables were optimized. Under optimized experimental conditions, calibration curve was linear over the range 0.035 – 2.7 mg/l and the detection limit (3sb/m) was 0.014 mg/l for five replicate determinations of blank signal. The interfering effect of various species was also investigated. The developed procedure was applied for the determination of diclofenac in pharmaceutical and biological samples satisfactorily.
KEYWORDS:Diclofenac; Orange G; pharmaceutical and urine samples; Kinetic spectrophotometry
Download this article as:| Copy the following to cite this article: Fallah F, Shishehbore M. R, Sheibani A. Quantification of Diclofenac at Trace Levels in Pharmaceutical and Urine Samples Using Kinetic Spectrophotometric Method. Orient J Chem 2016;32(1). |
| Copy the following to cite this URL: Fallah F, Shishehbore M. R, Sheibani A. Quantification of Diclofenac at Trace Levels in Pharmaceutical and Urine Samples Using Kinetic Spectrophotometric Method. Orient J Chem 2016;32(1). Available from: http://www.orientjchem.org/?p=13854 |
Introduction
Diclofenac, ((2-(2,6-dichloranilino) phenylacetic acid) is a nonsteroidal anti-inflammatory drug that was introduced in UK in 1979. It is used to treat pain, inflammatory disorders and dysmenorrhea. It works by reducing hormones that cause inflammation and pain in the body. Long-term use of diclofenac predisposes for peptic ulcer. It is available as tablet, oral injection solution and suppository. It is also available over-the-counter in some countries. Therefore, diclofenac is a widely used drug that so easily available1,2. Regarding to widespread of the use of diclofenac, developing a rapid, reliable, and low cost procedure for quantitative determination of it in real samples with different matrices is necessary.
Various reports have been found for quantitation of diclofenac in real samples with different matrices. The most common methods are including liquid chromatography3-5, electrochemical techniques6,7 and spectrophotometry8,9. Along with the high sensitivity and precision of chromatographic methods, hard operation and set up cost are the main disadvantages of them. Also, low repeatability and poor selectivity are the main drawback of the electrochemical methods.
Catalytic spectrophotometric method as a low cost and simple method with sufficient accuracy is considered as an alternative for the determination of trace elements in samples with different matrices such as foods10, biological and pharmaceutical11,12 samples.
In this report, for the first time, a sensitive and rapid kinetic spectrophotometric method for quantitation of diclofenac was reported. The method is based on the catalytic effect of diclofenac on the Orange G–bromate reaction system. The developed procedure was applied for the determination of diclofenac in real samples with satisfactory results.
Experimental
Materials and Methods
Doubly distilled water and analytical reagent grade chemicals were used. Diclofenac as diclofenac sodium (Sigma) stock solution 75.0 mg/l was prepared just before use by dissolving appropriate amount of diclofenac sodium in water and diluted to the mark in a 100 mL calibrated flask. Working solution was prepared by serial dilution. A solution of Orange G (6.6 × 10⁻⁴ mol/l) was prepared by dissolving 0.2985 g of Orange G (Merck) in water and diluting to 1.0 L with water. Sulfuric acid solution (3.0 mol/l) was prepared by appropriate dilution of conc. sulfuric acid (Merck). A 0.1 mol/l of potassium bromate solution was prepared by dissolving 16.7100 g of KBrO3 (Merck) in water and diluting to 1.0 l in a calibrated flask.
Apparatus
A double beam Shimadzu UV-Vis spectrophotometer (160A, Japan) with 1-cm matched glass cells was used to measure the absorbance. A thermostated water bath (Heidolph, Germany) was used to keep the temperature of all solutions at the working temperature (25.0 ± 0.1°C). A stop-watch was used to record the reaction time.
Recommended Procedure
The catalyzed reaction was studied spectrophotometrically by monitoring the change in absorbance of the reaction mixture at 478.5 nm (λmax). For this purpose, to a series of 10 ml volumetric flasks, 1.0 ml of 6.6 × 10⁻⁴ mol/l of Orange G solution, 1.5 ml of 3.0 mol/l sulfuric acid solution and the standard solutions containing 0.35 – 27.0 µg of diclofenac were added. The solution was thoroughly mixed and diluted to 8 ml with water. Then, 0.4 ml of 0.1 mol/l of bromate solution was added and diluted to the mark. A time measurement was started just after adding the last drop of the oxidant. A portion of the mixed solution was transferred to a glass cell. The absorbance of catalysed reaction (ΔAs) was measured against water at λmax and 30 °C and 120 s by time interval 30 s. The measurement in the absence of diclofenac was repeated to obtain the values for the uncatalysed reaction (ΔAb). The difference in the absorbance change was considered as the response (ΔA = ΔAs – ΔAb). The calibration curve was constructed by plotting the response against the diclofenac concentration.
Procedure of Sample Preparation.
Ten diclofenac tablets (in each dosage) were weighed, powdered and mixed thoroughly. An amount corresponding to the weight of a tablet was weighed, and dissolved with water. After 10 min sonication, the sample was filtered through a Whatman filter paper (No. 1), transferred to a 25 ml volumetric flask and diluted to the mark with water. The diclofenac injection solution was transferred to a 100 ml volumetric flask. 0.2 g of 1% topical gel was weighed accurately and 2 ml of acetone was added. The solution was sonicated at 30 ºC for ten minutes. After filtration through Whatman filter paper (No. 1), the solution was transferred to a 25 ml volumetric flask and diluted to the mark with water13.
Diclofenac was also determined in human urine as biological sample. The sample was collected from persons who had not taken the drug. The collected sample was purified using liquid-liquid extraction as follow: 5 ml of the sample was mixed with 5 ml of chloroform and shacked well. After centrifugation at 4000 rpm, the purified sample was transferred to 25 ml volumetric flask and analysed according to the developed procedure14.
Results and Discussions
Orange G, (Acid Orange 10, see Scheme 1 for molecular structure) is a synthetic azo dye that can be used in histology for staining formulation. In addition, it is used as pH indicator and color marker in electrophoresis. The product of Orange G oxidation is a colorless compound15. Also, it was used as a reagent for the determination of dexamethasone12 and ascorbic acid15.
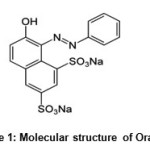 |
Scheme 1: Molecular structure of Orange G |
Evaluating the capability of the selected reaction system (Orange G, sulfuric acid and bromate) for quantitative determination of diclofenac was investigated by following the change in absorbance in absence and presence of it. Comparison of the results indicated that trace amounts of diclofenac could be increase the reaction rate seriously. Therefore, the proposed reaction system can be used for the determination of diclofenac at trace levels.
The suggested reaction mechanism of the proposed reaction system may be represented as follow:
The uncatalysed reactions that resulted to blank signal (∆Ab) carry out in a cyclic way.
Orange G as a dye indicator in reduced form can be oxidized by bromate in acidic media to produce a colorless product (Orange G in oxidized form) and bromide (Reaction 1). The reaction is slow. Bromine was generated in presence of bromide in acidic media based on a well-known reaction (Reaction 2).
Oxidation of Orange G by bromine was down faster than oxidation by bromate (Reaction 3).
Orange G(Red) + BrO3–+ 6 H+ → Orange G(Ox) + Br– + 3H2O (1)
6 BrO3– + 10 H+ + 12 Br– → 6 Br2 + 6 H2O (2)
Orange G(Red) + Br2 + H+ → Orange G(Ox) +2 Br– (3)
Also, diclofenac in reduced form can be oxidized by bromine (Reaction 4).
Diclofenac(Red) + Br2 + H+ → 2 Br– + Diclofenac (ox) (4)
Based on the proposed mechanism, Br– generation was increased by oxidation of diclofenac in persence of Br2 that resulted to increasing the possibility of decolorization of Orange G. Therefore, the change in absorbance in persence of diclofenac was increased dramatically and diclofenac was shown the catalytic effect (Fig.1).
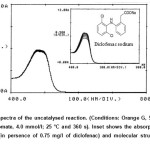 |
Figure 1: Absorption spectra of the uncatalysed reaction. (Conditions: Orange G, 59.4 µmol/l; sulfuric acid, 0.39 mol/l; bromate, 4.0 mmol/l; 25 °C and 360 s). Inset shows the absorption spectra of the catalysed reaction (in persence of 0.75 mg/l of diclofenac) and molecular structure of diclofenac sodium. Click here to View figure |
In orther to obtain the maximum sensitivity as employing the proposed procedure, the effective variables must be optimized. The maximum response was considered to obtain the most sensitive results.
The effect of Orange G concentration on the rate of reaction was studied over the range 46.2 – 72.6 µmol/l. As it an be seen in Fig. 2, the sensitivity was increased up to 62.7 µmol/l of Orange G. Dye aggregation maybe resulted to decrease the reaction rate at higher concentrations. Thus, 62.7 µmol/l of Orange G as optimum concentration was selected for further study.
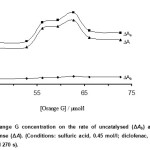 |
Figure 2: Effect of Orange G concentration on the rate of uncatalysed (ΔAb) and catalysed (ΔAs) reactions and response (ΔA). (Conditions: sulfuric acid, 0.45 mol/l; diclofenac, 0.75 mg/l; bromate, 4.0 mmol/l; 25 °C and 270 s). Click here to View figure |
The effect of sulfuric acid concentration on the catalyzed and uncatalyzed reactions was studied over the range of 0.42 to 0.51 mmol/l (Fig. 3). The maximum sensitivity was obtained at 0.46 mmol/l, whereas at higher concentrations the sensitivity was decreased. It may be attributed to protonation of Orange G at higher acid concentrations that makes its oxidaion to be quite difficult. Therefore, 0.46 mol/l of sulfuric acid was used for further study.
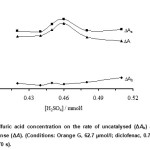 |
Figure 3: Effect of sulfuric acid concentration on the rate of uncatalysed (ΔAb) and catalysed (ΔAs) reactions and response (ΔA). (Conditions: Orange G, 62.7 µmol/l; diclofenac, 0.75 mg/l; bromate, 4.0 mmol/l; 25 °C and 270 s). Click here to View figure |
The effcet of bromate concentration on the reaction rate was studied in concentration range 3.0 – 5.0 mmol/l. As shown in Fig. 4, the net reaction rate was increased up to 4.0 mmol/l which was selected as being the optimum concentration of oxidant.
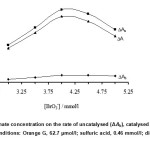 |
Figure 4: Effect of bromate concentration on the rate of uncatalysed (ΔAb), catalysed (ΔAs) reactions and response (ΔA). (Conditions: Orange G, 62.7 µmol/l; sulfuric acid, 0.46 mmol/l; diclofenac, 0.75 mg/l; 25 °C and 270 s). Click here to View figure |
The effect of the temperature on the reaction rate was studied under optimum experimental conditions in temperature range of 20 to 40 °C. Increasing the temperature up to 30 °C caused an increase in the sensitivity, whereas at higher temperatures it decreased. Thus, 30 °C was selected as being the optimum temperature.
The optimum time was found by measuring the change in the absorbance during 30 – 270 s. The reaction rate increased up to 120 s, and in longer times the reaction rate was almost constant. Therefore, 120 s was selected for further study.
Calibration curve and detection limit
Calibration curve that was constructed by plotting the response against diclofenac concentration was linear over the range 0.035 – 2.7 mg/l of diclofenac. The regression equation of the calibration curve gave as equations 5.
ΔA = 0.411[diclofenac] – 0.0043 (R2 = 0.9997) (5)
where ΔA is the difference in the absorbance between the blank and the sample signals, [diclofenac] is the diclofenac concentration in mg/l and R2 is the correlation coefficient.
The limit of detection (3sb/m; sb is the standard deviation of the blank signal and m is the slope of calibration curve) was 0.014 mg/l of diclofenac for five replicate determinations. The relative standard deviations (n = 5) were 1.84, 1.59 and 1.07% for 0.5, 1.0 and 2.0 mg/l of diclofenac, respectively.
Interference study
The interfering effect of foreign species on the determination of 1.0 mg/l of diclofenac was investigated. The tolerance limit was defined as the concentration of the added species causing an error more than ± 5% on analytical signal. The obtained results, given in Table 1, indicated that chloride and nitrite have seriously interfering effect, whereas not exist in real sample matrix.
Table 1: Tolerance limit for foreign species on the determination of 1.0 mg/l of diclofenac.
| Foreign species | Tolerance limit (WDiclofenac/WSpecies) |
| Glucose | 1000 |
| Fructose | 975 |
| CH3CO2‑, PO4-3 | 1000 |
| CO32‑, NO3‑ | 970 |
| Na+, K+ | 1000 |
| Uric acid | 485 |
| Cl‑ | 4 |
| NO2‑ | 1 |
Application
To evaluation the analytical applicability of the developed method, quantitative determination of diclofenac in various real samples with different matrices was done. Pharmaceutical sample preparation was performed as discussed previously. An appropriate amount of the samples were analyzed by the recommended procedure. The results of three replicate determinations were given in Table 2. The precision (RSD%) is near to 1% for all of the analyzed pharmaceutical samples. The obtained values confirm the repeatability of the developed method. The reliability of the method was evaluated by statistical t test. The experimental t values for diclofenac tablet (0.76, 0.65 and 2.03), diclofenac injection solution (0.33 and 0.39) and diclofenac topical gel (3.46) are differ from the critical value (4.30, 95% confidence level and two degrees of freedom). Regarding to the difference between the experimental and critical t values, the systematic error for the determination of diclofenac in pharmaceutical samples using the developed method is negligible. Also, the procedure was used for the determination of diclofenac in urine sample. After sample preparation, they were spiked with different amounts (0.5, 1.0 and 1.5 mg/l) of diclofenac and analysed using developed procedure. The obtained results were given in Table 3. The accuracy of the procedure was confirmed by recovery. The recovery values of the spiked urine sample, 99.0-104.0%, confirm the slight systematic error during the quantitative determination of diclofenac. Successive applications of developed method for drug determination in pharmaceutical preparations and urine samples confirmed that the developed method is free from interfering effect of matrix effect and suitable for analysis of diclofenac in different real samples.
Table 2: Determination of diclofenac in diclofenac sodium tablet, diclofenac injection solution and diclofenac topial gel using the developed procedure.
| Sample | Founda | RSD(%) | Labled | Statistical t testb | Pharmaceutical Co/Batch No. |
| Tablet | |||||
| 1 | 24.89 ± 0.25 | 1.00 | 25 mg/Tablet | 0.76 | Hakim-Iran/0889 |
| 2 | 50.21 ± 0.56 | 1.11 | 50 mg/Tablet | 0.65 | Shahrdaru-Iran/01 |
| 3 | 101.32 ± 1.12 | 1.10 | 100 mg/Tablet | 2.03 | Alborzdaru-Iran/14135 |
| Injection solution | |||||
| 1 | 74.82 ± 0.80 | 1.07 | 75 mg/Amp | 0.39 | Aburaihan-Iran/2025 |
| 2 | 75.15 ± 0.79 | 1.05 | 75 mg/Amp | 0.33 | Troge medical-GMBH/12091-02 |
| Topical gel | |||||
| 1 | 0.98 ± 0.01 | 1.02 | 1 % | 3.46 | Behvazan-Iran/56949 |
| aMean±standard deviation (n=3)bTabulated t-value for two degrees of freedom at P(0.95) is 4.30. | |||||
Table 3: Determination of diclofenac in human urine using the developed procedure.
| Sample | Added(mg/l) | Founda (mg/l) | RSD (%) | Recovery (%) |
| Human urine | ||||
| 1 | — | <D.L | — | <D.L |
| 0.5 | 0.52± 0.01 | 1.92 | 104.0 | |
| 1.0 | 0.99 ± 0.01 | 1.01 | 99.0 | |
| 1.5 | 1.53 ± 0.02 | 1.31 | 102.0 | |
| aMean±standard deviation (n=3) | ||||
Conclusions
In this study, a sensitive kinetic spectrophotometric method for the detrmination of diclofenac at trace levels was reported. The developed procedure has advantages over the existing methods in cost, simplicity, ease of operation and applicability of the procedure for analysis of pharmaceutical and biological samples .
Acknowledgment
The athours are thakful to the Islamic Azad University-Yazd Branch for financial assistance of the research.
References
- Salmann, A. R.; Am. J. Med. 1986, 80, 29–33.
CrossRef - Breen, E. G.; McNicholl, J.; Cosgrove, E.; McCabe, J.; Stevens, F. M.; Gut. 1986, 27, 1390–1393.
CrossRef - Osorio, V.; Imbert-Bouchard, M.; Zonja, B.; Abad, J-L.; Pérez, S.; Barcelo, D.; J. Chromatogr. A 2014, 1347, 63-71.
CrossRef - Kaale, E.; Nyamweru B. C.; Manyanga, V.; Chambuso, M.; Layloff, T.; Int. J. Chem. Anal. Sci. 2013, 4, 73-79.
CrossRef - Song, X-Y.; Shi, Y-P.; Chen, J.; Talanta 2012, 100, 153-161.
CrossRef - Oliveira, M, C., Bindewald, E. H.; Marcolino, L. H., Bergamini, M. F.; J. Electroanal. Chem. 2014, 732, 11-16.
CrossRef - Mokhtari. A.; Karimi-Maleh, H.; Ensafi. A. A.; Beitollahi, H.; Sens. Actuators B. 2012; 169, 96-105.
CrossRef - Amiri-Pebdani, A.; Haji Shabani, A. M.; Dadfarnia, S.; Khodadoust, S.; Spectrochim. Acta A 2015; 147, 26-30.
CrossRef - Sena, M. M.; Chaudhry, Z. F.; Collins, C. H.; Poppi, R. J.; J. Pharm. Biomed. Anal. 2004, 36, 743-49.
CrossRef - Shishehbore, M. R.; Jokar, R.; Anal. Methods 2011; 3, 2815–21.
CrossRef - Shishehbore, M. R.; Asgharpoor, A.; Nasirizadeh, N.; J. Chem. 2013, 4, 1-6.
- Akhoundi-Khalafi, A. M.; Shishehbore, M. R.; Int. J. Anal. Chem. 2015, 5, 1-6.
CrossRef - Adhikari, L.; Jana, K.; Behera, A.; Moitra, S. K.; J. Pharm. Pharm. Sci. 2010, 3, 136-139.
- Perez-Ruiz, T.; Martinez-Lozano, C.; Sanz, A.; Miguel, M. T. S.; J. Pharm. Biomed. Anal. 1997, 16, 249-254.
CrossRef - Shishehbore M. R.; Aghamiri, Z.; Iran. J. Pharm. Res. 2014; 12, 373-82,

This work is licensed under a Creative Commons Attribution 4.0 International License.
![]()
A New Edition of Web of Science
Journal Impact Factor
2022: 0.5
Five Year: 0.8
Journal is Indexed in

Cabells Whitelist
![]()


