Preparation and characterization of ZrO2/CeO2 ceramic composite synthesized by microwave combustion method
Hanan H. Abo-almaged*, Reham M. Khattab and Heba E. H. Sadek
Refractories, Ceramics and Building Materials Dept., National Research Centre (NRC), Dokki, 12622 Cairo, Egypt. Corresponding author Email: hanan-202@hotmail.com
DOI : http://dx.doi.org/10.13005/ojc/320126
Article Received on :
Article Accepted on :
Article Published : 01 Mar 2016
ZrO2 nano-powders with the substitution of; 5, 12 and 17 mole %CeO2 contents were prepared by a microwave combustion method utilizing Ce(NO3)3.6H2O, ZrN2O7.xH2O and urea as precursors. The obtained cakes were calcined at different temperatures. XRD, SEM, EDS, and TEM techniques were used to determine the effect of microwave and calcining temperature between 450 to 1000oC on the prepared powders. The results obtained show the formation of a single phase; a tetragonal solid solution with a particle size ranging between 10 to 20 nm. The densification parameters, phase compositions, microstructures and mechanical properties (micro-hardness) were investigated.
KEYWORDS:Microwave combustion method; ZrO2/CeO2 ceramic; XRD; nano particles; TEM; SEM
Download this article as:| Copy the following to cite this article: Abo-almaged H. H, Khattab R. M, Sadek H. E. H. Preparation and characterization of ZrO2/CeO2 ceramic composite synthesized by microwave combustion method. Orient J Chem 2016;32(1). |
| Copy the following to cite this URL: Abo-almaged H. H, Khattab R. M, Sadek H. E. H. Preparation and characterization of ZrO2/CeO2 ceramic composite synthesized by microwave combustion method. Orient J Chem 2016;32(1). Available from: http://www.orientjchem.org/?p=14458 |
Introduction
Recently, nano-materials have sparked a worldwide interest due to their unique physical and chemical properties. For their preparation, many techniques have been developed; such as co-precipitation, electro-deposition, sol–gel chemistry and the solvo-thermal route. Moreover, most of these processes are high-energy consuming and require expensive precursors. On the other hand, the conventional combustion methods (CCM) are self-sustained methods, making use of their own exothermic reaction for the mass production of various metal oxides [1-5]. However, microwave assisted combustion synthesis of materials has recently gained importance over the conventional heating ones in which the reactants interact with electro-magnetic energy and the rapid kinetic motion of the molecules that readily transfer and convert this energy into heat [1,5]. This results in the early phase formation of nano-particles, but with different morphologies in a relatively short time [1,6,7-11].
Several synthesis routes have been developed to produce nano-crystalline ZrO2 doped with CeO2 solid solution powders, which find application in various high-performance ceramic fields such as; catalyst, sensors and optical devices [12]. ZrO2 is characterized by its; excellent physical properties, high fracture toughness and thermal shock resistance [7,8]. In addition, the acid-base character of CeO2 doped ZrO2 is utilized as a catalyst to avoid the formation of olefins with internal double bonds and dehydrogenation of pure ketone [13, 14, 17-19]. Moreover, ceria-doped zirconia materials exhibit good activity for dehydration reactions [13,15-16].
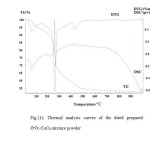 |
Figure 1 Click here to View figure |
The synthesis methodology and process conditions strongly influence on the performance of the acid–base properties of the respective used oxides [13,20,21-31]. The oxide powders produced by co-precipitation reactions are characterized by high specific surface area. However, these oxides show loss of surface area at elevated temperatures, which decrease their reactivity. On the other hand, the microwave assisted combustion process is an appending route, particularly for the preparation of multi-component oxide materials in a short time with high surface area products and uniform crystalline particle size at low temperature [32-34].
In the present study, we report on the synthesis of CeO2 doped ZrO2 solid solution oxides containing different mole % of CeO2 by a microwave combustion method. Phase composition, microstructure, hardness and fracture toughness of the sintered processed products were determined.
Experimental
Chemicals
All chemicals used in this study are of ANALAR grade. Cerium(III) nitrate hexa-hydrate (Ce(NO3)3.6H2O,Win.lab Ltd., 99.9% Ce), Zirconium(IV) oxynitrate hydrate (ZrN2O7.xH2O, Aldrich) and Urea (CH4N2O, Merck) were used. Water used was always bi-distilled.
Sample synthesis
Three cerium-zirconium mixtures were prepared with different cerium concentration; 5, 12 and 17 mole % of the mixture. Proportions of both salts [Cerium (III) nitrate hexahydrate and Zirconium (IV) oxynitrate hydrate] were dissolved separately in water and then mixed together. Solid urea as fuel with ratio equal to 1 : 1 of the reaction components was added to the mixture solution, and then stirred until a clear solution was obtained. The mixtures were introduced into a microwave oven at 300°C at 900-Watt power and frequency of 245 GHz for 30 minute at ambient pressure.
The obtained powders were calcined in electrically-heated muffle furnace at 450, 800 and 1000°C for one hour at 10°C/min heating rate. For densification parameters, the powders calcined at 450°C were uni-axially pressed at 100 MPa to obtain pellets of 2.5 cm in diameter and 1 cm in thickness. Then the compacted pellets were fired at 1600°C for 2h in air.
Characterization methods
Differential thermal analysis (DTA) and Thermogravimetry (TGA) were carried out using a Setaram Labsy TM TGDTA16 system.
The main phases in the prepared mixtures were identified by X-ray diffraction equipment; Bruker D8 Advance-Germany using a Ni filter, Copper Target, at V=40 kV and A=40 mA. The crystalline size, DXRD was calculated according to the Scherer equation: DXRD = 0.9λ / B cosθ, where λ is the wavelength of the radiation, θ is the diffraction angle and B is the corrected half-width of the diffraction peak.
The FTIR spectra of the prepared powders as received before and after calcinations at different temperatures between 450-1000oC, were scanned in the range of 4000 to 400 cm-1, utilizing an Infrared Spectrometer type (MB154S, Bomem, Quebec, Canada).
Transmission electron microscopy (TEM) model (JEOL, JEM-1230, Tokyo, Japan) was used to characterize morphology and particle size of the prepared powders.
Scanning electron microscopy (SEM) model Philips XL30 was used to examine the prepared powder as received and the microstructure of the processed pellets fired at 1600°C after coating with a gold thin films.
Densification parameters in terms of bulk density and apparent porosity of the processed pellets were determined by Archimedes method according to ASTM C20-00.
Micro-hardness was determined using Vickers’s indentation method with a load of 1 kg and dwell time of 15 sec. The surface-projected diagonals of the indented area were observed by optical microscope and the hardness was calculated, as average of five readings.
Result and Discussion
Thermal analysis
The DTA and TGA curves of the dried ZrO2/CeO2 solid solution powders after treatment by microwave combustion method MCM are shown in Fig.1. Several thermal features took place during the heating of the sample. The DTA curve shows a small endothermic peak occurring at 57.4°C accompanied with a weight loss of 9.66% in the TGA curve that attributed to the evaporation of the physically adsorbed water [35, 36]. Two sharp peaks followed; the first is an exothermic at 254.2°C while the second is an endothermic one taking place at 261.1°C, attributed to a total weight loss of 35.63% due to successive decomposition of the organo-zirconia-ceria complex product of the reaction, and further the carbon evolution. Finally, a very weak endothermic peak could also be seen on TGA curves at 425.8°C without any weight loss related to the formation of the solid solution ZrO2/CeO2 tetragonal phase (Ref?.)
Phase composition after microwave and heat treatment
The X-ray diffraction patterns of the prepared powders of ZrO2/CeO2 solid solution after microwave treatment and calcination at different temperatures are shown in Figs (2, 3 and 4). The XRD patterns showed the formation of two phases of ZrO2/CeO2 solid solution tetragonal structure namely: Zr0.88Ce0.12O2 in 5 mole % of CeO2 mixture and Zr0.82Ce0.18O2 in the 12 and 17 mole % of CeO2 mixtures, respectively. XRD peaks of the as prepared powders; before the calcination process, showed two broad peaks: occurring between 2θ: 24 to 36 and 2θ: 46 to 53 as seen in 5 mole % CeO2 mixture. This indicates the ill-crystallization of the very fine particle size of the product. The formation of the tetragonal phase in all mixtures is attributed to the very fine size of the crystallites produced not exceeding the critical limit. The transformation of ZrO2 into the different polymorphic phases is based on the crystal size of the powder [34]. Raising the calcining temperature from 450 to 1000oC, caused the change in the degree of sharpness of the peaks corresponding to both Zr0.88Ce0.12O2 and Zr0.82Ce0.18O2 reflecting the well crystallization of the product accompanied by an increase in the crystallite size reported in (Table 1).
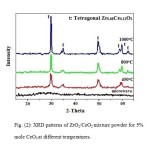 |
Figure 2 Click here to View figure |
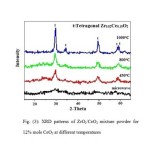 |
Figure 3 Click here to View figure |
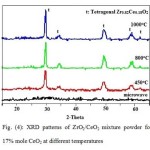 |
Figure 4 Click here to View figure |
FTIR
The main bands in the FTIR spectra of the powder containing 12 % mole, after microwave treatment and those calcined at different temperatures: 450, 800 and 1000 as well as that fired at 1600°C, are shown in Fig. 5.
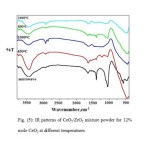 |
Figure 5 Click here to View figure |
FTIR spectra of the prepared powders after microwave treatment, exhibit a broad absorption band around 3747-3697b cm-1 assigned to υ(NH) stretching vibration of the urea. Bands at 1741-1740s cm-1 represent the stretching vibration of the urea carbonyl group. Bands at 1542-1516m cm-1 are assigned to δ(NH) bending vibration. Bands corresponding to C-N stretching, are found at 1460-1465 cm-1. Strong bands appear at ~ 1040 cm-1 related to C-O stretching vibrations in the fingerprint region [40]. The intensity of all these bands decreased with increasing the calcination temperature due to the combustion of the organic part. Bands observed at 3436-3448 cm-1 and 1632-1648 cm-1 are assigned to the stretching and bending vibrations of the O-H bond related to the formation of hydroxyl carbonate complex species [41]. The formation of tetragonal solid solution phase [42] and a distortion of the unit cell in ZrO2/CeO2 mixed oxides [43] is characterized by the band found at ~ 566 cm-1. However, weak bands for monoclinic phase appear at 744 and 444 cm-1 at 12% Zr/Ce mixture fired at 1600°C [44].
TEM
A high-resolution TEM image of 12 mole % of ZrO2/CeO2 powder after microwave treatment and nanoparticles configured by the SAED pattern were shown in Fig.6 (a and b). Particles took a rosette form resulting from the multiple crystalline growths from a single nucleus with an average size lie in the nano range between 10 to 20 nm.
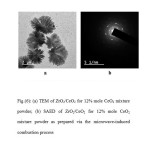 |
Figure 6 Click here to View figure |
Microstructure analysis of microwave sample
The microstructure of the ZrO2/CeO2 solid solution powders prepared via the microwave combustion method is demonstrated in Fig. 7. The grains showed a kind of zoning with a change in the hue corresponding to a change in composition. Grains of ZrO2/CeO2 MCM were analyzed by means of energy dispersive X-ray analysis (EDS) and gave the following results in Fig.7 (a and b). The light particles (b) contain a higher percent of CeO2 than ZrO2. While the dark particle (a) represent a single phase with the highest percent of ZrO2.
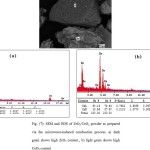 |
Figure 7 Click here to View figure |
XRD of the sintered ZrO2-CeO2 ceramics
The XRD patterns of the ZrO2/CeO2 ceramics sintered in air at 1600°C for 2h are shown in Fig. 8. Mixtures of ZrO2 containing 5 and 12 mole % CeO2 are actually formed of two polymorphic forms; a monoclinic (m) and a tetragonal phase (t). The increase in the proportion of CeO2 from 5 to 12 mole % CeO2, caused a change in the lattice constants of the tetragonal phase to convert to the monoclinic one.
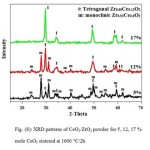 |
Figure 8 Click here to View figure |
On the other hand, it is found that 17 mole % CeO2 is sufficient to obtain a fully stabilized tetragonal phase (t). This result is attributed to the increasing amount of CeO2 that lessen the amount of metastable transformable tetragonal (t) phase and raised thereby the proportion of non-transformable tetragonal (t`) phase.
Microstructure of sintered bodies
SEM of the thermally etched bodies fired at 1600°C processed from the different mixtures containing; 5, 12 and 17 mole % ZrO2/CeO2 are shown in Figs.9 (a-c), respectively. The microstructures show the overwhelming of uniform spherical grained texture with minute pores scattered in the matrix and elongated shaped grains depicted along the micro-cracks and around pores as shown in Fig 9 (a and b) for 5 and 12 mole % samples. Moreover the latter composite showed the grains occurring in patches Fig 9 (b). SEM of composite with 17 mole % of CeO2 showed the spherical uniformed grains are arranged in parallel lines, whereas the elongated ones are scarce beside the presence of ex-solution of excess CeO2 appearing as white spherical grains as seen in Fig. 9 (c).
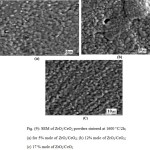 |
Figure 9 Click here to View figure |
Densification parameters
The values of bulk density and apparent porosity determined for the processed pellets from the synthesized powders and fired at 1600oC/2h, in Table 2 are affected by the ceria content. Low CeO2 content gave more porous bodies. On the other hand, the addition a higher proportion of ceria, led to better densification.
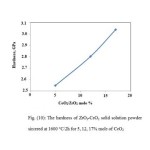 |
Figure 10 Click here to View figure |
Microhardness
The values of micro-hardness of the processed ZrO2/CeO2 ceramic pellets fired at 1600oC/2h in Fig.10. are affected by the content of CeO2 in the composition. Composite with 5% CeO2 gave the lowest hardness value attributed to the less densification of the product and the presence micro-cracks. Whereas, the micro-hardness of the Composite containing 12 mole % CeO2, was less compared with that of 17 mole %CeO2.
Discussion
The present microwave combustion method encouraged the formation of a single phase with nano size powders. The high temperature produced during the process, facilitate the hydrolysis of urea to form (CO) and (NH) ions with the destruction of the nitrate salts to liberate (Ce3+, Zr4+ ) cat ions that form complex species in the presence of water. The complex reacts with the carbonate anion, to produce a single phase; a hydroxyl carbonate. Upon raising the temperature to 300°C, this phase decomposes into a single phase oxide like Zr0.88Ce0.12O2 and Zr0.82Ce0.18O2 [9,37-39].
The above, the microwave process is effective in improving the behaviour of the and calcined powders with fine particle size, high specific surface area and small crystallite size in the range between 0.9 to 11nm as compared with those given by other workers in the field; by Yen-Pei Fu et al; 8 to 16 nm. [9] and by S. C. Sharma et al. 22 to 24 nm[33].
The presence of CeO2 tends to stabilize the tetragonal zirconia phase. The added Ce3+ enter the zirconia lattice partially substituting the Zr4+, either by reducing the free energy of the tetragonal phase or increasing the constraints on phase transformation [45]. The presence of the monoclinic phase in mixtures containing 5 and 12 mole % of CeO2 at high temperature is due to the increase in the grain size that enhanced the transformation of the tetragonal to the monoclinic phase [46, 47]. The transformable tetragonal phase (t) takes place at a critical crystallite size of ~ 22 nm to the monoclinic phase as seen in Table 1.
According to pervious work, fracture toughness and strength increase with increasing in the amount of transformable tetragonal phase in the ceramic and thereafter decrease in transformable tetragonal phase and increase in non transformable tetragonal phase with further increase in ceria concentration. Thus the specimens containing 12 mole % of CeO2 exhibit high fracture toughness as the tetragonal phase partially transformed to the monoclinic under the applied stress. The micro-cracks accompanying the transformation process are responsible for these values by inhibiting the crack propagation at the indent. [48,49]. The increase in the transformable tetragonal phase resulted in the increase of the amount of stress-induced transformation due to the plastic deformation zone formed around the indent [50]. Moreover, composite containing 17 mole % CeO2 showed high hardness value, which is attributed to the better densification of the body with the excess ceria added compared with 12 mole % CeO2 composite. The excess CeO2 segregated on the grain boundary of the grains closing the pores and reducing the grain size of the sintered specimen [47].
Conclusion
The present study succeeded in the preparation of very fine tetragonal single solid solution powders stable at different temperature 450, 800 and 1000°C, utilizing ZrO2 ceramic containing different CeO2 contents; 5, 12 and 17 mole % by microwave-assisted combustion method. The particle size of the grains after microwave treatment ranged between 10 to 20 nm that enhance the retained stability of the tetragonal structure at different temperature. The prepared zirconia-with 17% ceria ceramic composites showed high bulk density of (6.11g/cm3) and mechanical proprieties (0.68 % ) that can be applied for high performance ceramics. Composites containing 12 % CeO2 showed a high fracture toughness behavior attributed to the presence of transformed tetragonal solid solution to monoclinic phase under the applied stress that inhibits the initiation of cracks.
Acknowledgments
The authors wish to thank Professor Doreya M.Ibrahim Professor of Ceramics at Refractory and Building Materials Dept., National Research Centre, Cairo, Egypt, for her valuable help and her consistent advices.
References
- Clament, S. S. N.; Manikandan, A.; John Kennedy, L.; Judith, V. J. J. Colloid. Interf. Sci. 2013, 389, 91-98.
CrossRef - Deshpande, K.; Mukasyan, A.; Varma, A. Chem. Mater. 2004, 16, 896-4904.
- Tao, X. Y.; Wang, X. N.; Li, X. D. Nano Lett. 2007, 7, 3172-3176.
CrossRef - Morales, W.; Cason, M.; Aina, O.; Tacconi, N. R. D.; Rajeshwar, K. J. Am. Chem. Soc.2008, 30, 6318-6319.
CrossRef - Wu, J. M.; Wen, W. Envi. Sci. Technol. 2010, 44, 9123-9127.
CrossRef - Aslan, K.; Geddes, C. D.; A review of an ultrafast and sensitive bioassay platform technology. 2008, 3, 89-101.
- Mangalaraja, R. V.; Mouzon, J., Hedstrom, P.; Camurri, C. P.; Anantha kumar, S.; Oden, M. Powder Technol. 2009,191, 309-314.
CrossRef - Mohebbi, H.; Ebadzadeh, T.; Hesari, F. A. Powder Technol. 2009, 188, 183-186.
CrossRef - Yen-Pei, F.; Shao-Hua, H.; Biing-Lang, L. Ceram. Int. 2009, 35, 3005-3011
CrossRef - Hahn, H. J. Mater. Res. 1990, 5, 609-614.
CrossRef - Zhou, Y. C.; Rahaman, M. N. J. Mater. Res. 1993, 8, 1680-1686.
CrossRef - Freris, I.; Riello, P.; Enrichi, F.; Cristofori, D.; Benedetti, A. Opt. Mater. 2011, 33, 1745-1752
CrossRef - Benjaram, M. R.; Gunugunuri, K. R.; Lakshmi, K. J. Molec. Cat. A: Chemical. 2010, 319, 52-57.
CrossRef - Auroux, A.; Artizzu, P.; Ferino, I.; Monaci, R.; Rombi, E.; Solinas, V.; Petrini, G. J. Chem. Soc. Faraday Transactions. 1996, 92, 2619-2624.
CrossRef - Reddy, B. M.; Thrimurthulu, G.; Bharali, P.; Saikia, P. J. Molec. Cat. A: Chemical. 2007, 275, 167-173.
CrossRef - Reddy, B. M.; Lakshamanan, P.; Bharali, P.; Saikia, P. J. Molec. Cat. A: Chemical. 2006, 258, 355-360.
CrossRef - Cutrufello, M. G.; Ferino, I.; Solinas, V.; Primavera, A.; Trovarelli, A.; Auroux, A.; Picciau, C. Chem. Phys. 1999, 1, 3369-3375.
CrossRef - de Leitenburg, C.; Trovarelli, A.; Zamar, F.; Maschio, S.; Dolcetti, G.; Llorca, J. J. Chem. Soc. Chem. Comm. 1995, 21, 2181-2182.
CrossRef - Trovarelli, A.; Zamar, F.; Llorca, J.; de Leitenburg, C.; Dolcetti, G.; Kiss, J. T. J. Catal. 1997, 169, 490-502.
CrossRef - Sergent. N.; Lamonier. J. F.; Aboukais, A. Chem. Mater. 2000, 12, 3830-3835.
CrossRef - Terrible, D.; Trovarelli, A.; Llorca, J.; De Leitenburg, C.; Dolcetti, G. J. Catal. 1998, 178, 299-308.
CrossRef - Garcia, M. F.; Arias, A. M.; Jues, A. I.; Belver, C.; Hungrfa, A. B.; Conesa, J. C.; Soria, J. J. Catal. 2000, 194, 385-392.
CrossRef - Hirano, M.; Kato, E. J. Ceram. Soc. Jap. 1996, 104, 958-962.
CrossRef - Mani, T. V.; Varma, H. K.; Damodaran, A. D.; Warrier, K. G. K. Ceram. Int. 1993, 19, 125-128.
CrossRef - Izu, N.; Murayama, N.; Shin, W.; Matsubara, I.; Kanzaki, S. Jap. J. Appl. Phys. 2004, 43, 6920-6924.
CrossRef - Bai, W.; Choy, K. L.; Stelze, N. H. J.; Scoonman, J. J. Solid State Ion. 1999, 116, 225-228.
CrossRef - Kim, J.; Myeong, W.; Ihm, S. Appl. Catal. B: Environmental. 2007, 71 (1-2), 57-63.
CrossRef - Reddy, B. M.; Reddy, G. K.; Khan, A.; Ganesh, I. J. Mater. Sci. 2007, 42, 3557-3563.
CrossRef - Reddy, B. M.; Reddy, G. K.; Ganesh, I.; Ferreira, J. M. F. J. Mater. Sci. 2009, 44, 2743-2751.
CrossRef - Bhaduri, S.; Bhaduri, S. B.; Zhou, E. J. Mater. Res. 1998, 13, 156-165.
CrossRef - Sharma, C.; Gokhale, N. M.; Dayal, R.; LAL, R. B. Mater. Sci. 2002, 25, 15-20.
CrossRef - Yarong, W.; Toshiyuki, M.; Ji-Guang, L.; Yoshiyuki, Y. Sci. Technol. Adv. Mater. 2003, 4, 229-238.
CrossRef - Laobuthee, A.; Wongkasemjit, S.; Traversa, E.; Laine, R. M. J. Euro. Ceram. Soc. 2000, 20, 91-97.
CrossRef - Hasin, P.; Koonsaeng, N.; Laobuthee, A. Int. J. Sci Technol. 2008, 2/1, 140-149.
- Mustafa, E. A. J. Ceram. Int. 2000, 26, 215-220.
CrossRef - Abbas, H. A.; Hamad, F. F.; Mohamed, A. Kh.; Hanafi, Z. M.; Kil ,M. Diff. Fundamentals. 2008, 8, 7.1- 7.8.
- Lin, J.-D.; Duh, J.-G. J. Am. Ceram. Soc. 1998, 81, 853-860.
CrossRef - Stuart, B. Modern infrared spectroscopy, John Wiley and Sons, Dartford, 1996, 105-107.
- Gadsden, J. A. Infrared spectroscopy of mineral and related inorganic compounds, Butterworths, 1975, 16-24.
- Heshmatpour, F.; Aghakhanpour, R. B. Powder Technol. 2011, 205, 193-200.
CrossRef - Damyanova, S.; Pawelec, B.; Arishtirova, K.; Martinez-Huerta, M. V.; Fierro, J. L. G. J. Appl. Catal. A: General. 2008, 337, 86-96.
CrossRef - Qian, Z.; Shi, J. L. J. Nano struct. Mater. 1998, 10, 235-244.
CrossRef - Hannink, R. H. J.; Swain, M. V. J. Mater. Sci. 1981, 16, 1428-1431.
CrossRef - Tani, E.; Yoshimura, M.; Somiya, S. J. Am. Ceram. Soc. 1983, 66, 506-510.
CrossRef - Jenq-Gong, D.; Hsing-Tao, D.; Wei-Yuung, H. J. Mater. Sci. 1998, 23, 2786-2791.
- Bhabani, S. S. Master Thesis, department of metallurgical and materials engineering, National Institute of Technology, Rourkela, May 2007.
- Koji, T. J. Mater. Sci. 1985, 20, 1178-1184.
CrossRef - Reddy, B. M.; Lakshmanan, P.; Bharali, P.; Saikia, P.; Thrimurthulu, G.; Muhler, M.; Gruenert, W. J. Phys. Chem. C. 2007, 111, 10478-10483.
CrossRef

This work is licensed under a Creative Commons Attribution 4.0 International License.
![]()
A New Edition of Web of Science
Journal Impact Factor
2022: 0.5
Five Year: 0.8
Journal is Indexed in

Cabells Whitelist
![]()


