Physico-chemical Quality and Efficiency Study of Textile and Garments Effluent
Biddut Chandra Sarker1*, Md. Abdul Baten1,Md. Ekram Ul Haque2, Ahmed Hossain3, Md. Zahedul Hasan1 and Shikha Sarker4
1Department of Environmental Science, Bangladesh Agricultural University, Mymensingh-2202, Bangladesh
2Soil Science Division, Bangladesh Institute of Nuclear Agriculture (BINA), Mymensingh-2202, Bangladesh
3Department of Biotechnology, Bangladesh Agricultural University, Mymensingh-2202, Bangladesh
4Department of Textile Engineering, City University, Dhaka-1216, Bangladesh
Corresponding Author Email: biddutsarker.bau@gmail.com
DOI : http://dx.doi.org/10.13005/ojc/320131
Article Received on :
Article Accepted on :
Article Published : 23 Feb 2016
The objective of this study was to ascertain textile and garments effluents’ quality parameters and suitability for irrigation and aquaculture. Concentration of different parameters i.e. pH, temperature, color, odor, electrical conductivity (EC), dissolved oxygen (DO), total dissolved solids (TDS) and concentration of ionic constituents viz. Na+, K+, Ca2+ and PO42- of effluents were investigated in Bhaluka industrial area of Mymensingh, Bangladesh during August to November, 2013. Study revealed that there were distinct variations in values of different parameters. Among the samples, pH values ranged from 7.5 to 9.8 indicating alkalinity of water. Temperature (26.8-30.2oC) was found within permissible expelling limits. Observed color and odor of the effluents indicated poor quality to use for irrigation and aquaculture purposes. EC value (94.87- 365.58 µScm-1) indicated low salinity level of the effluents. DO was within the range of 0.30 to 1.3 mg/L indicating aquatic life was under stress. Considering TDS (53.68 to 267.05 mg/L), all the samples were rated as fresh water (<1000 mg/L). Ratios of mean concentrations to background values were ranked in this sequence: Na+> K+> PO43-> Ca2+. Overall study revealed that due to imbalance in values of different water quality parameters all of the samples were unsuitable for irrigation and aquaculture.
KEYWORDS:Effluent; Water; Physico-chemical Quality; Irrigation; Aquaculture; Suitability; Textile and Garments
Download this article as:| Copy the following to cite this article: Sarker B. C, Baten M. A, Ul Haque M. E, Hossain A, Hasan M. Z, Sarker S. Physico-chemical Quality and Efficiency Study of Textile and Garments Effluent. Orient J Chem 2016;32(1). |
| Copy the following to cite this URL: Sarker B. C, Baten M. A, Ul Haque M. E, Hossain A, Hasan M. Z, Sarker S. Physico-chemical Quality and Efficiency Study of Textile and Garments Effluent. Orient J Chem 2016;32(1). Available from: http://www.orientjchem.org/?p=14171 |
Introduction
Rapid industrialization and direct discharge of industrial effluents as wastewater affects environment and exert pollution load in surrounding water bodies (Munnaf et al., 2014). It has been reported that industrial effluent has hazardous effect on water quality, habitat and complex effects on flowing waters (Ethan et al., 2003). Industrial wastes and effluents contain toxic and hazardous substances which are detrimental to human health and are considered as threats to the existence of human being (Islam et al., 2012, Jimena et al., 2008, Rajaram and Das, 2008 and Ogunfowokan et al., 2005).
Industrial effluents are a main source of direct and often continuous input of pollutants into aquatic ecosystems with long-term implications on ecosystem functioning (Lah et al., 2004; Smolders et al., 2004; Chan et al., 2003; Odeigah and Osanyipeju, 1995). The effluents also include detergents those create a mass of white foam in the surface waters. The World Bank have identified 72 toxic chemicals in our water solely from textile dyeing, 30 of which are cannot be removed (Munnaf et al., 2014). All these chemicals are quite harmful or even fatally toxic to fish (Kumar, 1996) and other aquatic populations (Chakravarty et al., 1959). In Bangladesh unplanned industrialization along with insufficient use of ETP and direct discharge of wastewater into nearby water bodies make the surface water more polluted (Sultana et al., 2009) and create harmful effects on public health, livestock, aquatic life and wildlife (Ugochukwu and Leton, 2004; Haque et al., 2002).
It is well established that pollution lowers the quality of life in various aspects and affects health and life span (Grover and Kaur, 1999). Water pollution caused by industrial effluent discharges has become a worrisome phenomenon due to its impact on environmental health and safety (Sarker et al., 2015; Sarker, 2013; Lokhande, 2011). Due to proliferation of textile, pharmaceutical and other industries in Bhaluka Upazila, a large amount of industrial chemicals and wastes are generated every day which are dumped into the adjacent water bodies. As industrialization and urbanization of Bhaluka are surging at faster rate than other areas of Mymensingh district, it becomes important to be aware of water quality as it affects overall environment. Therefore, this study was undertaken to evaluate significant environmental parameters of effluents of Bhaluka industrial area.
Materials and Methods
Study area
The study area (Fig. 1) was located in Habirbari union of Bhaluka upazila (latitude 24.3750ºN and longitude 90.3778°E) (Banglapedia, 2009). Study involved sampling of effluents from outlets of 6 industries (Table 1) and at 6 selected points along the receiving streams (Fig. 2).
 |
Figure 1: Map showing the study area of Bhaluka upazila (Modified from Banglapedia, 2009) Click here to View figure |
Sampling
The waste water samples were collected during September 2013 from 12 stations of surrounding industrial aquatic environment (directly from the outlet of the factory linked to the canal). Twelve samples were collected for physico-chemical analysis at a distance of about 50 meters from each other. The samples were collected using 100 ml sampling bottles clamped to the pole from estimated centre of the main flow considering full height of water column (about 5 cm). Sampling points were designed in relation to industries as depicted by Fig. 2.
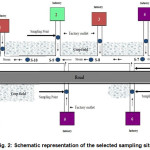 |
Figure 2: Schematic representation of the selected sampling sites |
Analytical procedures
Analysis of different parameters was done at the central laboratory of Bangladesh Agricultural University and soil science laboratory of Bangladesh Institute of Nuclear Agriculture, Mymensingh, Bangladesh. Water color was observed by naked eyes and odor was felt by nose during collection. The pH value of water samples was measured by pH meter (WTW pH 522, Germany) as mentioned by Singh and Parwana (1999). Temperature was noted at the site of sampling using portable calibrated mercury thermometer (EPA, 1999 and 1998). EC and TDS were determined by conductivity meter following the procedure of Richard (1954). DO of the samples was measured with the help of DO meter (YSI, Model 58, USA).
In case of ionic constituents, calcium was determined by EDTA titrimetric method using Na2EDTA as a chelating agent (Singh and Parwana, 1999; Page et al., 1982). Phosphorus content was determined colorimetrically by stannous chloride (SnCl2) method according to the procedure outlined by APHA (1995). Flame emission spectrophotometer (Jenway PEP7, UK) was used to determine potassium and sodium contents of the samples.
Data Analysis
The SPSS and Microsoft Office Excel software were used for data analysis. Various descriptive statistical measures were used for categorization and describing the variables.
Results and Discussion
Industrial effluent analysis
The pH values (Table 1) ranged from 7.5 to 9.8 with a mean value of 8.59, indicating alkalinity of the effluents. The pH of some samples fluctuated from average value because these industries dealt with different processes using different chemicals which might be responsible for this fluctuation. The observed pH value of the samples exceeded the range of fish culture standard (Meade, 1998), reflecting its unsuitability for aquatic life and for all types of water use. According to Ayers and Westcot (1985), most of the samples were problematic for long-term irrigation where the acceptable value for irrigation ranged from 6.5 to 8.4. Wastewater temperature (26.8-30.2oC) revealed that it was moderately standard; thereby indicating values within the permissible limits of dumping. Colors of the samples were mauve, dark mauve, grey, brown, dark brown or black (Fig. 3 and Table 1).
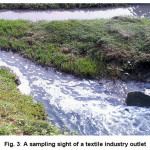 |
Figure 3: A sampling sight of a textile industry outlet Click here to View figure |
Therefore, the wastewater was unsuitable not only for aquaculture but also for agriculture. Unpleasant odor generated from effluents indicated that the water was unsuitable for aquatic ecosystem and human health.
Table 1: Physicochemical characterization of effluent samples
| S. No. |
Temp (oC) |
Color |
Odor |
pH |
TDS |
EC |
DO |
|
mg/L |
µS/cm |
mg/L |
|||||
|
1 |
30.2 |
Brown |
Fishy |
7.95 |
162.8 |
269.70 |
0.32 |
|
2 |
29.8 |
Light Brown |
Foul |
8.75 |
86.48 |
160.89 |
0.50 |
|
3 |
29.2 |
Light Brown |
Pungent |
8.85 |
53.68 |
94.870 |
0.49 |
|
4 |
29.1 |
Brown |
Fishy |
9.80 |
89.67 |
176.97 |
0.51 |
|
5 |
27.2 |
Grey |
Pungent |
7.50 |
267.05 |
357.54 |
0.69 |
|
6 |
29.3 |
Clear |
Foul |
8.72 |
156.05 |
365.58 |
0.30 |
|
7 |
26.8 |
Mauve |
Pungent |
7.69 |
213.46 |
315.63 |
0.76 |
|
8 |
28.7 |
Dark mauve |
Fishy |
8.34 |
158.07 |
266.00 |
0.37 |
|
9 |
28.3 |
Mauve |
Pungent |
9.00 |
204.76 |
328.00 |
0.64 |
|
10 |
28.9 |
Light Mauve |
Pungent |
8.85 |
200.34 |
312.54 |
0.50 |
|
11 |
27.5 |
Dark brown |
Pungent |
9.05 |
169.98 |
258.78 |
0.90 |
|
12 |
26.9 |
Black |
Fishy |
8.66 |
119.06 |
250.48 |
1.30 |
|
Max. |
30.2 |
_ |
_ |
9.80 |
267.05 |
365.58 |
1.30 |
|
Min. |
26.8 |
_ |
_ |
7.50 |
53.68 |
94.870 |
0.30 |
|
Mean |
28.49167 |
_ |
_ |
8.59 |
156.78 |
263.08 |
0.606 |
|
SD |
1.146107 |
_ |
_ |
0.63 |
61.26 |
82.700 |
0.282 |
Electrical conductivity (EC) of collected water samples (Table 1) were within the range of 94.87 to 365.58 µS cm-1 with an average of 263.082 µS cm-1 indicating low salinity. TDS concentration of the sampling points ranged from 53.68 to 267.05 mg/L with the mean value of 156.78 mg/L(Table 1). All of the analyzed samples (1-12) possessed lower TDS concentration than the standard value (500 mg/L). The degree of relationship between EC and TDS of the water samples showed that TDS concentration was increasing proportionally with EC value (Fig. 4). The value of EC and TDS had a significant positive relationship at 1% level of significance. As total concentration of dissolved solids in water is a general indication of its suitability for irrigation and aquaculture purpose, observed results indicated suitability of this water for irrigation (Ayers and Westcot, 1976) and aquaculture (Meade, 1998) on the basis of TDS concentration alone.
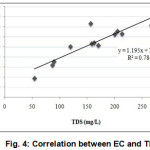 |
Figure 4: Correlation between EC and TDS |
DO of collected effluent samples were within the range of 0.3 to 1.3 mg/L with an average of 0.60 mg/L (Table 1). DO content of the samples was much lower than the standard (ADB, 1994). This lower value of DO was because water used in these industries underwent different processes in high temperature. Temperature decreases DO of water (MiCorps, 2014; MPCA, 2009). High correlations between water parameters reflect the fact that these parameters had similar pollution source (Armah et al., 2010). Significant negative correlation existed between available pH and TDSat 5% level of significance (Fig. 5).
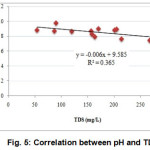 |
Figure 5: Correlation between pH and TDS |
Concentration of DO and temperature had a significant negative relationship at 1% level of significance (Fig. 6). Correlation between pH and temperature shows significant positive relationship which means mutual increase of the values (Fig. 7).
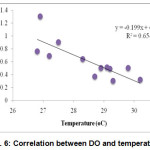 |
Figure 6: Correlation between DO and temperature |
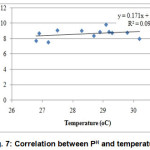 |
Figure 7: Correlation between PH and temperature Click here to View figure |
Ionic constituents
Phosphate content of the samples varied from 1.89 to 10.67 mg/L.Among all, most of the samples (91.66%) exceeded permissible limit of irrigation water (Ayers and Westcot, 1985) which proves unsuitability of the effluents for irrigation.
Calcium content in effluent samples varied from 0 to 8.08 mg/Lwith an average value of 2.075 mg/L(Table 2). Irrigation water containing less than 20 me/L(800 mg/L) of Ca is suitable for irrigating crops (Ayers and Westcot, 1985). On the basis of Calcium content, all effluent samples could safely be used for irrigation without affecting soil.
Table 2: Concentration of Ca2+, Na+, K+ and PO43- (mg/L) in effluents
|
Sample ID |
Ca2+ |
Na+ |
K+ |
PO43- |
|
1 |
Trace |
57.35 |
26.30 |
9.58 |
|
2 |
2.07 |
51.97 |
24.20 |
8.49 |
|
3 |
2.80 |
62.71 |
22.80 |
3.41 |
|
4 |
Trace |
57.23 |
17.30 |
10.67 |
|
5 |
0.39 |
36.58 |
6.40 |
1.89 |
|
6 |
8.08 |
67.46 |
8.90 |
3.34 |
|
7 |
4.14 |
75.33 |
23.04 |
3.97 |
|
8 |
2.06 |
75.17 |
14.60 |
3.05 |
|
9 |
5.12 |
83.77 |
11.50 |
3.63 |
|
10 |
Trace |
62.36 |
26.28 |
2.68 |
|
11 |
0.24 |
82.01 |
23.04 |
4.75 |
|
12 |
Trace |
79.14 |
23.44 |
3.18 |
|
Max. |
8.08 |
83.77 |
26.30 |
10.67 |
|
Min. |
Trace |
36.58 |
6.40 |
1.89 |
|
Mean |
2.075 |
65.92 |
18.98 |
4.88 |
|
SD |
2.5858 |
14.0004 |
7.0025 |
2.9481 |
Study result revealed that concentration of available Na+, Ca2+; K+, Na+ and PO43-, K+ in the samples had a significant positive relationship. On the contrary, concentration of available Ca and PO4 showed a significant negative relationship (Table 3).
Table 3: Pearson correlation coefficients matrix of metal ion concentrations (n = 12)
|
Parameters |
Ca2+ |
Na+ |
K+ |
PO43- |
|
Ca2+ |
1 |
|||
|
Na+ |
0.292 |
1 |
||
|
K+ |
-0.474 |
0.170 |
1 |
|
|
PO43- |
-0.290 |
-0.254 |
0.355 |
1 |
Concentration of Na varied from 36.58 to 83.77 mg/L with the mean value of 65.92 (Table 2). According to Ayers and Westcot (1985), measured Na content in all of the effluent samples were far below the specified limit. In respect of Na content, all samples could be safely applied for long–term irrigation without any harmful effect.
On the other hand, K concentration in the samples varied from 6.4 to 26.3 mg/L with the mean value of 18.98 mg/L (Table 2). Among 12 wastewater samples, the ratios of mean concentrations to background values were ranked in the order: Na+> K+> Ca2+ (Table 2).
Conclusion
The analysis showed that all effluents contained acceptable temperature and concentration of EC, Ca, Na, K, whereas due to presence of one or several incongruities among tested parameters viz. pH, color, odor, TDS, DO, PO4, were proven unsuitable for aquaculture and irrigation. Therefore, considering all of these facts, wastewater samples of the present study could not be utilized for irrigation and aquaculture purposes because several properties were proven unsuitable for plants and aquatic lives.
Acknowledgement
The authors are thankful to scientists of soil science division, Bangladesh Institute of Nuclear Agriculture (BINA), Mymensingh, Bangladesh, for providing us with laboratory facilities for chemical analyses.
References
- ADB (Asian Development Bank), Training Manual for Environmental Monitoring, Engineering Science Inc., USA, 1994, 2-16
- APHA (American Public Health Association), Standard Methods for the Examination of Water and Wastewater, 19th edition. Washington: American Public Health Association, 1995
- Armah, F. A.; Obiri, S.; Yawson, D. O.; Onumah, E. E.; Yengoh, G. T.; Afrifa, E. K.; Odoi, J. O., Journal of Environmental Science and Health Part A, 2010, 45(13), 1804-1813
CrossRef - Ayers, R.S.; Westcot, D.W., Water Quality for Agriculture. FAO irrigation and drainage paper, 1976, 29(1), 4096
- Ayers, R.S.; Westcot, D.W. Water Quality for Agriculture. FAO irrigation and drainage paper, 1985, 29
- Banglapedia, National Encyclopedia of Bangladesh, Asiatic Society of Bangladesh, 2009
- Chakrabarty, R. D.; Roy, P.; Singh, S. B., Indian Journal of Fisheries, 1959, 6(1), 186-203
- Chan, Y.K.; Wong, C.K.; Hsieh, D.P.H.; Lau, T.K.; Wong, P.K., Environmental Toxicology, 2003, 18(5), 312- 316
CrossRef - EPA (Environmental Protection Agency), Methods for chemical analysis of industrial effluents, USA, 1998
- EPA (Environmental Protection Agency), Wastewater Treatment Manuals: Treatment Systems for Small Communities, Business, Leisure Centers and Hotels, Ireland, 1999
- Gana, J. M.; Ordóñez, R.; Zampini, C.; Hidalgo, M.; Meoni, S.; Isla, M. I., Journal of Hazardous Materials, 2008, 155(3), 403-406
CrossRef - Grover, I. S.; Kaur, S., Mutation Research/Fundamental and Molecular Mechanisms of Mutagenesis, 1999, 426(2), 183-188
CrossRef - Haque, S.; Yasmin, H.; Rahman, M. H., Environmental pollution in Bangladesh, Earth Community Organization (ECO), 2002, 38-47
- Islam, M. S.; Chowdhury, M. A. H.; Billah, M. M. S.; Tusher, T. R.; Sultana, N., Bangladesh Journal of Environmental Science, 2012, 23, 123-130
- Kumar, A., Pol. Arch. Hydrobiol., 1996, 18(4), 469-476
- Lah, B.; Gorjanc, G.; Nekrep, F. V.; Marinsek-Logar, R., Bulletin of environmental contamination and toxicology, 2004, 72(3), 607-616
CrossRef - Meade, J. W., Aquaculture management, India: CBS Publishers and Distributors, 1998, 9
- Munnaf, A.; Islam, M. S.; Tusher, T. R.; Kabir, M. H.; Molla, M. A. H., Journal of Environmental Science and Natural Resources, 2014, 7(1), 257-263
- Lokhande, R. S.; Singare, P. U.; Pimple, D. S., International Journal of Ecosystem, 2011, 1(1), 1-9 [doi:10.5923/j.ije.20110101.01]
CrossRef - MiCorps (The Michigan Clean Water Corps), Dissolved Oxygen and Temperature, Michigan Department of Environmental Quality, USA, (2014) [http://goo.gl/kFMlpJ on 14.02.2015]
- MPCA (Minnesota Pollution Control Agency), Low Dissolved Oxygen in Water Causes, Impact on Aquatic Life: An Overview, 2009
- Nedeau, E. J.; Merritt, R. W.; Kaufman, M. G., Environmental Pollution, 2003, 123(1), 1-13
CrossRef - Odeigah, C.; Osanyinpeju, O., Food and Chemical Toxicology, 1995, 33, 501-505
CrossRef - Ogunfowokan, A. O.; Okoh, E. K.; Adenuga, A. A.; Asubiojo, O. I., Journal of applied sciences, 2005, 5(1), 36-43
- Page, A. L.; Miller, R. H.; Keeney, D. R., Methods of Soil Analysis. Part-2, 2nd edition, American Society of Agrononomy, Wisconsin, USA, 1982, 98-765
- Rajaram, T.; Das, A., Futures, 2008, 40(1), 56-69
CrossRef - Richard, L. A., Diagnoses and improvement of saline and alkali soils. Agriculture Hand Book, USA, 1954
- Sarker, B. C.; Baten, M. A.; Ekram-ul Haque, M.; Das, A. K.; Hossain, A.; Hasan, M. Z., Current World Environment, 2015, 10(1), 61-66 [doi: http://dx.doi.org/10.12944/CWE.10.1.07]
CrossRef - Sarker, B.C. Assessment of Industrial Effluents Quality: A Case Study of Bhaluka Industrial Area, Mymensingh, Bangladesh, MS Thesis, 2013 [DOI: 10.13140/2.1.1914.6565]
- Singh, K. P.; Parwana, H. K., Indian Journal of Environmental Protection, 1999, 19, 241-244
- Smolders, R.; Bervoets, L.; Blust, R., Environmental Pollution. 2004, 132(2), 231-243
CrossRef - Sultana, M. S.; Islam, M. S.; Saha, R.; Al-Mansur, M. A., Bangladesh Journal of Scientific and Industrial Research, 2009, 44(1), 65-80
CrossRef - Ugochukwu, C. N. C.; Leton, T. G., African Journal of Environmental Assessment and Management. 2004, 8, 27-30

This work is licensed under a Creative Commons Attribution 4.0 International License.
![]()
A New Edition of Web of Science
Journal Impact Factor
2022: 0.5
Five Year: 0.8
Journal is Indexed in

Cabells Whitelist
![]()


