Investigation of Corrosion Inhibition of Vitamins B1 and C on Mild Steel in 0.5 M HCl Solution: Experimental and Computational Approach
Rasha A. Ahmed1,2
1Taif University, Faculty of Science, Chemistry Department, Taif, Hawiya 888, Saudi Arabia 2Forensic Chemistry Laboratories, Medico Legal Department, Ministry of Justice, Cairo, Egypt Corresponding Author Email: rashaauf@yahoo.com
DOI : http://dx.doi.org/10.13005/ojc/320133
Article Received on :
Article Accepted on :
Article Published : 29 Feb 2016
Corrosion inhibition behavior of Ascorbic acid (AA) vitamin C and Thiamine (Th) vitamin B1 on mild steel corrosion in 0.5 M HCl was investigated at various immersion times. The electrochemical characteristics of mild steel in absence and presence of the inhibitors were verified by the cyclic voltammetry method. The protective properties of the passive film were acquired by electrochemical impedance spectroscopy. The best inhibitive performance was obtained for VitB1. The polarization curves indicated the high inhibition efficiency of the inhibitors. The existence of a protective film on mild steel was confirmed by SEM techniques. Computational chemistry was carried out to establish the mechanism of corrosion inhibition.
KEYWORDS:Corrosion; AA; VitB1; EIS; CV; SEM
Download this article as:| Copy the following to cite this article: Ahmed R. A. Investigation of Corrosion Inhibition of Vitamins B1 and C on Mild Steel in 0.5 M HCl Solution: Experimental and Computational Approach. Orient J Chem 2016;32(1). |
| Copy the following to cite this URL: Ahmed R. A. Investigation of Corrosion Inhibition of Vitamins B1 and C on Mild Steel in 0.5 M HCl Solution: Experimental and Computational Approach. Orient J Chem 2016;32(1). Available from: http://www.orientjchem.org/?p=14345 |
Introduction
Corrosion is the deterioration of metal by an electrochemical process or environment conditions. Mild steel are the most commonly used construction materials due to its low cost, strength and ease of fabrication but they are affected greatly by its high corrosion rate caused by aggressive acids1. Mineral acids solutions especially, Hydrochloric and sulfuric acids are often used for pickling2,3, cleaning4, de-scaling5, and oil-well acidization6. On the contrary, they cause pitting which results in structural weakness and disintegration of the metal. Reducing corrosion pits can be performed by the addition of corrosion inhibitors in small concentrations7, 8. Most corrosion inhibitors are organic compounds having electronegative atoms (such as, N, S, P, and O) and π-electrons9–12. These organic compounds have high corrosion inhibition efficiency owning to their mobile electron pair, as well as their orbital character of free electrons and the presence of electron density around the hetero-atoms. The action of the inhibitors was discussed and explained previously13-16. Unfortunally, the usage of most of the inhibitors has been restricted due to their toxicity, as well as their insufficient inhibitory efficiencies at low dosages17–19. Therefore, the studies have begun to focus on finding novel, cheap, non-toxic, environmentally friendly corrosion inhibitors as alternatives. In order to achieve this, biochemical compounds, which are widely applicable in medicinal field, are also contain heteroatoms, extensive conjugation, and substituted heterocycles. Therefore, these electronic structural characteristics are essential in corrosion inhibitors19. In this content, we have focused on the inhibitory efficiencies of some vitamins, since they contain suitable electronic features which help to inhibit the corrosion of metals in various aggressive solutions20-25.
VitB1 is a natural compound26, contains many p – electrons as well as one oxygen, one sulfur, and four nitrogen atoms. The large size, high molecular weight, as well as presence of heteroatoms in VitB1 structure can promote good coverage to the metal surface, causing easier adsorption and increases inhibition efficiency. For these reasons, many reports considered Vitamins B1 and their derivatives as good corrosion inhibitors for various metals in different corrosive media27–29. It is worth mentioning, l-Ascorbic acid (AA)–Vitamin C is an easily obtainable and water-soluble compound whose molecule has desirable characteristics for a corrosion inhibitor.
The main aim of present study is to investigate corrosion inhibition effect of VitC and VitB1 on mild steel in 0.5 M HCl solution as well as the stability of the surface inhibitor film at anodic and cathodic potentials. For this aim, cyclic voltammetry, potentiodynamic polarization and electrochemical impedance (EIS) techniques were performed. The effect of immersion time on the inhibition efficiencies of these vitamins has been systematically studied. Surface morphology of corroded/inhibited mild steel has been studied by scanning electron microscopy (SEM). In addition to this, computational chemical calculations were performed to add theoretical support to the experimental results.
Experimental Details
Chemicals preparation
Vitamins B1 and vitamin C were obtained from Sigma –Aldrich. The test solutions were 0.5 M HCl solution with and without the addition of 5×10⁻³ M VitC and VitB1, whose chemical structures are given in Table 1. VitC and VitB1 were used as green inhibitors. 0.5 M HCl solution was prepared by dilution of a concentrated HCl solution (37%) with distilled water. During the measurements, the test solutions were opened to atmosphere, and their temperature was controlled thermostatically at 37 °C. Before beginning the experiment, the vitamin solutions were stirred by a magnetic stirrer for 30 min in 10 ml cell. The working electrode was kept in OCP for 30 min in the tested solution and then cathodic and anodic polarization was recorded.
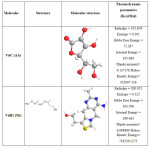 |
Table 1: Molecular structure of vitamin B1 and vitamin C |
Electrode preparation
The mild steel electrode, whose composition is as follows (wt%): (0.045%P; 0.3% Si; 0.3% Cr; 0.3–0.65% Mn; 0.14–0.22% C; 0.05% S;0.3% Ni; 0.3% Cu and the remainder Fe), was covered with a polyester block except its only bottom surface, which has surface area 0.50 cm2. Before the measurements, the surface of mild steel sheets were polished mechanically with 1200 and 2400 grit paper; subsequently, the electrodes were rinsed with distilled water, degreased ultrasonically in ethanol before use and dried at room temperature and immersed in the test solutions quickly for 30 min. Each experiment was performed with freshly prepared solution and a clean set of electrodes.
Instrumentation
The measurements were carried out with a potentiostat/galvanostat. Electrochemical measurements were done using Autolab PGSTAT 73022. For this purpose, a conventional three-electrode cell was used, composed of Ag/AgCl reference electrode, a platinum wire as the counter electrode, and the mild steel substrates as the working electrodes. The Potentiodynamic polarization curves were obtained by scanning from 0.5 V to −1.5 V, at scanning rate of 1 mV/s. The cyclic voltammetry curves were obtained by scanning from 1.0 V to −1.0 V, at scanning rate of 50 mV/s. All the measurements were done in a Faraday cage in order to avoid electromagnetic interference and the impedance plots were fitted using FRA software. Scanning electron microscopy (SEM) (Philips, XI 30) was used for steel surface characterization before and after immersing in vitamin solutions.
Electrochemical measurements
The EIS were recorded in the frequency range of 100 mHz –100 kHz. The amplitude of the applied sine wave potential was 5 mV. The EIS were obtained in 0.5 M HCl solution and plotted in the form of Bode and Nyquist plots. The corrosion potential and the corrosion current density were obtained through the linear analysis of Tafel approximation. For linear polarization (i/E analysis) we use NOVA software30-32. To avoid the presence of some degree of nonlinearity in the Tafel slope region of the obtained polarization curves, the Tafel constants were calculated as the slope of the points after Ecorr by 50 mV, using a computer least squares analysis. The corrosion current was then determined by the intersection of the cathodic or the anodic Tafel line with the OCP (potential of zero current in the potentiodynamic curves or Ecorr). This point determines the potential (Ecorr) and current density (icorr) for corrosion. For all tested electrodes the active dissolution parameters values, corrosion potential (Ecorr), corrosion current density (icorr), anodic and cathodic Tafel slopes (βa and βc) were calculated and presented in Table 3.
Computational chemical calculations
Computational chemical calculations were performed using molecular mechanics theory (MM2) method and structural parameters were geometrically optimized using Hṻckel calculation. All the calculations were performed with HyperChem as reported in literature. The computational chemical parameters obtained were EHOMO, ELUMO and E(LUMO–HOMO) (∆E), Kinetic energy and dipole moment (μ).
Results And Discussion
Surface and film morphologies
Fig. 1 shows the surface morphology of corroded and inhibited mild steel in 0.5 M HCl solution. Fig. 1(a) shows the surface morphology of corroded mild steel (blank) after immersion in 0.5M HCl solution for 2 days. The images show that the surface of mild steel is very rough and highly corroded due to active dissolution of the metal oxide film in the highly acidic solution.
Fig. 1(b and c), illustrates the inhibited mild steel after addition of 5×10⁻³ M VitC and VitB1 solutions. The roughness and damaged of mild steel surface has been diminished owning to inhibitory efficiency of vitamins in the acidic environments. SEM image of the inhibited mild steel by VitB1, Fig. 1(c), shows much smoother surface as compared to VitC, Fig. 1(b). VitC and VitB1 forms compact film which covered the mild steel surface and protect it from aggressive environment.
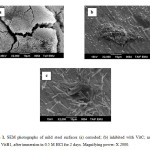 |
Figure 1: SEM photographs of mild steel surfaces (a) corroded; (b) inhibited with VitC; and (C) VitB1, after immersion in 0.5 M HCl for 2 days. Magnifying power: X 2000. Click here to View figure |
Electrochemical measurements
Cyclic voltammetry
The cyclic voltammetry displays the electrochemical changes in corroded/ inhibited mild steel behavior. Fig. 2 (a-c) illustrated the CVs of corroded mild steel; inhibited mild steel by VitC; and VitB1, respectively. Corroded steel showed high oxidation peak current, (Fig. 2a) which indicates the high corrosion rate of mild steel in aggressive HCl solution. A decreased current respond was observed (Fig. 2b) after addition of VitC. AA slows down the reduction reaction of dissolved O2 more effectively than the anodic reaction33. While dissolved O2 was found to enhance the inhibition performance of AA in the cathodic reaction, this causes steel to corrode rapidly to form a compact and porous film of Iron oxide. Therefore, AA acts as a mixed inhibitor. The corrosion inhibition process was also attributed to the adsorption of l-dehydroascorbic acid (DHA) onto the electrode surface active sites, retarding the water adsorption reaction that is involved in the oxide layer formation33, 35. Moreover, Fig. 2c, showed no oxidation peak current. The quenching of the peak current attributed to the high inhibition efficiency of VitB1 due to its structure which has the ability to donate electrons to the d-orbitals of the mild steel surface and blocks its active site responsible for corrosion. The decreased current response observed for both vitamins are evident on the excellent surface protection; in agreement with the SEM results.
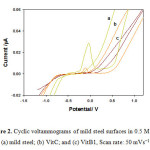 |
Figure 2: Cyclic voltammograms of mild steel surfaces in 0.5 M HCl. (a) mild steel; (b) VitC; and (c) VitB1, Scan rate: 50 mVs−1 Click here to View figure |
Electrochemical Impedance spectroscopy
Electrochemical impedance spectroscopy is a rapid and convenient method to evaluate the inhibition efficiency of the inhibitors36.The capacitive behavior of mild steel after immersion in 0.5M HCl solution for 72 hours in uninhibited solution at 37 °C could be visualized from Nyquist and Bode plots, Fig. 3 (a,b). An aggressive attack of HCl solution corroded mild steel enormously and made surface highly irregular, which could be easily detected by small phase angle. It decreases sharply with increasing immersion time approaching ~ 46o. This is also clear confirmed from Nyquist plots, where single slightly depressed semi-circles are observed (Fig. 3(a)), which indicates that electrochemical solid/liquid interface is having non-ideal capacitive behavior37. Also the presence of single time constant indicates that corrosion process is mainly charge transfer controlled38.
On the contrary, after addition of VitB1 and VitC to the acidic solution, adsorption of the inhibited molecules on mild steel effectively lowered surface roughness; as a result phase angle and impedance values increased, suggesting high corrosion resistance in presence of the inhibitors used, with increasing time. The Nyquist plots for corroded and inhibited mild steel have the same behavior, which suggests that the corrosion mechanism remains unchanged39. The only difference in the plots is that their diameters are larger in the presence of the inhibitors, which reveals that an enhancement occurs in the corrosion resistance of the mild steel. Nyquist and Bode plots of VitB1 and VitC, Fig. 4 and 5 (a, b), respectively, revealed higher phase angles approaching 65° and higher capacitive behavior; reflecting the improvement of the corrosion resistance due to the presence of adsorbed inhibitor molecules at the interface. The above results can be analyzed by using equivalent circuit as shown in Fig. 6. This circuit contains Rs (electrolyte resistance between the working electrode and the reference electrode), while R1 (represents the electrical resistance of the oxide layer) and CPE (constant phase element).The impedance of the phase element is defined as ZCPE = [C(jw)α]−1, where −1 ≤ α≤ 140. The value of α is associated with the surface roughness. The resistance and capacitance values are given in Table 2. The obtained results come in a good agreement with other reported data. Moreover; the mild steel lasted for 72 hours without corrosion in acidic medium, increasing its resistance by increasing immersion time41-43.
Table 2: Corrosion parameters of corroded and inhibited mild steel electrodes in 0.5 M HCl after 72 hours of immersion time at 37oC.
|
Electrode |
R /Ωcm2 |
R / KΩ cm2 |
CPE1/μF cm-2 |
N |
|
Corroded mild steel |
29 |
55 |
115 |
0.51 |
|
VitB1/mild steel |
32 |
35 |
147 |
0.67 |
|
VitC/mild steel |
35 |
30 |
160 |
0.71 |
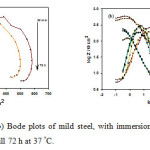 |
Figure 3: (a) Nyquist and (b) Bode plots of mild steel, with immersion time in 0.5 M HCl solution starting from 30 min till 72 h at 37 °C. Click here to View figure |
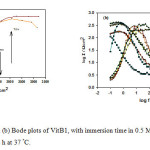 |
Figure 4: (a) Nyquist and (b) Bode plots of VitB1, with immersion time in 0.5 M HCl solution starting from 30 min till 72 h at 37 °C. Click here to View figure |
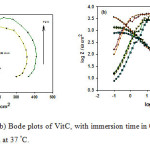 |
Figure 5: (a) Nyquist and (b) Bode plots of VitC, with immersion time in 0.5 M HCl solution starting from 30 min till 72 h at 37 °C. Click here to View figure |
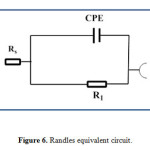 |
Figure 6: Randles equivalent circuit. |
Potentiodynamic polarization measurements
The anodic and cathodic (E-log i) plots (Fig. 7) in 0.5 M HCl acid for corroded and inhibited mild steel alloy were studied using potentiodynamic polarization techniques. The polarization curves showed a clear difference between the corroded and inhibited mild steel, the results are listed in Table 3. The corrosion potentials (Ecorr) of mild steel in presence of VitB1 were shifted toward less negative potentials, indicating enhancement in the corrosion resistance. Furthermore, it was observed that the corrosion current density (Icorr) in presence of the inhibitor was lower than that of corroded steel, confirming that both vitamins promoted corrosion resistance. This indicates a higher corrosion resistance of the inhibitors which calculated from the inhibition efficiency using the following equation:
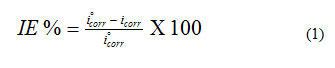
VitC provides protection of about 83% in corrosive medium was attributed to the adsorption of the l-dehydroascorbic acid (DHA) (an AA oxidation product) onto the mild steel surface. While VitB1 provides protection of about 90 % in corrosive medium, due to its structure which contain S, N, and O electronegative atoms. Heteroatoms act as adsorption centers, causing an easier electron transfer from the functional groups to the mild steel surface which provides greater adsorption ability and inhibitory efficiency. It was concluded that addition of VitB1 and VitC in the acidic solution act as green inhibitors on the mild steel, and significantly promoted its resistance to corrosive degradation. The electrochemical parameters (Table 3) were obtained by analyzing the I/E data as described else where44.
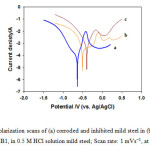 |
Figure 7: Polarization scans of (a) corroded and inhibited mild steel in (b) VitC; and (c) VitB1, in 0.5 M HCl solution mild steel; Scan rate: 1 mVs−1, at 37 °C. Click here to View figure |
The corrosion potential (Ecorr) and current density (icorr) were calculated by Tafel extrapolation method for the cathodic and anodic branches of the polarization curves. The Ecorr as function of time data for VitB1 revealed that Ecorr was shifted toward more positive value, while icorr value was much lower than VitC and corroded steel. These results clearly support the previously obtained EIS results. Moreover, according to the electrochemical parameters (icorr, Ecorr, βa and βc) given in Table 3, it can be observed that the anodic Tafel slope (βa) increases with the addition of the inhibitors while the while the cathodic Tafel slope (βc) remains almost constant, this illustrates the high anodic corrosion inhibition and the high stability of the oxide film promoted by the inhibitors in acid solution, by blocking the reaction sites of the metal surface and decreasing the surface area responsible for corrosion. The positive shift of corrosion potential is evidently caused by the restriction of anodic reaction process. Furthermore, from the Tafel slopes (ba and −bc), corrosion rates were calculated to be 2.3 and 1.6 mm/year for VitC and VitB1, respectively, reflecting the corrosion resistance enhancement by replacing addition of the vitamins.
Table 3: Potentiodynamic parameters as well as inhibition efficiency values for corroded and inhibited mild steel at 37oC
|
Samples |
Ecorr mV |
jcorr mACm-2 |
βa mVdec-1 |
βc mVdec-1 |
Rp mmyear-1 |
IE % |
|
Mild steel |
-0.65 |
0.156 |
63.0 |
3.1 |
18 |
– |
|
Vit C |
-0.50 |
0.044 |
125 |
3.4 |
2.3 |
83 |
|
Vit B1 |
-0.39 |
0.022 |
251 |
4.5 |
1.6 |
90 |
Computational chemistry calculations
Correlation between molecular structure and corrosion inhibition efficiency is investigated by using computational chemistry. The inhibition property of an inhibitor depends upon its molecular arrangement in space and also electronic structure of molecules45, 46. It is well known that, only the outer most molecular orbitals (LUMO and HOMO) are important for chemical adsorption as they are involved in interaction between the reactants (frontier molecular orbital theory). The difference between the energy levels of these orbitals can figure out the inhibition efficiency. It was reported that, effective corrosion inhibitors are those compounds which can donate electrons to the vacant d – orbital of the metal to form a coordinate/covalent bond and can also receive free electrons from the metal surface47, 48. The ability of inhibitor is related to donate their electrons to metal surface is associated with the EHOMO values i.e. higher the EHOMO values easier will be the donation of electrons from inhibitor to empty metal d -orbitals. On the other hand, ability of inhibitor molecules to accept the electrons is associated with the ELUMO values i.e. lower its value easier will be the accommodation of additional negative charge by inhibitor molecules, which is given by filled metal d-orbital. Also stability index of any inhibitor is related to the energy difference between HOMO and LUMO i.e. ΔE= ELUMO – EHOMO. Thus, lower the ΔE values, higher will be the stability of inhibitor and metal surface interaction, i.e good inhibition efficiency. While, larger the ΔE values, lower reactivity to a chemical species49.
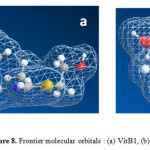 |
Figure 8: Frontier molecular orbitals : (a) VitB1, (b) VitC |
In order to evaluate the adsorption ability of the inhibitor, dipole moment, μ, has to be calculated. In fact, the relation between dipole moment and inhibition efficiency has been interpreted in different ways. Some results have shown that greater dipole moment is responsible for greater corrosion inhibition efficiency50. On the contrary, other reports have stated that low values of dipole moment may favor the accumulation of inhibitor molecules on the metal surface51. In Table 4, computational chemical parameters related to the electronic structures of studied vitamins, such as total energy, EHOMO, ELUMO, ∆E (ELUMO–EHOMO) and μ have been presented. The results illustrated that VitB1 presents high value of EHOMO (∆ 2.365 eV), and low value of ELUMO (∆ 9.036 eV) which supports its highest inhibition efficiency. Figure 8 illustrates the frontier molecular orbitals for (a) VitB1, (b) VitC. The presence of electronegative atoms like S, N and O in the molecular structure of VitB1 is responsible for its inhibition efficiency, in which they help the molecule to be adsorbed easily to the mild steel surface.VitB1 possessed the higher dipole moment and inhibition efficiency than VitC which come in a good agreement with the best inhibition efficiency exhibited experimentally.
Thermodynamic explanation of inhibition
Organic molecules adsorbed on the metal by physical and/or chemical methods. In case of physical adsorption, electrostatic interaction occurs between charged metal surface and charged inhibitor molecules. While in chemical adsorption, inhibition occurs by donor– acceptor interactions between lone pair electron on the heteroatoms (S, N and O), π-electrons with vacant d- orbital’s of Fe 52. The thermodynamic parameters of the inhibitors, ∆G0ads, ∆H0ads and ∆S0ads are listed in Table 1. ∆H0ads absolute values can determine whether the reaction is physical or chemical adsorption. For a physisorption process the enthalpy of adsorption should be equal to or less than 40 kJ mol-1 while, for chemisorption it is equal to or more than 100 kJ mol-153, 54. In our case, the calculated values of ∆H0ads for Vit B1 and Vit C are above 100 kJ mol-1, thus the mode of adsorption is chemisorptions. The positive sign of ∆S0ads arises from the substitution process which can be attributed to the increase in the solvent entropy and more positive water desorption entropy55.
Conclusion
- SEM analysis shows a much smoother surface for inhibited mild steel than the uninhibited one.
- The corrosion resistance had the highest values for VitB1 in 0.5 M HCl due to the high adsorption of the molecule which cover steel surface and blocks the reaction sites of the metal surface, protecting it from corrosion.
- Polarization measurements show that Vit B1 and VitC inhibit both the anodic and cathodic reactions indicating that these are mixed type corrosion inhibitors.
- Nyquist and Bode plots depict that the charge transfer resistance increases and double layer capacitance declines in the presence of Vit B1 and VitC, confirming the adsorption of inhibitor molecules on the mild steel surface.
- The calculated parameters using computational chemistry correlated well with the experimental results and indicated the chemisorption process.
Acknowledgements
The author is gratefully acknowledges, Chemistry Department, Taif University, Saudi Arabia for the financial support and facilitation of the study.
References
- Zhang, G.; Chen C., Lu, M.; Chai, C.; Wu, Y.; Mater. Chem. Phys. 2007, 105, 331-339.
- Fox, T.J.; Randall, C.D.; Gross, D.H.; Steel Pickling: A Profile. U. S. Environmental Protection Agency Office of Air Quality Planning and Standards Cost and Economic Impact Section Research, Triangle Park, NC, 1993.
- Nwaogu, U.C.; Blawert, C.; Scharnagl, N.; Dietzel, W.; Kainer, K.U.; Corros. Sci. 2010, 52, 2143-2154.
- Hodgkiess, T.; Al-Omari, K.H.; Bontems, N.; Lesiak, B. Desalination, 2005, 183,209-216.
- Tahir, M.S.; Saleem, M. J. Facul. Eng. Technol. 2007, 24, 1-9.
- Rajeev, P.; Surendranathan, A.O.; Murthy, Ch. S. N. J. Mater. Environ. Sci. 2012, 3, 856-869.
- Ahamad, I.; Quraishi, M.A. Corros. Sci. 2009, 51, 2006-2013.
- Qiu, L.; Wu, Y.; Wang, Y.; Jiang, X. Corros. Sci. 2008, 50, 576-582.
- Quraishi, M.A.; Rafiquee, M.Z.A. J. Appl. Electrochem. 2007, 37, 1153-1162.
- Bin, X.; Wenzhong, Y.; Ying, L.; Xiaoshuang, Y.; Weinan, G.; Yizhong, Ch. Corros. Sci. 2014, 78, 260-268.
- Knag, M.; Bilkova, K.; Gulbrandsen, E.; Carlsen, P.; Sjöblom, J. Corros. Sci. 2006, 48, 2592-2613.
- Saedah, R. A. Orient. J. Chem. 2014, 30, 541-552.
- Goulart, C.M.; Esteves, S. A.; Martinez, H. C.A.; Rodrigues, C.J.F.; Maciel, M.A.M.; Echevarria, A. Corros. Sci. 2013, 67, 281-291.
- Sathiyapriya, T.; Rathika, G. Orient. J. Chem. 2015, 31, 1703-1710.
- Morad, M.S. Corros. Sci. 2008, 50, 436-448.
- Mourya, P.; Banerjee, S.; Singh, M.M. Corros. Sci. 2014, 85, 352-363.
- Qian, B.; Hou, B.; Zheng, M. Corros. Sci. 2013, 72, 1-9.
- Negm, N.A.; Kandile, N.G.; Badr, E.A.; Mohammed, M.A. Corros. Sci. 2012, 65, 94-104.
- Li, X.; Deng, S.; Fu, H. Corros. Sci. 2012, 62, 163-175.
- Regina, F.G.; Miomir, G.P.; Milorad, V.T. Int. J. Electrochem. Sci. 2013, 8, 151-160.
- Ju, H.; Li, Q.; Ju, Y. L. Adv. Mater. Res. 2012,184, 562-557.
- Abiola, O.K. Corros. Sci. 2006, 48, 3078-3090.
- Qiao, K.; Wu, Y.; Liu, X. Adv. Mater. Res. 2012, 463, 891-895.
- Gokhan, G. Corros. Sci., 2011, 53, 3873-4326.
- Ju, H.; Li, Q.; Ju, Y.-L. Adv. Mater. Res. 2012, 562, 184-191.
- Abiola, O.K. Corros. Sci. 2006, 48, 3078-3090.
- Hoseinzadeh, A.R.; Danaee, I.; Maddahy, M.H. Z. Phys. Chem. 2013, 227, 403- 417.
- Abiola, O.K.; Oforka, N.C. J. Corros. Sci. Eng. 2002, 3, 1-9.
- Bhola, S.M.; Chandra, C.; Singh, G. J. Corros. Sci. Eng. 2008, 11, 1-10.
- Ahmed, R. A. Ind. Eng. Chem. Res. 2015, 54, 8397-8404.
- Ahmed, R. A.; Fadl-allah, S. A.; El-Bagoury, N.; Gad El-Rab, S. M.F. Appl. Surf. Sci. 2014, 292, 390-399.
- Ahmed, R. A.; Fekry, A. M. ; Farghali, R. A. Appl. Surf. Sci. 2013, 285, 309-316.
- Davies, M.B.; Austin, J.; Partridge, D.A.; Vitamin C: Its Chemistry and Biochemistry, Royal Society of Chemistry, London, 1991.
- Lewin, Vitamin C: Its Molecular Biology and Medical Potential, Academic Press, London, (1976).
- Seib, P.A.; Tolbert, B.M. Ascorbic Acid: Chemistry, Metabolism and Uses. Advances in Chemistry, Series No. 200, Ameri. Chem. Soc., Washington, DC, 1982.
- Shaju, K.S; Thomas, K.J; Raphael, V.P. Orient. J. Chem. 2014, 30, 807-813.
- Ghowsi, K.; Ghowsi, H. Orient. J. Chem. 2011, 27, 1635-1637.
- Zhang, Q.B.; Hua, Y. X. Electrochim. Acta. 2009, 54, 1881-1887.
- Anejjar, A; Zarrouk, A.; Salghi, R.; Zarrok, H.; BenHmamou, D.; Hammouti, B.; Elmahi, B. S. ; Al- Deyab, S. J. Mater. Environ. Sci. 2013, 4, 583-592.
- Shimin, L.; Chunyong, L.; Hongshui, W.; Zhixia, Q. Int. J. Electrochem. Sci. 2012, 7, 12922 – 12930
- Amin, M. A. Chin. Chem. Lett. 2010, 21, 341-345.
- Daoud, D.; Douadi, T.; Hamani, H.; Chafaa, S.; Al-Noaimi, M. Corros. Sci. 2015, 94, 21-37.
- Odewunmi, N.A.; Umoren, S.A.; Gasem, Z.M. J. Environ. Chem. Eng. 2015, 3, 286-296.
- Abd El-Lateef, H. M. Corros. Sci. 2015, 92, 104-117.
- Obot, I.B.; Obi-Egbedi, N.O.; Umoren, S.A. Corros. Sci. 2009, 51, 276-282.
- Scendo, M.; Uznanska, J.Int. J. Corr. 2011, 1-12.
- Majid, K.; Ali, N. Orient. J. Chem. 2015, 31, 423-429.
- Li, W.; He, Q.; Pei, C.; Hou, B. Electrochim. Acta. 2007, 52, 6386-6394.
- Ju, H.; Zhen, P. K.; Yani, L. Corr. Sc. 2008, 50, 865- 871..
- Goulart, C.M.; Souza, A.E.; Huitle, C.A.M.; Rodrigues, C.J.F.; Maciel, M.A.M.; Echevarria, A. Corros. Sci. 2013, 67, 281-291.
- Udhayakala, P. ; Rajendiran, T.V. ; Gunasekaran, S., J. Adv. Scient. Res. 2012, 3, 37-44.
- Behpour, M.; Ghoreishi, S.M.; Niasari, M. S.; Ebrahimi, B. Mater. Chem. Phys. 2008, 107, 153-157.
- Badiea, A.M.; Mohana, K.N. Corros. Sci., 2009, 51, 2231-2241.
- Mourya, P.; Banerjee, S.; Singh, M.M. Ind. Eng. Chem. Res., 2013, 52, 12733-12747.
- Fiori- Bimbi, M.V.; Alvarez, P.E.; Vaca, H. Gervasi, C.A. Corros. Sci., 2014, 92, 192-199.

This work is licensed under a Creative Commons Attribution 4.0 International License.
![]()
A New Edition of Web of Science
Journal Impact Factor
2022: 0.5
Five Year: 0.8
Journal is Indexed in

Cabells Whitelist
![]()


