Estimation of Ammonia-Nitrogen (Nh3-N) Using an Artificial Neural Networks Under Bacterial Technology
Gebdang Biangbalbe Ruben1*, Xie Yuebo2, and Andam-Akorful A. Samuel3
1College of Hydrology and Water Resources, Hohai University, Nanjing, 210098,
2State Key Laboratories, College of Hydrology and Water Resources, Hohai University, Nanjing,
3Department of GeomaticEngineerig, Kwame Nkrumah University of Science and Technology, Ghana.
Corresponding author email: rubengebdang@yahoo.fr
DOI : http://dx.doi.org/10.13005/ojc/320104
Article Received on :
Article Accepted on :
Article Published : 20 Feb 2016
An Artificial Neural Network (ANN) was developed to estimate the NH3-N under the bacterial technology in Xuxi River, China. Eight water quality variables such as Dissolved Oxygen (DO), Chemical Oxygen Demand (COD), Total Nitrogen (TN), Total Phosphorus (TP), Suspended Sediment (SS), Temperature, Transparency, and Ammonia Nitrogen (NH3-N) were used as inputs for the network. The observed and the predicted NH3-N of the trained networks showed a good fit after the training with a coefficient of correlation (r) and a root mean square error (RMSE) of 0.91 and 2.61 respectively. Sensitivity analysis was used to determine the influence of input variables on the dependent variable; TN, Transparency, DO, and TP have proven to be the most effective inputs. Their training’s results showed a coefficient of correlation (r = 0.9295) and a (RMSE = 1.2081) which is more accurate than the prediction with eight inputs variables.
KEYWORDS:Artificial Neural Networks; bacterial technology; ammonia nitrogen; estimation; Xuxi River
Download this article as:| Copy the following to cite this article: Ruben G. B, Yuebo X, Samuel A. A. A. Estimation of Ammonia-Nitrogen (Nh3-N) Using an Artificial Neural Networks Under Bacterial Technology. Orient J Chem 2016;32(1). |
| Copy the following to cite this URL: Ruben G. B, Yuebo X, Samuel A. A. A. Estimation of Ammonia-Nitrogen (Nh3-N) Using an Artificial Neural Networks Under Bacterial Technology. Orient J Chem 2016;32(1). Available from: http://www.orientjchem.org/?p=14129 |
Introduction
The damage to the environment has given rise for concern in recent years. Water resources are under pressure due to intensive industrialization and migration from rural to large urban areas. Huge amounts of domestic and industrial waste are dumped every day into rivers. China, one of the fastest growing industrialized regions in the world is no stranger to environmental problems, especially river pollution which usually lead to eutrophication of the concerned water bodies. Eutrophication is one of the most important water environmental problems in China, which would lead to abundant development of aquatic plants, growth of algae, and disturb the balance of organisms in the water [1]. This situation impairs the aquatic life and reduce the water body to a source of many health problems for the population living around the polluted River. In order to solve this problem, various River restoration campaigns using different techniques as the re-aeration using a series of weir, shifting effluent discharge locations, pumping air into the water body using a local oxygenator and introducing a constructed wetland [2], have been taken in China. According to some studies, wetlands and their modifications are able to remove more than 70% of pollutants and cost much less in construction, operation and maintenance than the conventional wastewater treatment plants [3]. However, the inability of constructed wetlands to efficiently remove phosphorus has been a major setback [4] that is why the bacterial technology is currently receiving more attention as an efficient, cost-effective and sustainable approach towards river restoration [5].This method is simple, affordable, adaptable, scalable, and eco-friendly in river and wastewater treatment [6]. The Bacterial Technology Method (BTM), system employs bacteria to degrade pollutants into simple harmless substances and produce standard effluents [7], provides a promising advantage compared to the wetlands as mentioned earlier. It has been successfully implemented in the recovery of polluted lakes and various polluted systems such as wastewater treatment plants and septic tanks [8]. For instance, the method has been used in urban streams in Shenzen, Rui’an and Wuxi of China. This method has been known to rapidly reduce the concentrations of effluent biological oxygen demand (BOD) and chemical oxygen demand (COD) [5].It offers an easy solution to purify polluted rivers and streams, and meets the standards of wastewater effluents without building massive structures as is the case of traditional methods.
The measurement of contaminants in rivers is important for monitoring water quality. One of the contaminants that contribute most towards eutrophication is the ammonia nitrogen (NH3-N). Mostly it is introduced through sewage and fertilizers, it is essential for plant and animal growth and nourishment. Its overabundance in water can cause a number of adverse health and ecological effects. In wastewater, nitrogen exist in different forms (ammonia, organic, nitrate, and nitrite). One of these forms of nitrogen, the ammonia nitrogen in excess in water bodies can cause over stimulation of growth of aquatic plants and algae. Excessive growth of these organisms, in turn, use up dissolved oxygen as they decompose, and block light to penetrate deeply into the waters leading to suffocation of fish and others depended organisms [9]. Ammonia nitrogen then contribute towards eutrophication and need an effective eco-friendly method to be reduced to an acceptable level. The bacterial technology has proven to be the most effective for reducing the ammonia nitrogen in water bodies due to its simplicity, affordability, adaptability, and scalability [6].
During the BTM, contaminants including the ammonia nitrogen (NH3-N) need to be measured regularly several times a day which require both time and labor [10].To tackle these challenges many models have been used. For instance, in the same Xuxi River, Amos T. Kabo-Bah developed a mathematical expressions to estimate the fate of ammonia nitrogen (NH3-N) [5]. Unfortunately, most of these models require large amounts of data that are not easily accessible, making it a very expensive and time consuming process [11].
In the last decade, artificial neural networks (ANNs) have been widely applied in many fields of researches, from chemistry[12]-[14] to various water resource problems, such as hydrological processes [15]-[16], water resource management [17]-[18], and water quality modelling and forecasting with successful results [19] – [22]. Xiaohu Wen developed an artificial neural network (ANN) to simulate the DO concentrations in the Heihe River, Northwestern China, where the correlation coefficient (r) and root mean square error (RMSE) values for the test sets (0.9680 and 0.4570 respectively) indicated the effectiveness of neural network model to simulate DO[23]. Another work was done by Yasunobu Katoshowing the efficacy of an artificial neural network to predict the Chemical Oxygen Demand (COD) with high accuracy [24].
Xuxi River, which can be likened to a general case of grade V of river pollution in China, its restoration is of utmost importance that the use of bacterial technology for its restoration to an acceptable ecologically level. This study will be a great asset regarding the restoration of rivers by bacterial technology in the sense that it will use the neural networks to predict the fate of ammonia nitrogen (NH3-N) with solid and reliable results, this, without needing a huge amount of field data. The aim of this paper is to analyze the performances of neural networks models in estimating the fate of ammonia nitrogen under bacterial technology in the Xuxi River. This study will be an innovation in the field of bacterial technology which so far has been evaluated and predicted only by numerical and statistical models.
The remainder of the study is outlined as follows; Section II describes the methods and data set employed in the study, while the results and discussions are presented in Section III. The conclusions drawn from the study are also given in Section IV.
Material and Method
Sites and datasets
Xuxi River (XXR) is located in the Chang Nan District of Wuxi city of China. The total length of the river is 1.36 km with an upstream surface width of 4.5m and a depth of about 1.4m. The river is characterized by muddy sediments sometimes up to 1.6m. This river is located in a north sub-tropical humid zone [25].The water quality of the river is very poor. The daily sewage discharged into the River was estimated to 10000m3 [6]. That makes the surface water quality standard, to be ranked in class V. According to the Chinese National Standard (CNS) for Surface Water Quality (GB2828-2002), the Class V is the poorest water quality standard [5]. The Xuxi River, which has been classified in Class V (poorest water quality standard) and all the research carried on it can serve as a representative case for most of the polluted rivers in China. This alarming situation implies that the Xuxi River is highly polluted and needs to be restored to its natural condition for the benefit of the aquatic life and domestic uses.
The data used for this ANN were obtained during the treatment using the bacterial technology in October 2009. The samples were collected at 8:30 AM to 4:30 PM during the experimental period and the physiochemical parameters of Temperature, dissolved oxygen (DO), chemical oxygen demand (COD), total nitrogen (TN), total phosphorus (TP), suspended sediment (SS), Transparency, and ammonia nitrogen (NH3-N) were collected on the five specific monitoring points of the Xuxi River (Figure 1).
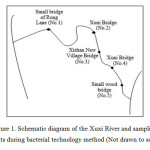 |
Figure 1: Schematic diagram of the Xuxi River and sampling points during bacterial technology method(Not drawn to scale). |
To determine the water quality, the samples were preserved in polyethylene bottles and stored in an insulated ice cooler delivered to the laboratory on the same day. All the samples were saved at 4°C until the analysis and processing (ISO 5667-6, 1990; ISO 5667-2, 1991; ISO 5667-3, 1994). Then each parameter was tested in laboratory [25].
Bacterial technology method
Bacterial technology is a way by which useful bacteria are applied to restore polluted rivers system or wastewater into their natural quality forms. The technology is simply an in-situ remediation procedure that puts micro-organisms to enhance the breakdown of pollutants in rivers into non-toxic and harmless H2O and COD inorganic. The detailed procedure for its implantation is presented by Song Y. [26]. After the treatment by the Bacterial Technology Method, Xuxi River was restored. The water quality parameters have been significantly improved, this can be seen in Figure 2. Table 1 displays the results of before and after the treatment are presented. These results demonstrated the efficacy of the Bacterial Technology for river restoration.
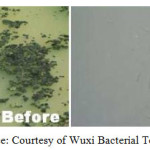 |
Figure 2: Source: Courtesy of Wuxi Bacterial Technology Project |
Table 1: Before and after treatment measurements in the Xuxi river by EPA of Wuxi
| Station
No |
NH3-N (mg/L) | DO (mg/L) | TP (mg/L) | TN (mg/L) | COD (mg/L) | T (C ) | ||||||
| Before | After | Before | After | Before | After | Before | After | Before | After | Before | After | |
| 1 | 13.6 | 10.6 | 1.2 | 2.1 | 11.2 | 1.1 | 24.8 | 14.6 | 11.2 | 12.4 | 16.3 | 25.6 |
| 2 | 11.2 | 8.68 | 0.2 | 3.0 | 11.2 | 1.0 | 24.8 | 15.5 | 11.2 | 11.5 | 18 | 27.3 |
| 3 | 13.8 | 10.6 | 0.3 | 2.5 | 0.9 | 1.1 | 24.6 | 19.5 | 12.9 | 13.6 | 16.8 | 26.7 |
| 4 | 15.8 | 9.68 | 0.3 | 2.2 | 1.1 | 0.9 | 23 | 16.8 | 13.9 | 10.8 | 16.6 | 26.5 |
| 5 | 16.4 | 10.7 | 0.1 | 2.4 | 1.2 | 0.7 | 22.9 | 14.7 | 14.2 | 8.0 | 16.6 | 26.2 |
Artificial neural networks
Artificial Neural Networks are non-linear mapping structures, which was initially inspired by the observed process of natural networks of biological neurons in brain. It consists of simple computational units called neurons which are highly inter connected. In its most general form, a neural network is a machine that is designed to model the way in which the brain performs a particular task or function of interest; the network is usually implemented by using electronic components or is simulated in a software on a computer [27]. ANNs have become very popular in recent times due to their wide range of applicability and the ease with which it can treat complicated problems and small size data [28]. The ANN is a modeling tool capable of handling a large number of inputs (independent variables) to determine one or more outputs (dependent variables). The basic structure of an ANN usually contains three distinctive layers, the input layer, where the data are introduced to the ANN, the hidden layer or layers, where data are processed, and the output layer, where the results of ANN are output. The ANN is designed by putting weights between neurons, by using a transfer function that controls the generation of the output, and using adjustable laws that define the relative importance of weights for input. In the training, the ANN defines the importance of the weights and adjusts them through iterative procedures [29].
The process is showed in Figure 3.
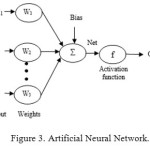 |
Figure 3: Artificial Neural Network. |
Multilayer perceptron neural network
There are different kinds of neural networks for different uses. The Multilayer Perceptron (MLP) is the simplest, and therefore, most commonly used neural network structure. The MLP consists of three layers of neurons: (1) an input layer; (2) an output layer, and (3) intermediate (hidden) layer or layers. Each neuron has a number of inputs (from outside the network or the previous layer) and a number of outputs (leading to the subsequent layer or out of the network). A neuron computes its output response based on the weighted sum of all its inputs according to an activation function [23]. The mathematical expression of the MLP is as follows:
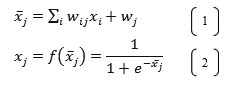
Where Xiis the output of node i located in any one of the previous layers, Wijthe weight associated with the link connecting nodes i and j, and Wj the bias of node j.
The MLP used in this study is made by eight input variables, a hidden layer with five to a fifteen processing neurons and one single output which is NH3-N (Figure 4).
Mohammed S. Jami et al. used a feedforward multilayer neural networks to simulate the NH3-N in a wastewater treatment plant which showed a satisfactory result with the mean square error and correlation coefficients of 0.1591 and 0.7980, respectively [30].The Multilayer Perceptron (MLP) will be used in this study.
Determining the best learning algorithm, the right activation function and the suitable architecture of the network (the number of neurons in hidden layers) when designing an ANN is very crucial, special attention should therefore be given to it. In this study, by a trial and error procedure, the architecture of the network selection was carried out by gradually varying the number of nodes in the hidden layer. The activation function used is the tan-sigmoid function in the hidden layer and a linear function (purelin function) in the output layer. The MLP is trained using the Levenberg–Marquardt technique as this technique is more powerful than the conventional gradient descent techniques [31].
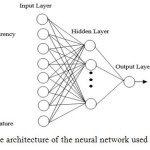 |
Figure 4: The architecture of the neural network used in this study |
Measurement of performance
There are several statistical tests for evaluating an ANN. The ones used in this paper are the Coefficient of Correlation (r), the Root Mean SquareError (RMSE) and the Mean Square Error (MSE). The RMSE and the MSE provide an indication of goodness of fit between the measured and modeled values. The Correlation of Coefficient (r) is a common criterion for the 4 goodness of fit for regression models [32].
These criteria are as follow:
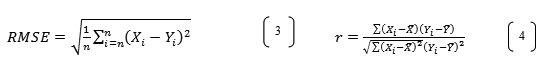
Where Xi and Yi are the ith observed and estimated values, respectively; and; are average of Xi andYi, and n is the total numbers of data.
Data processing
Generally, to build an ANN, the data are divided into training, validation and testing. The training set is used to estimate the unknown connection weights; the validation set is used to decide when to stop training in order to avoid overfitting and/or which network structure is optimal; and the test set is used to assess the generalization ability of the trained model [33]. The water quality data set collected from Xuxi River were divided into two groups. The first set made of 80% of the data was divided into a training set (80% of the 1st set), validation set (10% of the 1st set) and test set (10% of the 1st set); the second set of data (the remaining 20% of the data set) was the validation data set, completely separated from the first one in order to test the predictability of the network. The test data have been separated from the training set and the validation set, in order to evaluate the optimized model against unknown data set.
Results and Discussion
NH3-N model results
The Mean Square Error (MSE) can be used to determine how well the network input fits the desired output. With MSE, the smaller values ensure a better performance. The best number of neurons were determined by the minimum value of MSE of the training data set. Many iterations of the MLP were performed with the change of the number of neurons from 5 to 15. The best number of neurons selected was 5 neurons, which gives an architecture of 8-5-1 with 8 inputs parameters, 5 hidden neurons, and 1 output representing NH3-N. Observed NH3-N removals are depicted against the corresponding measured NH3-N removals in Figure 5.The related coefficient of correlation (r = 0.91) shows that the neural networks can predict the NH3-N removal under the bacterial technology due to the strong correlation between the observed values and the predicted ones. The RMSE of the model is equal to 2.61, and the MSE of 6.84
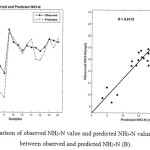 |
Figure 5: Comparison of observed NH3-N value and predicted NH3-N value (A); correlation between observed and predicted NH3-N (B). |
Sensitivity analysis
It is important to analyze the effects of different variables on the end result, if they were to change, in other words, it is important to determine how sensitive the resultant is when alterations are made to input values.Xiaohu Wen had shown the effectiveness of the sensitivity analysis by evaluating the effect of nine input variables on DO model [23]. Similar work was done by Garson [34] and Emolla [35] in order to assess the relative importance of the inputs variables.In this paper we evaluate the effects of the 8 input variables on the NH3-N model. This was done by making various combinations of those parameters. The coefficient of correlation (r) and the RMSE of different combinations were used for determining the most influential parameters on the output. The combination of the parameters with the minimum MSE were selected as the optimal network architecture. In table 2, nine networks have been compared according to the test data. By eliminating the Suspended Sediments (SS) from the inputs variables in the model, the coefficient of correlation and the RMSE improved significantly to 0.96 and 1.66 respectively; this implies that SS could be removed from the inputs variables for better prediction results. Contrarily, some of the variables have more influence to the NH3-N model. By removing them, the coefficient of correlation decreases whilst the RMSE increases which is the case of TN, Transparency, DO, and TP. Therefore, NH3-N was found to be more sensitive to these variables, they can stand alone for an accurate NH3-N estimation.
Table 2: Combination of various structures of NH3-N model
| Model | Combination | Structure | RMSE | r |
| Test | Test | |||
| 1 | All | 8-5-1 | 2.6168 | 0.9175 |
| 2 | Eliminate DO | 7-5-1 | 32.4096 | 0.5923 |
| 3 | Eliminate COD | 7-5-1 | 21.8651 | 0.8789 |
| 4 | Eliminate TN | 7-5-1 | 49.9551 | 0.0136 |
| 5 | Eliminate Temperature | 7-5-1 | 1.6536 | 0.8869 |
| 6 | Eliminate Transparency | 7-5-1 | 55.6852 | 0.2033 |
| 7 | Eliminate SS | 7-5-1 | 1.6651 | 0.9613 |
| 8 | Eliminate TP | 7-5-1 | 31.3870 | 0.8069 |
By using only the four most important variables and the NH3-N as inputs variables for estimating NH3-N under the bacterial technology with the following network structure 5-5-1, the coefficient of correlation and the RMSE results in 0.9295 and 1.2081 respectively (Table 3), which is an improvement from the previous model that used 8 input variables (Figure 6). Therefore, in order to obtain better ANN results for the bacterial technology in the estimation of NH3-N, TN, Transparency, DO, and TP should be measured with the utmost care.
For the estimation of NH3-N during the bacterial treatment of the polluted river in Xuxi River, it was proven that TN, Transparency, DO, and TP can be used more efficiently to yield better results. These results are an improvement from those yielded in a previous study conducted by Amos K. using a mathematical model to predict NH3-N under the bacterial technology, ultimately resulting in a RMSE of 2.1204.[5]
Table 3: Sensitivity analysis results’ of the most important parameters
| Inputs | output | structure | RMSE | r |
| NH3-N, TN, Transparency, DO and TP | NH3-N | 5 – 5 – 1 | 1.2081 | 0.9295 |
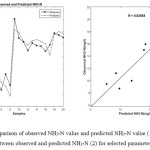 |
Figure 6: Comparison of observed NH3-N value and predicted NH3-N value (1); correlation between observed and predicted NH3-N (2) for selected parameters |
Conclusion
An artificial neural networks (ANN) was developed in this research to estimate the Ammonia Nitrogen (NH3-N) under the bacterial technology. A multilayer perceptron made of one input layer, one hidden layer and one output layer trained with the Levenberg–Marquard algorithm was used. The best structure of the networks were selected after many training by changing the numbers of neurons from 5 to 15 neurons in the hidden layer. The final structure 8 – 5 – 1, was made up of eight water quality variables as the inputs (DO, COD, TN, TP, SS, Temperature, Transparency, and NH3-N) in order to obtain the NH3-N as the output. Based on the minimum value of MSE of the training data set, the best network after training showed a coefficient of correlation (r) and a root mean square error (RMSE) of 0.91 and 2.61 respectively, with a good fit between the observed and the predicted NH3-N. A sensitivity analysis was carried out in order to evaluate the effects of the eight inputs variables on the NH3-N model. The results showed that by eliminating the Suspended sediment (SS), the Temperature, and COD from the inputs variables in the model, the coefficient of correlation and the RMSE improved significantly to 0.96 and 1.66 respectively. Four input variables (TN, Transparency, DO, and TP) affect the NH3-N significantly, thus could be used for further prediction for a more efficient result. Trained separately from the non-influential variables, their coefficient of correlation gave r = 0.9295 and the RMSE = 1.2081, which is much better than the previous training made of eight inputs variables. All these results demonstrate that the ANN proposed in this study can estimate the NH3-N with a good degree of accuracy under bacterial technology.
Acknowledgment
The authors are grateful to the reviewers especially Adrianna Carroll and Sarfraz Hashim for their reading of the manuscript, and for their suggestions and critical comments.
References
- Gao, J., Xiong, Z., Zhang, J., Zhang, W., Desalination, 2009, 242 (1- 3):193-204.
- DoddiYudianto, Yue-Bo Xie, Polish J. of Environ. Stud, 2010,. 19,. 2, 419-427.
- ZHOU, J.B., JIANG, M.M., CHEN, B., CHEN, G.Q.,Communications in Nonlinear Science and Numerical Simulation, 2007, 14, (4), 1781.
- Richardson, C.J. and Qian, S.S.,Environmental science & technology, 1999, 33(10):. 1545-1551.
CrossRef - Amos T. Kabo-Bah, XieYuebo and Song Yajing,Journal of Applied Sciences in Environmental Sanitation,2012, 7 93): 183-192.
- XieYuebo, Amos, T. Kabo-Bah and Song Yajing, Journal of Applied Technology in Environmental Sanitation, 2012, 2 (2): 87-93
- Arzayus, K.M., and Canuel, E.A.,Geochemical et cosmochimica act,2005, 69(2):. 455-464,
- Song, Y., X. Yuebo, and Peng, F., IEEE Conference, 2011.
- Huang, F.,Wang ,X.,Lou ,L., Zhou, Z., and Wu ,J., Water Research, 2010,. 44,. 5,. 1562–1572.
CrossRef - Amos T. Kabo-Bah*, XieYuebo, OleyibloOloche James Mark Amo-Boatengand Yiqing Guan, Orient J Chem,2012, 29,. (1):. 121-122
- Suen, J.P., Eheart, J Water Res Plan Manage, 2003, 129, 505–510.
CrossRef - Saaidpour S. Orient J Chem, 2014; 30(2).
- Belmiloud Y, Kadari A, Benahmed L, Cherquaoui D, Villemin D, Brahimi M, Orient J Chem2009;25(1).
- Khoshjavan S, Mazlumi M, Rezai B, Rezai M., Orient J Chem,2010;26(4).
- Wu, C. L., &Chau, K. W.,Journal of Hydrology, 2011, 399, 394– 409.
CrossRef - Nayak, P., Sudheer, K., Rangan, D., &Ramasastri, K., Journal of Hydrology, 2004, 291, 52–66.
CrossRef - Kralisch, S., Fink, M., Flügel, W. A., &Beckstein, C., Environmental Modelling and Software, 2003, 18, 815–823.
CrossRef - Sreekanth, J., &Datta, B., Journal of Hydrology, 2010, 393, 245–256.
CrossRef - Dogan,E.,Journal of Environmental Management,2009, 90, 1229–1235.
CrossRef - Kuo, J., Hsieh, M., Lung, W., & She, N., Ecological Modelling, 2007, 200, 171–177.
CrossRef - Najah, A., El-Shafie, A., Karim, O. A., &Jaafar, O., Hydrology and Earth System Sciences, 2011, 15, 2693–2708.
CrossRef - Anctil, F., Filion, M., &Tournebize, J., Ecological Modelling, 2009, 220, 879–887
CrossRef - Xiaohu Wen, Jing Fang, MeinaDiao, Chuanqi Zhang, Environ Monit Assess, 2013, 185:4361–4371.
CrossRef - Yasunobu Kato*, TetsuKumagai, Hiroshi Nishioka and YosohiroSugie, Orient J Chem, 2000,.17.: 1 Page No.
- SarfrazHashim, XieYuebo, Fiaz Ahmad, ChaudhryArslan, and Muhammad Saifullah, BioMed Research International,2015, vol. 2015, Article ID 241769, 11, 2015. doi:10.1155/2015/241769.
CrossRef - Song, Y., “Study on the simulation of water environment restoration using bacteria technology on the urban polluted river” (thesis), College of Hydrology and Water Resources, Hohai University, China, 2012.
- Simon Haykin, “Neural Networks:A Comprehensive foundation second edition”, Pearson Prentice Hall, Delhi India, 2005.
- L. Fausett, “Fundamentals of Neural Networks Architecture. Algorithms and Applications”, Pearson Prentice Hall, USA, 1994.
- WeiXuan Hu, “The Application of Artificial Neural Network in wastewater treatment”, IEEE, 2011.
- Mohammed, S. Jami, Mustapha Mujeli* and Nassereldeen, A. Kabbashi, African Journal of Biotechnology,2011, 10(81), . 18755-18762.
- Areerachakul, S.,World Academy of Science, Engineering and Technology, 2013, Vol: 7
- Erenturk, S., Erenturk, K.,J Food Engineering,2007, 78:905–912. 21.
- Maier, H. R., Jain, A., Dandy, G. C., &Sudheer, K. P., Environmental Modelling and Software, 2010, 25, 891–909.
CrossRef - Garson, G. D., “Neural networks: an introductory guide for social scientists”, California: Sage Publications, 1998.
- Elmolla, E. S., Chaudhuri, M., &Eltoukhy, M. M.,Journal of hazardous materials,2010, 179, 127–34.
CrossRef

This work is licensed under a Creative Commons Attribution 4.0 International License.
![]()
A New Edition of Web of Science
Journal Impact Factor
2022: 0.5
Five Year: 0.8
Journal is Indexed in

Cabells Whitelist
![]()


