Effect of supported transition metalCatalystsin NO removal reaction
Marzieh Hamidzadeh1,2, Mitra Ghassemzadeh1*,Aliakbar Tarlani1 and Saeed Sahebdel Far1
1Catalyst Research Group, Petrochemical Research and Technology Company, National Petrochemical Company, Tehran, Iran
2Chemistry and Chemical Engineering Research Center of Iran, Tehran, Iran. Corresponding Author Email: m.ghassemzadeh@yahoo.deDOI : http://dx.doi.org/10.13005/ojc/320155
Article Received on :
Article Accepted on :
Article Published : 10 Mar 2016
Selective catalytic reduction of nitrogenoxide with ammonia in the presence of excessive oxygen was investigated on transition metal oxides’catalysts(V, Cr, Mn, Fe)supported on HZSM-5. Meanwhile,catalyst V/ZSM-5 and Fe/ZSM-5 have shown the most activity and the conversion percentage of nitrogen oxidestonitrogenis more than 97% at temperatures above300°C, in these two catalysts. All synthesized catalysts possessed a good stability. Analytical characterization of synthesized catalysts were conducted by different methods of temperature programmed reduction, absorption and desorption of nitrogen, temperature programmed desorption of ammonia, X-ray diffraction and diffuse reflectance UV-vis spectroscopy. The less the apparentactivation energy is, the more their activity will be. Thus, the Cr/ZSM-5 and V/ZSM-5 catalysts showed the lowest and highest performance in this process, respectively.
KEYWORDS:catalyst; Selective catalytic reduction; manganese; vanadium; iron; zeolite
Download this article as:| Copy the following to cite this article: Hamidzadeh M, Ghassemzadeh M, Tarlani A, Far S. S. Synthesis of Phenolic-Based Resist Materials for Photolithography. Orient J Chem 2016;32(1). |
| Copy the following to cite this URL: Hamidzadeh M, Ghassemzadeh M, Tarlani A, Far S. S. Synthesis of Phenolic-Based Resist Materials for Photolithography. Orient J Chem 2016;32(1). Available from: http://www.orientjchem.org/?p=14865 |
Introduction
The removal reaction of NOx emissions is a major issue in recent decades to protect the environment[1, 2]. Catalytic reaction of NH3-SCR (Selective catalytic reduction) is shown in the general equation 1 [3].
4NO + 4NH3 + O2 → 4N2 + 6H2O (1)
If along with NO, NO2 exists in exhaust gas, the process will accelerate through the equation (2)[4].
2NO + 2NO2 + 4NH3 → 4N2 + 6H2O (2)
Nitrogen oxide emissions from vehicles are done by using the three-way catalysts from platinum family. Catalyst V2O5 / ZrO2 with calcium promoter was effective in the removal of NObyC3H6[5]. Studies showed that the catalysts of V2O5 / Ac [6], V2O5 / CNTs [7], V2O5-MnOx / TiO2-C [8], Mn-Ce / TiO2 [9], Ag-V/TiO2 [10], MnOx[11], MnO2-CeO2 [12], Mn / TiO2 [13, 14], Cr / TiO2 [15] and Fe / TiO2 [16] have been examined beforehand. Results have shown that some of these catalysts indicate good activity in low temperature. The V2O5-TiO2 catalyst has shown that its superiority is largely due to acid sites which depend on the size of vanadium involved in the reaction[17]. Since zeolites have acidic structures, modification of their catalytic properties is carried out by transition metalionsinmany chemical reactions. Zeolites as hosts of transition ions with the determined pore sizes inhibit orsinter the growth of nanoparticles of cation at high temperatures. During the last decade, the catalysts based on zeolite indicated a perfect process for this reaction. Cu-Zn / ZSM-5 [18], Cu-Fe / ZSM-5 [19] Cu / ZSM-5 [20] are among the investigated catalysts which have a high capability for the removal of NOx. The previous studies have mainly focused on the changes of the active component, synthesis and calcination temperature. Therefore,the impact of active component’s change son the nitrogen oxide removal reaction with ammonia reduction and excessive oxygen was studied. Cations selected from the first row transition metalsconsist of chromium, vanadium, manganese and iron and its base is ZSM-5 zeolite. Catalysts were prepared by ion exchange with chloride salts of the metals. In addition to the reactor test, the apparent activation energy for each of the catalysts has been calculated and then the catalyst characterization analysis has been performed.
Results and Discussion
FTIR Results
First,in Figure 1,catalysts containing vanadium, chromium, manganese and iron were compared with each other. Characteristic vibration bands were identified for H-ZSM-5 in the vicinity of wavelengths of 456, 554, 791 and 1100 cm-1in the sample ZSM-5; the bands of 1100,791 and 1456cm-1, were allocated to a symmetric bond stretching O-Si-O,symmetric stretching and vibration bondsT-O, respectively,within the tetrahedral network. In addition, peak in the range of 1547 cm-1 belongs to fived oubleringsin the network[22-23]. Vibration are a location of 790 cm-1 to 802 cm-1 is important in determining the amount of aluminum structure(QFAl) of zeolite.
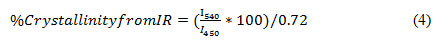
According to theFTIR spectrum and the υ2 vibration(about cm-1 790)the value ofQFAl (mg Al atoms / g zeolite)was calculated from equation (4).
QFAl = (802.5- υ2)/9.76 (3)
In these spectra, the increase in the intensity of the 1100cm-1 absorption band,Si-OT a symmetric stretching vibration band occursimultaneously with transition metals’ dopedions; this is a sign to remove aluminum from the zeolite and reduce the amount of QFAl and increase the Si / Al ratio. Changes in catalysts’ peaks with precursor of nitric acid were less. Also, the vibrational bands at 1223cm-1 is assigned to the external connections of TO4 tetrahedrons [24-25] which was observed in all catalysts. Bands of 1634 cm-1are assigned to the bending vibration of zeolite
water molecules. Two bands of 3226 and 3637 cm-1are attributed to OH stretching vibration and Bands around 3,600 to 3500 cm-1 belong to the Brønsted acidic conditions[25].As a result, it is attributed to bonding of the metal ion with OH (M-OH and Al-OH, respectively). A wide Band has appeared in the initial zeolitein this area. Weak Band sin 3750 to 3900 cm-1 related to the endsilanolh as appeared in all of synthetic catalysts. Absorption bands in 2020 cm-1in all IR spectrum are resulted from H-Si vibration or siliconimpurities in the zeolite’s structure[26-28]. It is expected that polyvanadate stretching vibration in870 cm-1 and characteristic vibration of V2O5 in 452, 475, 526, 696 and 996cm-1appear but none of them were found in the range of the catalyst. A minor shift in the vibrational bands is observed to the zeolite mother, which is asign of good vanadium distribution on the base. The stretching vibration mode of metaloxygen for the catalystsMn / ZSM-5 and Fe / ZSM-5 is 623 and 400 to 780 cm-1, respectively, and overlaps with the vibrations of the zeolite.
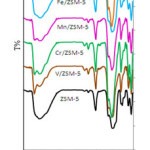 |
Figure 1: the FTIR spectrum Click here to View figure |
As shown in Figure1, the slight shift in the bars and a change in the irintensity are observed in the catalysts containing Mn, Crand V compared to zeolite; the results indicate that QFAlin the catalystinc reases in the following order.
Mn / ZSM-5 <Fe / ZSM-5 <V / ZSM-5 <Cr / ZSM-5 <ZSM-5
Therefore, the amount of aluminum removal is higher in the presence of chromium and iron.
Temperature programmed reduction
TP Rcurveis shown in Figure 2. Profile catalyst Mn / ZSM-5in less than 570°C indicates four peaks that are mutually overlapping and are centered in 425 and 536°C which is allocated to reduction of MnO2 to MnO through transmissions of Mn2O3 and Mn3O4. The peaks compared to the reduction of MnO2pure crystals appearat higher temperatures which are due to the high distribution of manganese in the base phase[29]. Peak reduction of Fe2O3 to FeO in the sampleFe / ZSM-5 only indicates a maximum of 390°C.
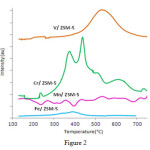 |
Figure 2: Comparisonof temperature programmed reduction curve of`catalystsM / ZSM-5 (M = Fe, Cr, V, Mn). Click here to View figure |
In the TPR curve of catalystV / ZSM-5,only a wide peak is observed at 390 to 650°C, which even in comparison with pure pent oxide vanadium, peak reduction has started at higher temperatures. Since the location of metal oxide in different sites, the structures of zeolite on its surface or in mesopores is possible, and ease of metal ions’ reduction in each of the positions is different; thus,g
enerally, reduction peaks are notbeamand narrow[30]. When the distribution of metal ionsinzeoliteis high, the connection between two metal ions and the surface occurs after the failure of M-O-M bonds in doped compounds and bond formation with Sior Alzeolite. The formation of new bonds in the structure of zeolite is confirmed with the changes of the location of metal oxide reduction peaks in the synthesis catalyst of the pure metal oxide and vibration displacement of these small bands fewer than 1200 cm-1in the FTIR compared to the higher frequencies in them other zeolite. Reduction peak at 370 and in 270°C are related to the reduction of Cr6+ to Cr3+in the Cr / ZSM-5 catalyst[31].
Absorption and desorption of nitrogen
Textural properties of catalyst including specific surface area, micro pore volume, mean size of pore, total pore volume and the external surface are shown in Table 1. As it is shown, the mean pore size in the mother zeolite is 1.77 nm and vanadium has no effect on the mean pore size. The effect of manganese, chromiumand iron(3.6 nm)is negligible. Radii of metal ions doped from 3d row to Al3+ are near sochanges in the pore volume is low. BET surface area of all catalysts to the mother zeolite has decreased, the external surface in the catalyst Mn / ZSM-5 has significantly increased which is a sign is the increased mesopositions. This factcor responds to the location of doped metal oxide on the surface of zeolite and not in the channels and pores, the aluminum ions’migration to external structure and formation of aluminum oxide. Sometimes by the leaching of aluminum from the frame, silicon becomes amorphousso the reduction ofQFAL is possible in the zeolite and this matches the absence of strong acid position in Mn / ZSM-5. Nitrogen’sdesorption and absorption is other mcurveonall catalystsis of type I, which represents the structure of micro spores.
Table 1: Comparison of nitrogen absorption and desorption of catalysts M / ZSM-50 (M = V, Cr, Mn, Fe)
|
component |
SBET (m2/g) |
Sext (m2/g) |
VMP* (cm3/g) |
S MP (m2/g) |
SMP |
Sext /SBET |
|
V/ZSM-5 |
195 |
11 |
0.10 |
184 |
95 |
5 |
|
V/ZSM-5 A |
175 |
12 |
0.08 |
163 |
93 |
7 |
|
Cr/ZSM-5 |
292 |
16 |
0.14 |
276 |
94 |
5.5 |
|
Mn/ZSM-5 |
327 |
19 |
0.15 |
308 |
94 |
6 |
|
Fe/ZSM-5 |
281 |
55 |
0.11 |
226 |
81 |
20 |
|
ZSM-5 |
348 |
34 |
0.17 |
314 |
90 |
10 |
|
ZSM-5/A |
292 |
18 |
0.13 |
274 |
94 |
6 |
|
A: After reactor MP: Micro Pore |
||||||
X-ray Diffraction
Figure 3 shows theXRD spectrum of catalysts containing vanadium, chromium, iron and manganese based onZSM-5.
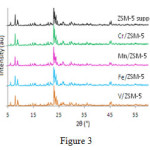 |
Figure 3: XRD spectrum ofcatalystsM / ZSM-5 (Zn, Fe M = Cr, V,) Click here to View figure |
Major peaks in ° 9/23, ° 9/8, ° 94/7 = 2θ (JCPDS Card No: 049-0657) are the characteristics of ZSM-5 and 6.2°, 26.3° = 2θ (JCPDS Card No: 46-1045) are the characteristics of quartz. After the placement of the active component, in XRD structures, the peaks of ZSM-5 and the crystalline structure reduce and this reduction in crystallization occurs with the decrease in the micropores and all pores of the catalyst to ZSM-5; and alters the ratio of Si/ Al to the framework of zeolite. Size of crystals in catalystsV / ZSM-5, Fe / ZSM-5, Zn / ZSM-5, Cr / ZSM-5,is57.9 nm, 61.8, 67.9 and 70, respectively, showing small changes.Calculation of unit cell in the orthorhombic structure are shown in Table 2. According to the Table,unit cell size in the catalysts between increases between 2.3% to 3.7%. Crystallinity of catalysts was calculated according to XRD using the main line 23.9; the results show that the crystallinity of Cr / ZSM-5 increases when comparing with mother zeolite. This means that some of the atoms of Sior Al have been transformed into crystalline form from the amorphous initial compounds. Decrease incrystallinity in other catalysts isdue to the leaching of the aluminum to the external sides of the structure and the filling of the poresbysilica.
Table 2: Comparison ofXRD results ofcatalystM / ZSM-50 (M = V, Cr, Mn, Fe)
|
Sample |
Unit Cell Parameter (Å) |
Volume |
Density |
Crystallite Size (nm) |
||
|
a |
b |
c |
Å3 |
g/cm3 |
||
|
ZSM-5 |
20.092 |
19.3498 |
13.4468 |
5227.78 |
1.92 |
59 |
|
V/ZSM-5 |
19.922 |
20.1225 |
13.3406 |
5348 |
1.88 |
57.9 |
|
Mn/ZSM-5 |
20.058 |
20.1520 |
13.4168 |
5423.18 |
1.86 |
67.9 |
|
Fe/ZSM-5 |
20.08414 |
20.1394 |
13.3913 |
5416.53 |
1.86 |
61.8 |
|
Cr/ZSM-5 |
19.7006 |
20.2044 |
13.6065 |
5415.931 |
1.86 |
70 |
|
Standard |
20.0480 |
19.8840 |
13.3520 |
5322.57 |
1.89 |
|
Thermal programmed desorption of ammonia
Two peaks are mainly observed inzeolites; one at a low temperature and the other at a high temperature in NH3-TPD. Since the zeolite sample is acidic and possess high crystallinity, the number of molecules of ammoniadesorbed at high temperature are proportional to the number of atoms of aluminumin zeolites. Ammonia which is desorbed at low temperatures, is mainly absorbed on metalcation, while in Hformor shape of the acidic zeolite, NH3 is absorbed on Bronsted acid sites and NH4+. The driving force behind this kind of absorption is mainly based on the electrostatic interactions between the sites of ion exchange and N-H bonds. The interaction of water molecules with such status(hydrogen bonding) is stronger than the interaction of ammonia, because the polarity ofO-H in water is more thanN-H of Ammonia, so this type of ammonia are replaced with water. Thus, low temperaturepeak has no solidacidicproperties on theHzeolite. In other words,the ammonia that remains after the water evaporation must interact with acidic sites, because the amount of ammonia is more than water. While ammonia is absorbed on the Brønsted acid sites, it can also absorb on the sites of Alor Al out side the structure of zeolites. When the ammonia is adsorbed on the solid acid(ions with high loads and low beam) due to the strong interaction at a higher temperatured esorption is occurred; so in the catalyst containing +Cr6, we expect the high temperatured esorption peak to have more intensity. Figure 4.indicates the analysis Chart of TPD-NH3 catalyst containing chromium, vanadium, manganese and iron; these catalysts showed three acidic positions of weak, average and strong. Strong acidic sites -higher than° C300- are observed in the catalyst having vanadium and chromium and zeolite and desorption peaks in the other catalyst is observed in the range of 150 to 180° C. Accordingly, there wasn’t any strong acidic siteinMn / ZSM-5, while in the V / ZSM-5 weak acidpositions were disappeared and the number of very strong acid sites increased.Fe / ZSM-5consists of two overlapping peaks, and is placed in the weak acidic and relatively strong acidic positions and Cr / ZSM-5 catalyst contains weak, moderate, strong and very strong positions.
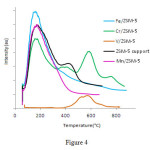 |
Figure 4: The spectrum of TPD-NH3 of catalystsM / ZSM-5 (M = Cr, V, Fe, Mn) |
UV spectrum (DRS-UV-Vis)
The solid state UV Spectrum(reflective penetration) catalysts ofM / ZSM-5 (M = V, Cr, Mn, Fe)are shown in Figure 5. In the catalyst V / ZSM-5, the location of transfer band’s load of oxygen and vanadium depend on the number of oxygen around central vanadium ion atoms(symmetry). Several arrangements are possible for VOx. If the VOx is tetrahedral, the absorption band appears in 240 nm, while for the arrangements of squarepyramid and octahedron,absorption is expected in 340 and 410 nm respectively. Based on the spectrum of sampleV/ZSM-5,most of theVOx varieties are distorted in the tetragonalsymmetry(band around 256 nm)[33].
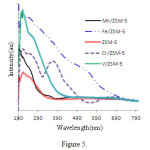 |
Figure 5: UV-Visspectrum of catalystsM / ZSM-5 (M = Cr, V, Fe, Mn) |
Two types of electron capture are seen in the catalyst Fe / ZSM-5; the first one in the region of 400 to 600 nm with maximum is attributed to 554 nm the ligand field 4T2 (4G) → 6A1Fe3 +high spin. The second one is in the 360 to 380 nm related to load transfer from ligand to the metal [33]. Maxim a observed in the 356 and nm 495 are attributed to Fe2O3[34]. The presence of MnO in Mn / ZSM-5 is confirmed because of the wide absorption in 506 nm and is related to the transfers of4T1g (4G) → 6A1g (S). Three bands of 330, 490 and 790nm are related tothe transfer ofdd in Mn2O3varieties [35-37]. Thetwo bands of 212, 252 nm in catalystCr / ZSM-5belong toCr3+inCr2O3,and two bands of374 and 605 nm re related to the CrOx clusters. UV-Vis spectra of metal oxides are similar to M / ZSM-5 of eachion so there were no significant geometrydeviations after their placement on the base.
Reactor test ofM / ZSM-5Catalysts
The activities of M / ZSM-5 (M = Mn, V, Cr, Fe) catalystsat 200 to 360°Cis shown in Figure 6 for removing reactions of NO. Achromium catalystis not appropriate for this reaction and the increase in temperature of all catalysts causes an increase in their activity, then they reach to a maximum.Only the catalyst Fe / ZSM-5 indicates a mild negative change inslope, after reaching amaximum of 97% in 250 °C.
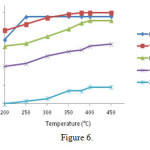 |
Figure 6: The activity of catalysts M / ZSM-5 (M = Cr, V, Mn, Fe) at200 to 450° C |
Table 3 shows the apparent activation energy of the reaction by varying the temperature from 200 to400 ° C. Two catalysts of Mn /ZSM-5andV/ ZSM-5 have had the lowest activation energy and the highest activation energy. Value of the apparent activation energy on HZSM-5 (55kJ / mol)is much less(38), but with the values of2.7 to9 kJ / mol, it has allocated higher amounts compared with other researches (39).
Table 3: Comparison of the activation energy of catalystsM / ZSM-50 (M = Cr, V, Mn, Fe)
|
Eact (Kcal/mol) |
Samples |
|
23. |
V(Cl)/ZSM-5 |
|
24.8 |
Mn(Cl)/ZSM-5 |
|
35.9 |
Cr(Cl)/ZSM-5 |
|
23.2 |
Fe(Cl)/ZSM-5 |
|
Eact: Apparent activation energy |
|
According to Figure7.Catalysts were stable for 24 hours at a constant temperature of 360°C; the best results belong to catalysts containing iron orvanadium.
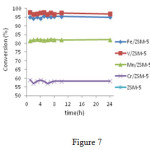 |
Figure 7: catalysts. M / ZSM-5 (M = Cr, V, Mn, Fe) at360° C Click here to View figure |
Experimental section
Preparation of catalyst
The ZSM-5 zeolite was purchased from Zeolyst Co. with the SiO2/Al2O3 ratio of 40 with an area of 348 m2/g. The zeolite was then added to a 0.2M saline solution of manganese-, chromium-, vanadium-, or iron chloride. The slurry was stirred for 15 minutes, then transferred to a static reactor of acetyl with a Teflon coating, and finally placed in a 60°C oven for two hours. The resulting sample was washed with deionized water, dried in an oven at 150°C for 12 hours, and calcinated in a furnace at 480°Cfor 4 hours. The furnace’s temperature elevation rate was 3°C/min.
Characterization of the catalyst
The surface area, total pore volume, external surface area, the volume of micropores, and the mean size of pores were measured through the nitrogen absorption and desorption isotherm at 77 K within the relative pressure range (P/P0) of 0.04-0.99 using a nitrogen absorption analyzer, the Quantochrom Nova 2000. Before measurement, all of the samples were degasified for three hours at 150°C for 3 hours. The area of the total surface area and the external surface was obtained using the BET method and t-method, respectively. The total volume of the pores was obtained from the volume of the desorbed nitrogen at the relative pressure of 0.99. The mean size of the pores was also determined based on the desorption data using the BJH method.
The x-ray diffraction pattern(XRD) of the samples was recorded with a Philips diffractometer, using CuKα radiation (λ= 1.54050 Å) within the angle range of 2θ from 4 to 89°, followed by identification of the crystal phase using the files of the Joint Committee on Powder Diffraction Standards (JCPDS). The Scherer equation was used to obtain the size of the crystals. Based on the distance between the lines and the orthorhombic crystal structure in the ZSM-5 zeolite as the main phase, the dimensions of the unit cell and its volume were calculated.
The temperature-programmed reduction (TPR) and ammonium temperature-programmed desorption tests were carried out using a BELCAT A with a TCD detector; its heating rate was programmable within the range of 25 to 1000°C. For the TPR test, around 50 mg of the samples was heated in an argon atmosphere with the flow rate of 50 cm3g-1 for two hours at 150°C. Next, the temperature was raised from 150 to 800°C under a flow of 5% of H2 in Ar with the same flow rate of 50 cm3g-1. Then it was fully reduced at this temperature.
In order to determine the number of acidic sites and the acidic power of the catalysts, TPD-NH3 analysis was performed on each catalyst. First, about 100 mg of the sample was heated in a helium atmosphere with a flow rate of 50 cm-3g-1 for one hour at 300°C. Next, it was cooled down to 60°C, and then saturated with ammonium for one hour under the flow of 2.5%NH3/He. Finally, physically absorbed ammonium desorption was carried out by first passing helium over the catalyst surface for 30 min, then by increasing the temperature at a rate of 10°C min-1 to 700°C, causing the desorption to occur.
To study the influence of electron transfer, the diffuse reflectance UV-visible spectroscopy (Shimadzu Company)was used.
To identify the structural vibrations, the level of crystallinity of the structure, and the amount of aluminum available within the hydrated zeolite framework (QFAL), FTIR analysis was used. The level of crystallinity for the zeolites with an MFI structure was calculated by the following equation (1):
The FTIR analyzer device, Bruker Vertex 80 model, was equipped with a MCT-NB mercury cryogenic detector.
Catalyst efficiency test
The catalyst activity test was carried out on 2g of the catalyst by a selective catalytic reduction (SCR) reaction of nitrogen oxide in the presence of ammonia and excessive oxygen on an Inconel-800 fixed bed reactor with an internal diameter of 9mm. The feed compound contained 2.6% O2, 350 ppm NH3, 350 ppm NO, with the remaining balance being nitrogen. The gas hourly space velocity (GHSV) was 30000 h-1 and the conversion percentage was determined using a gas analyzer, the Testo 340, as a function of time and temperature (200 to 400°C). The catalytic activity was calculated using equation (1):
NOx conversion = (inlet NOx (ppm) − outlet NOx (ppm) ×100) /inlet NOx (ppm) (5)
Calculation of the activation energy was conducted using the Arrhenius relation at a low temperature.
Conclusions
- In the selective catalytic reduction reaction with ammonia, the catalystsFe / ZSM-5andV / ZSM-5 indicated the lowest apparent activation energy.
- Two catalysts of Fe / ZSM-5andV / ZSM-5 indicated a conversion percentage higher than 97% for the conversion of NO to nitrogen; so the possibility of replacement of iron instead of vanadium for the reaction is valid in the industry.
- Decreasing in the apparent activation energycreates increasing the activity of the catalyst.
- Crystallinity is reduced in allcatalysts when comparing with mother zeolite, except for Cr / ZSM-5catalyst.
Abbreviations
The following abbreviations are used in this manuscript:
SCR: Selective catalytic reduction
TPR: Temperature programmed reduction
TPD: Temperature programmed desorption
XRD: X-ray diffraction
DRS: Diffusion reflectance spectroscopy
References
- Kang, W ; Choi, . B;Thermo-diffusion, diffusion-thermo and chemical reaction effects on MHD flow of viscous fluid in divergent and convergent channelsChem. Eng. Sci., 2016, 141, 175–183.
CrossRef
- Li, S.; Hao, Q.; Zhao, R.; Liu, D.; Duan, H.; Dou, B. ;Highly efficient catalytic removal of ethyl acetate over Ce/Zr promoted copper/ZSM-5 catalysts.Chem. Eng. J., 2016, 285, 536-543.
CrossRef
- Koebel, M., and Strutz, E. O., “Thermal and hydrolytic decomposition of urea for automotive selective catalytic reduction systems: thermochemical and practical aspects, Ind. Eng. Chem.Res., 2003, 42, 2093- 2100.
CrossRef
- Devadas, M., Kröcher, O., Elsener, M., Wokaun, A., Söger, N., Pfeifer, M., Demel, Y., Mussmann, L., Influence of NO2 on the selective catalytic reduction of NO with ammonia over Fe‐ZSM5, Appl. Catal., B.,2006,67, 187- 196.
CrossRef
- Ohno, T.; Tanaka, E.; Hatayama, F.; Toda Y.; Miyata, H.;Promoting effect of Pt addition to V2O5/ZrO2 catalyst on reduction of NO by C3H6 ,Catal. Let. 2001,77(4) 183-187.
CrossRef
- Zhu Z; Liu Z.; Liu S.; Niu H. Catalytic NO reduction with ammonia at low temperatures on V2O5/AC catalysts: effect of metal oxides addition and SO2ApplCatal B, 2001, 30:267-276.
- Huang B., Huang R, Jin D., Ye D. Low temperature SCR of NO with NH3 over carbon nanotubes supported vanadium oxides, Catal Today. 2007,126, 279-283.
CrossRef
- Li Q.; Yang H.; Nie A.; Fan X.; Zhang X.;Catalytic Reduction of NO with NH3 over V2O5-MnOX/TiO2-carbon nanotube compositesCatalLett.2011, 141:1237–1242.
- Jin R.; Liu Y.; Wu Z.; Wang H.; Gu T.; Low-temperature selective catalytic reduction of NO with NH3over Mn–Ce oxides supported on TiO2and Al2O3: A comparative study, Chemosphere2010, 78,1160-1166.
CrossRef
- Zaihua W.; Xinjun L.; Wenji S.; Jinfa C.; Tao L.; Ziping F. Promotional effect of Ag-doped Ag-V/TiO2 catalyst with low vanadium loadings for selective catalytic reduction of NOx by NH3. ReacKinetMechCat ,2011, 103 : 353-365.
CrossRef
- Tang X, Hao J, Xu W, Li J ,Low temperature selective catalytic reduction of NOx with NH3 over amorphous MnOcatalysts prepared by three methods. CatalCommun ,2007, 8: 329-334.
CrossRef
- Qi G.; Yang R.; Characterization and FTIR Studies of MnOx−CeO2 Catalyst for Low-Temperature Selective Catalytic Reduction of NO with NH3 ,J PhysChem B ,2004, 108(40) 15738–15747.
CrossRef
- Smirniotis P.G.; Sreekanth P.M.; Pena D.A.; Jenkins R.G.; Manganese oxide catalysts supported on TiO2, Al2O3, and SiO2: A comparison for low-temperature SCR of NO with NH3, IndEngChem Res .2006, 45, 6436-6443.
CrossRef
- Wang T.Y.; Sun K; Lu Z.; Zhang Y.J.; Low temperature NH3-SCR reaction over MnOxsupported on protonated titanate, React KinetMechCatal , 2010, 101:153-161.
CrossRef
- Schneider H, Maciejewski M, Kohler K, Wokaun A, BaikerAChromia Supported on Titania: VI. Properties of Different Chromium Oxide Phases in the Catalytic Reduction of NO by NH3Studied byin SituDiffuse Reflectance FTIR Spectroscopy. J Catal.,1995, 157,312-320.
CrossRef
- Long R.Q.; Yang R.T.; Selective Catalytic Oxidation of Ammonia to Nitrogen over Fe2O3–TiO2Prepared with a Sol–Gel Method, J Catal2002, 207,158-165.
CrossRef
- Kang, M.; Choi,J.; Kim,Y. T.; Park, E. D.; Shin, C. B.;Suh,D. J.; Yie, J. E.;Effects of preparation methods for V2O5-TiO2aerogel catalysts on the selective catalytic reduction of NO with NH3, Korean J. Chem. Eng., 2009, 26(3), 884-889.
CrossRef
- Abdullah, Z.; Abdullah, H. ; Bhatia, S. ; Salamatinia, B. ; Mootabadi, H.; Simple Kinetic Modeling of Selective Reduction of Nitric Oxide in Diesel Exhaust Over Cu-Zn/ZSM-5 Monolithic Catalyst, Iran. J. Chem. Eng., 2010, 7, (3), 74-80.
- Sultana, A.; Sasaki, M.; Suzuki, K.; Hamada, H.;Tuning the NOx conversion of Cu-Fe/ZSM-5catalystin NH 3-SCR, Catal. Commun. , 2013, 41, 21–25.
CrossRef
- Hamidzadeh, M. ; Ghassemzadeh, M. ;Tarlani, A. ; Sahebdelfar, S. ; A Comparative Study of M/ZSM-5 (M= Pd, Ag, Cu, Ni) Catalysts in the Selective Reduction of Nitrogen (II) Oxide by Ammonia, IJSRST, 2015, 1 ( 1) 6-11.
- Joshi, S.Y.; Kumar, A.; Luo, J.; Kamasamudram, K.; Currier, N. W.; Yezerets, A.; Combined experimental and kinetic modeling study of the bi-modal NO x conversion profile on commercial Cu-SAPO-34 catalyst under standard SCR conditions, Appl. Catal. B., 2015, 165, 27-35.
CrossRef
- Aly, H. M. ; Moustafa, M. E.; Abdelrahman, E. A. ;Effects of ultrasonic treatment on zeolite NaA synthesized from by-product silica, Der ChemicaSinica, 2011, 2 (4),166-173.
- Vieira, S. S.; Magriotis, Z. M.; Ribeiro, M. F.; Graça, I.; Fernandes, A.; Manuel J.; Lopes , F.M. ; Coelho, S. M.; Santos, N. V.; Saczk, A. Ap.;Use of HZSM-5 modified with citric acid as acid heterogeneous catalyst for biodiesel production via esterification of oleic acid,Micropor. Mesopor. Mat. 2015, 201, 160–168.
CrossRef
- Mohan, N.; Cindrella, L.; Direct synthesis of Fe-ZSM-5 zeolite and its prospects as efficient electrodematerialin methanol fuel cell, Mat. Sci. Semicon. Proc.,2015, 40, 361–368.
CrossRef
- Mohamed, R.M.; Fouad, O.A.; Ismail, A.A.; Ibrahim, I.A. ; Influence of crystallization times on the synthesis of nanosized ZSM-5, Mater. Lett.2005, 59, 3441-3444.
CrossRef
- Chang, Y. ; Jun, L.; Li, J.-S. ; Yang, Y.-C. ; Sun, X.-Y. ;Preparation and characterization of nanosized ZSM-5 zeolites in the absence of organic template, Mater. Lett.2005, 59 , 3427-3430
CrossRef
- Karimi, R.; Bayati, B.; Aghdam, N. C.; Ejtemaee, M.; Babaluo, A. A.; Studies of the effect of synthesis parameters on ZSM-5 nano crystalline material during template-hydrothermal synthesis in the presence of chelating agent, Powder Technol. ,2012, 229, 229–236.
CrossRef
- Cheng, Y.; Liao, R.H.; Li , J.S.; Sun, X.Y.; Wang, L.J.; Synthesis research of nanosized ZSM-5 zeolites in the absence of organic template, J. Mat. Proc. Technol., 2008, 206, 445–452.
CrossRef
- Thirupathi, B.; Smirniotis, P.G.; Co-doping a metal (Cr, Fe, Co, Ni, Cu, Zn, Ce, and Zr) on Mn/TiO2catalyst and its effect on the selective reduction of NO with NH3 at low-temperaturesAppl. Catal. B, 2011,110, 195-206.
CrossRef
- Jung, S. M.; Demoulin, O.; Grange, P.; The study of a synergetic effect over a H-ZSM-5/V2O5 hybridcatalyston SCR reaction, J. Mol. Catal. A,,2005, 236 (1–2), 94-98.
CrossRef
- Ayari, F. ; Mhamdi, M.; Álvarez-Rodríguez, J.; Guerrero Ruiz, A.R. ; Delahay, G. ; Ghorbel, A. ; Selectivecatalyticreduction of NO with NH3 over Cr-ZSM-5catalysts: General characterization andcatalystsscreening, Appl. Catal. B, 2013, 134–135, 367-380.
CrossRef
- López-Fonseca, R. ; de Rivas, B.; Gutiérrez-Ortiz, J.I.; Aranzabal, A.; González-Velasco, J.R. ; Enhanced activity of zeolites by chemical dealumination for chlorinated VOC abatement, Appl. Catal. B, 2003, 41, 31–42.
CrossRef
- Karge, H.G. ;Characterization by infrared spectroscopy, Micro. Meso. Mater. ,1998, 22(4-6), 547–549.
CrossRef
- Manigandan, R.; Giribabu, K.; Suresh, R.; Munusamy, S.; Praveen kumar, S.; Muthamizh, S.; Stephen A.; Narayanan, V.; Characterization and Photocatalytic activity of Nickel oxide nanoparticles. Int. J. Chemtech. Res.2014, 6 (6), 3395-3398.
- Ivanova, A. S.; Slavinskaya, E. M. ; Stonkus, O. A. ; Zaikovskii, V. I. ; Danilova, I. G. ; Gulyaev, R. V. ; Bulavchenko, O. A. ; Tsibulya, S. V. ; Boronin, A. I. ; Low-temperature oxidation of carbon monoxide over (Mn1− x M x) O2 (M= Co, Pd)catalysts, Kinet. Catal.,2013,54, (1) ,81–94.
CrossRef
- Chmielarz, L.; Wegrzyn, A.; Wojciechowska, M.; Witkowski, S.; Michalik, M.; Selective catalytic oxidation (SCO) of ammonia to nitrogen over hydrotalcite originated Mg–Cu–Fe mixed metal oxidesCatal. Lett.2011,141, 1345–1354.
- Togashi, H.; Kojima, N.; Ban, T. ; Tsujikawa, I.; Optical Absorption by Mn 2+ Ions in MnM (edta) 6H2O (M= Zn, Cu, Ni, and Co), Bull. Chem. Soc. Jpn. 1988, 61, 1903-1909.
CrossRef
- Stevenson, S. A.; Vartuli J. C.; Brooks, C. F.; Kinetics of the selective catalytic reduction of NO over HZSM-5, J. Catal.2000,190, 228–239.
CrossRef
- Yamamoto,A.; Mizuno,Y.;Teramura,K.; Shishidoab,T.; Tanaka,T.;Effects of reaction temperature on the photocatalytic activity of photo-SCR of NO with NH3over a TiO2photocatalyst, Catal. Sci. Technol., 2013,3, 1771-1775.
CrossRef

This work is licensed under a Creative Commons Attribution 4.0 International License.
![]()
A New Edition of Web of Science
Journal Impact Factor
2022: 0.5
Five Year: 0.8
Journal is Indexed in

Cabells Whitelist
![]()


