Application of response surface methodology to modeling and optimization of removal of Bismarck Brown and Thymol Blue by Mn-Fe2O4- NPs-AC: Kinetics and thermodynamic studies
Saideh Bagheri*
1Department of Chemistry, Science and Research Branch, Islamic Azad University, Tehran P.O.Box14515-755, Tehran ,Iran corresponding author Email :sbagheri2010@yahoo.com
DOI : http://dx.doi.org/10.13005/ojc/320163
Article Received on :
Article Accepted on :
Article Published : 03 Mar 2016
The focus of this research is on the rapid ultrasound-assisted removal of Bismarck Brown (BB) and Thymol Blue(TB) dyes from aqueous solutions using Mn-Fe2O4 nanoparticles loaded on activated carbon (Mn-Fe2O4- NPs-AC) as a low cost and environmental friendly adsorbent. The adsorbent was characterized by SEM, FTIR and XRD. The effect of variables such as initial concentration of BB, initial concentration of TB, pH of the solution, adsorbent dosage and sonication time on the removal percentages of BB and TB dyes were simultaneously investigated by central composite design(CCD) under response surface methodology(RSM). It was shown that the adsorption of BB and TB follows the pseudo-second-order rate equation, while the Langmuir model explains equilibrium data. Isotherms had also been used to obtain the thermodynamic parameters such as free energy (ΔG0), enthalpy (ΔH0) and entropy (ΔS0) of adsorption. The negative value of ΔG0 indicates the feasibility and spontaneity of the adsorption process. The positive ΔH0 suggests the endothermal nature of the adsorption. The positive values of ΔS0 reflects the affinity of Mn-Fe2O4- NPs-AC towards BB and TB dyes. A small amount of the adsorbent was able to remove more than 99.0% of both dyes rapidly with high adsorption capacity in binary-component system( 70.3 mg/g for BB, and 48.48 mg/g for TB).
KEYWORDS:Nanoparticle-loaded activated carbon; Response surface methodology; Ultrasound-assisted dye removal; Thymol Blue; Bismarck Brown
Download this article as:| Copy the following to cite this article: Bagher s. Application of response surface methodology to modeling and optimization of removal of Bismarck Brown and Thymol Blue by Mn-Fe2O4- NPs-AC: Kinetics and thermodynamic studies. Orient J Chem 2016;32(1). |
| Copy the following to cite this URL: Bagher s. Application of response surface methodology to modeling and optimization of removal of Bismarck Brown and Thymol Blue by Mn-Fe2O4- NPs-AC: Kinetics and thermodynamic studies. Orient J Chem 2016;32(1). Available from: http://www.orientjchem.org/?p=14579 |
Introduction
The industrial waste water such as textile waste water contains plenty of toxic dyes which are harmful for ecosystems and humans [1, 2]. Among the several types of dyes including anionic (reactive dyes), cationic (basic dyes), and non-anionic (disperse dyes), the cationic once are the most toxic dyes [3]. Among several methods for dyes removal from aqueous solution such as membrane separation [4, 5] chemical oxidation and adsorption, the adsorption technique is known as one of the efficient methods for dye removal [6–8]. Bismarck Brown (BB) as a basic dye is used in textile and leather biological stain. The solution of this odorless powder in water is brown [9]. Thymol Blue (TB), belonging to triphenylmethane group, has biological activity like stain agent The TB dye is also used as pH indicator in analytical chemistry. Inhalation lead to respiratory tract exposure and subsequently Symptoms include coughing and shortness of breath. Skin Contact might cause irritation with redness and pain [10]. Metal oxide nanoparticles, with their potential applications in the fields of physics, chemistry, biology, and medicine has attracted increasing research attention from the past decades because of their interesting physical and chemical properties. Over the last decade, magnetic nanoparticles (MNPs) are of great interest for researchers from a wide range of disciplines, including magnetic fluids [11], catalysis [12, 13] biotechnology/biomedicine [14], magnetic resonance imaging [15, 16], data storage [17] and environmental remediation [18, 19]. Super paramagnetic iron oxide nanoparticles have received increasing attention in areas as different as physics, chemistry, materials science, biology, and medicine, motivated by their unusual surface and magnetic properties [20]. Conventional and classical optimization protocol (one at a time) failed to give useful knowledge about the interaction between variables while requiring intensive labor and consuming long time because of requiring high number of experiments. Central composite design (CCD) under response surface methodology (RSM) can efficiently be applied for handling both variables involved and responses without suffering above-mentioned draw backs. This approach enables researchers to make a suitable predicative model to apply for several factors even in the presence of complex interactions to describe responses and find the optimal conditions with less time elapsed [21–22]. In the present work, Mn-Fe2O4 nanoparticle-loaded on AC(Mn-Fe2O4 -NPs-AC) as a novel adsorbent was simply synthesized and subsequently characterized by scanning electron microscopy(SEM), Fourier transform in infrared spectroscopy(FTIR) and X-ray diffraction(XRD) analysis. The influence of important variables (BB concentration, TB concentration, pH, amount of adsorbent and sonication time) were investigated and optimized by central composite design (CCD) under response surface methodology (RSM). It was shown that the adsorption of BB and TB follows the pseudo-second-order rate equation. The Langmuir model was found to be applied for the equilibrium data explanation. The EXPERT, a statistical software package was used for experimental design analysis and their subsequent regression analysis.
Materials and methods
Materials and instruments
Bismarck Brown 4,4′-[1,3-Phenylenbis(azo)]-bis[1,3-phenyldiamin] and Thymol Blue 3,3-bis(4-hydroxy-5-isopropyl-2-methylphenyl)-3H- benzo[c][1,2] oxathiole 1,1-dioxide are fully described in Table1.They were supplied from Merck(Darmstadt, Germany). The stock solution (100mg/L) of each dye was achieved following dissolution of 10 mg of which in100 mL double distilled water, separately and suitable dilute on was performed to obtain working solution with desired concentration. The Mn-Fe2O4-NPs-AC was prepared and characterized by XRD and SEM. The morphology of the Mn-Fe2O4 -NPs-AC was observed by scanning electron microscopy (SEM; HitachiS-4160). X-ray diffraction (XRD) pattern was recorded by an automated Philips X’PertX-ray diffractometer with CuKα radiation (40 kV and 30 mA) for 2θ values over 10–80°. Fourier transform infrared spectroscopy (FTIR in the range of 500–4000 cm−1) of the adsorbent was recorded using FTIR spectrophotometer (Model:FT-IR JASCO 460 Plus). The spectra obtained were analyzed. The PH measurements were carried out using pH/Ion meter model-728 (Metrohm, Switzerland, Swiss) and the BB and TB concentrations were determined using Jasco UV–Vis spectrophotometer model V-530 (Jasco, Japan) at wave-lengths of 448 nm and 650 nm, respectively. An ultrasonic bath with heating system (Tecno-GAZ SPA Ultra Sonic System, Korea) at frequency 50 Hz and power 296W was used for the ultrasound-assisted adsorption procedure. The STATISTICA, a statistical software package version 10.0 (Stat Soft Inc., Tulsa, USA), was used for experimental design analysis and their subsequent regression analysis.
Ultrasound-assisted multi-component adsorption of BB and TB on to Mn- -NPs-AC
A batch process using Mn- -NPs-AC in presence of ultrasound was applied for binary adsorption of BB and TB, while all experiments were under taken in a cylindrical glass vessel by adding 0.03g of adsorbent to 50 ml of BB and TB at PH 6.0 as optimum value. The vessel was immersed in an ultrasonic bath for 5 min at room temperature and subsequently the solutions were centrifuged. Then, non-adsorbed dye contents were determined by using UV–Vis spectrophotometer set at wavelengths 448 and 650 nm for BB and TB, respectively.
Measurements of dye uptake
The dye concentrations were determined from calibration curve obtained at maximum wavelength over working concentration range. The efficiency of dyes removal was determined at different experimental conditions optimized using the CCD method. The experiments were also performed in the initial dye concentration range of 2-18 mg/L to obtain adsorption isotherms. The removal percentage of each dye was calculated using the following equation: 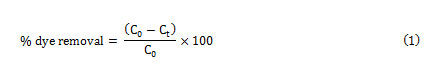
Where C0 (mg L-1) and Ct(mg L-1) is the concentration of target at initial and after time t respectively. 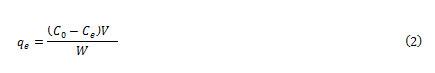
where C0 (mg L-1) and Ce(mg L-1) are the initial dye concentration and equilibrium dye concentration in aqueous solution, respectively, V (L) is the solution volume and W (g) is the adsorbent mass.
Preparation of Mn-Fe2O4– NPs-AC
Activated carbon was purchased from Chem lab Company and used as a support material for the prepared MnFe2O4-NPs. The reaction solution for loading MnFe2O4 nanoparticles on activated carbon (Ac) was prepared as follows: The MnFe2O4 nano powders were synthesized by the conventional co-precipitation method. The Fe (Cl)3.6H2O and Mn(Cl)2. 4H2O salts (molar ratio of Fe: Mn = 2:1) were dissolved in 300 mL pure water. Temperature of solution adjusted to 80◦C. Then while stirring and under nitrogen gas atmosphere, 50 mL of NaOH (2 M) were gently added to the solutions to adjust its pH; the solution was stirred for 2 h at 80 ◦C under N2. Following this, the color of the bulk solution changed from orange to black. The black MnFe2O4 NPs were separated by an external permanent magnet. The precipitates were washed several times with deionized water and ethanol. The synthesized MnFe2O4 nanoparticles were dried in 70 ◦C for 12h and calcined at 500 ◦C for 4h in air, the nano-MnFe2O4 powders were obtained. Then in order to loaded MnFe2O4 nanoparticles on carbon active, 2g carbon active was added 200 ml ethanol and sonicated for 1 h. 0.4g MnFe2O4 nanoparticles was add to mixture, while mixture was sonicated .subsequence, prepared mixture was stirred for 20h. The obtained products were filtrated, washed and collected, then dried in a hot air oven at in 70 ⁰C for 16 h. Finally the dried precipitate was grinded into powder form.
Table 1: Properties of the dyes.
| Properties | Bismarck Brown(BB) | Thymol Blue(TB) |
| Appearance | dark brown powder | Brownish-green powder |
| CAS number | 10114-58-6 | 76-61-9 |
| Chemical formula | S | |
| Molecular weight (g/mol) | 419.31 | 466.59 |
| Maximum wavelength(λmax) (nm) | 448 | 650 |
| Class | azo | Triphenyl methane |
| Use | textile, leather, biological stain | indicator, , biological stain |
Table 2: Experimental factors and levels in the central composite design.
| Factors | levels | Star pointα = 2.37 | |||||
| Low(-1) | Central (0) | High (+1) | -α | +α | |||
| Concentration (mg/L) (A) | 6 | 10 | 14 | 2 | 18 | ||
| Concentration (mg/L) (B) | 6 | 10 | 14 | 2 | 18 | ||
| pH (C) | 2 | 6 | 10 | 2 | 10 | ||
| adsorbent (g) (D) | 0.02 | 0.025 | 0.030 | 0.015 | 0.035 | ||
| Time (min) (E) | 3 | 4 | 5 | 2 | 6 |
Central composite design
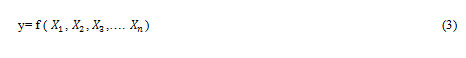
Response Surface Methodology is a statistical method that uses experimental data obtained from specified experimental design to model and optimize any process in which response of interest is influenced by several variables [23, 24]. Primarily, this optimization is done by following three major steps, viz., performing the statistically designed experiments, estimating the coefficients in a mathematical model, and predicting there sponses followed by examining the adequacy of the model[25]. RSM helps to enumerate the relationships between output variables called responses(y) and input variables called factors (xiS) [26].
CCD under RSM is suitable for fitting a quadratic surface to optimize the effective parameters and to investigate the contribution of variables and the interaction with minimum number of experiments [23]. Generally, the CCD consists of factorial runs with 2n axial runs and central runs where n is the number of variables( n=5 in this work)[ 24], while the replication of central point gives a sense on numerical values of experimental errors and the data reproducibility. Thus, conducting 50 experiments permits the researchers for full study of all regions. Each experimental run was analyzed and the response was correlated with five input factors by using the following quadratic polynomial equation: 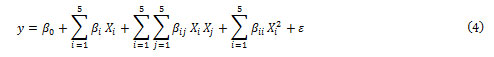
where y is the predicted response (removal percentage); xi
’s are the independent variables ( BB concentration, TB concentration, pH, amount of adsorbent and sonication time) that are known for each experimental run. The parameter β0 is the model constant βi is the linear coefficient;βii are the quadratic coefficients and βij are the cross-product coefficients and ɛ is the residual term. The regression analysis is used to fit the equations for both responses to the experimental data and to estimate the statistical significance of the equation using the Statistical software. Obtain an optimal response. The first or second-order polynomial equations obtained. according to the experimental responses as well as their subsequent fitting and the analysis of variance (ANOVA) help to estimate the main contribution of variables involved and their interaction. The plot of three-dimensional graph leads to the generation of surface response applied for the prediction of best operating conditions according to P-values and F-values. In this work, the dependence of dyes removal percentages as responses on five factors such as the initial BB concentration, initial TB concentration, pH effect, amount of adsorbent and sonication time at five levels (Table2) was analyzed using the STATISTICA 10.0 according to 50 runs. Table 2 shows the experimental design points with variables coded values used in matrix of experiments(−2,−1,0,+1,+2) consisting 2n factorial points with 2n axial points and nc central points.
Desirability function (DF)
Desirability function (DF) creates a function for each individual response (di) leading to final output of global function (D), maximum value of which supports the achievement of optimum value[27]. The principle and application of desirability function for the best predication of real behavior of adsorption system was pointed out previously [28]. The desirability profiles indicate the predicted levels of variables, which produce the most desirable responses.
| Runs | Block | A | B | C | D | E | BB removal (%) | TB removal (%) | ||
| 1 | 1 | 14 | 6 | 4 | 0.03 | 5 | 89.6 | 100 | ||
| 2 | 1 | 6 | 14 | 8 | 0.02 | 3 | 89.49 | 85 | ||
| 3 | 1 | 6 | 6 | 8 | 0.03 | 3 | 93.6 | 90 | ||
| 4 | 1 | 6 | 14 | 8 | 0.02 | 5 | 92.54 | 85.45 | ||
| 5 | 1 | 14 | 6 | 4 | 0.02 | 5 | 86.5 | 97 | ||
| 6 | 1 | 14 | 14 | 8 | 0.02 | 5 | 85.71 | 90.15 | ||
| 7 | 1 | 14 | 14 | 4 | 0.02 | 5 | 92.58 | 95.5 | ||
| 8 | 1 | 14 | 14 | 8 | 0.02 | 3 | 80 | 81.92 | ||
| 9 | 1 | 10 | 10 | 6 | 0.035 | 4 | 96.79 | 98.66 | ||
| 10 | 1 | 6 | 6 | 8 | 0.02 | 5 | 95.87 | 95 | ||
| 11 | 1 | 10 | 10 | 2 | 0.025 | 4 | 90 | 92 | ||
| 12 | 1 | 10 | 10 | 6 | 0.015 | 4 | 85 | 90 | ||
| 13 | 1 | 14 | 6 | 8 | 0.02 | 5 | 72.26 | 95.5 | ||
| 14 | 1 | 14 | 6 | 4 | 0.03 | 3 | 90 | 92 | ||
| 15 | 1 | 10 | 10 | 6 | 0.025 | 4 | 99.65 | 97 | ||
| 16 | 1 | 14 | 14 | 4 | 0.02 | 3 | 88.18 | 89.24 | ||
| 17 | 1 | 14 | 6 | 4 | 0.02 | 3 | 85 | 89 | ||
| 18 | 1 | 6 | 14 | 8 | 0.03 | 5 | 93.48 | 90 | ||
| 19 | 1 | 14 | 6 | 8 | 0.03 | 5 | 80 | 99.8 | ||
| 20 | 1 | 14 | 14 | 4 | 0.03 | 3 | 92 | 91.38 | ||
| 21 | 1 | 6 | 14 | 8 | 0.03 | 3 | 98.5 | 92.8 | ||
| 22 | 1 | 14 | 14 | 4 | 0.03 | 5 | 95.31 | 96 | ||
| 23 | 1 | 10 | 10 | 6 | 0.025 | 4 | 99.8 | 98.7 | ||
| 24 | 1 | 14 | 6 | 8 | 0.03 | 3 | 80.73 | 95.6 | ||
| 25 | 1 | 6 | 6 | 8 | 0.03 | 5 | 97.56 | 97 | ||
| 26 | 1 | 10 | 10 | 10 | 0.025 | 4 | 87 | 85.42 | ||
| 27 | 1 | 10 | 18 | 6 | 0.025 | 4 | 95 | 100 | ||
| 28 | 1 | 10 | 10 | 6 | 0.025 | 4 | 99.5 | 98.18 | ||
| 29 | 1 | 6 | 6 | 4 | 0.03 | 3 | 93.7 | 92.35 | ||
| 30 | 1 | 6 | 6 | 8 | 0.02 | 3 | 88.78 | 90 | ||
| 31 | 1 | 14 | 14 | 8 | 0.03 | 3 | 90.42 | 89.65 | ||
| 32 | 1 | 2 | 10 | 6 | 0.025 | 4 | 100 | 99.62 | ||
| 33 | 1 | 10 | 12 | 6 | 0.025 | 2 | 90 | 90.75 | ||
| 34 | 1 | 14 | 6 | 8 | 0.02 | 3 | 67.99 | 85 | ||
| 35 | 1 | 6 | 14 | 4 | 0.02 | 3 | 90.75 | 93.89 | ||
| 36 | 1 | 6 | 14 | 4 | 0.02 | 5 | 96.6 | 95.43 | ||
| 37 | 1 | 6 | 6 | 4 | 0.02 | 5 | 95.81 | 95.44 | ||
| 38 | 1 | 10 | 10 | 6 | 0.025 | 4 | 98 | 96.43 | ||
| 39 | 1 | 10 | 10 | 6 | 0.025 | 4 | 100 | 99.12 | ||
| 40 | 1 | 6 | 6 | 4 | 0.03 | 5 | 98.51 | 99.36 | ||
| 41 | 1 | 18 | 10 | 6 | 0.025 | 4 | 74.24 | 98.59 | ||
| 42 | 1 | 10 | 10 | 6 | 0.025 | 4 | 100 | 98.11 | ||
| 43 | 1 | 6 | 14 | 4 | 0.03 | 3 | 92.8 | 95.31 | ||
| 44 | 1 | 10 | 10 | 6 | 0.025 | 6 | 100 | 100 | ||
| 45 | 1 | 6 | 6 | 4 | 0.02 | 3 | 90.6 | 94.25 | ||
| 46 | 1 | 6 | 14 | 4 | 0.03 | 5 | 96.8 | 97.08 | ||
| 47 | 1 | 10 | 10 | 6 | 0.025 | 4 | 99.35 | 97.14 | ||
| 48 | 1 | 14 | 14 | 8 | 0.03 | 5 | 95.42 | 98.02 | ||
| 49 | 1 | 10 | 2 | 6 | 0.025 | 4 | 93 | 90 | ||
| 50 | 1 | 10 | 10 | 6 | 0.025 | 4 | 99.6 | 100 | ||
 |
Table 3 Click here to View table |
Results and discussion
Characterization of adsorbent
The particle size and morphology of Mn-Fe2O4 –NPs-AC were evaluated by SEM. Figure 1 shows that the synthesized particles are spherical with the radius of about 75 nm. Figure 2 shows the FT-IR spectrum of the prepared Mn-Fe2O4 –NPs-AC which was recorded within 500–3500 cm-1 . The broad band at 3422 cm-1 is related to the –OH group. The band at about 2917 cm-1 could be assigned to the symmetrical stretching C–H group. The shoulder at wave number around 1640 cm-1 may be due to the C=O stretching. The peak at 1444 and 1231 cm-1 are corresponding to the asymmetric C–H group and the bands at low wave numbers (≤900) are related to vibrations of the Fe–O and Mn–O bonds in manganese ferrite. These functional groups may act as anchoring sites for dye molecules as reported in the literature [29]. The X-ray diffraction (XRD) pattern of Mn-Fe2O4 –NPs-AC nanoparticles is shown in Figure 3 Seven characteristic peaks for Mn-Fe2O4 –NPs-AC (2θ =18.25°, 29.27°, 35.0°, 44.15, 53.2°, 56.69° and 62.26°) corresponding to indices (111), (220), (311), (400), (422), (511) and (440) , respectively. These patterns confirm the formation of cubic spinel type lattice of Mn-Fe2O4 –NPs-AC nanoparticles. The observed strong XRD peaks (Fig.3), indicate the well-crystalized structure of the prepared Mn-Fe2O4-NPs-AC while no characteristic peaks correspond to impurities such as Fe, Fe(OH)2 and Fe(OH)3 and/or other compounds, were detected.
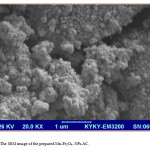 |
Figure 1: The SEM image of the prepared Mn-Fe2O4– NPs-AC. Click here to View figure |
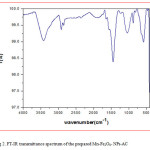 |
Figure 2: FT-IR transmittance spectrum of the prepared Mn-Fe2O4– NPs-AC Click here to View figure |
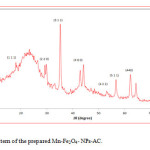 |
Figure 3: XRD pattern of the prepared Mn-Fe2O4– NPs-AC. Click here to View figure |
Analysis of central composite design
As it is seen from CCD(Table2), the effects of five dependent variables BB concentration (A), TB concentration (B), PH (C), amount of adsorbent (D) and time of sonication (E) were investigated. 50 experiments and their corresponding responses are presented in Table 2. Analysis of variance (ANOVA) was performed for the removal percentage of each dye by using STATISTICA 10.0 (Table 2). The quality of the polynomial model equation was judged statistically by the coefficient of determination R2 and its statistical significance was determined by F-test. P-values less than 0.05 are generally considered as a criterion for distinguishing statistically significant variables. However, Bonferroni test was applied to reduce alpha value to 0.01 which results in reducing the number of significant variables. As mentioned above, a P-value less than 0.01 (Bonferroni adjusted) indicates the statistical significance of each factor at 95% confidence level. Thus, the following predictive models describing the removal percentages of BB and TB dyes were obtained in terms of significant variables which satisfy the Bonferroni limit.
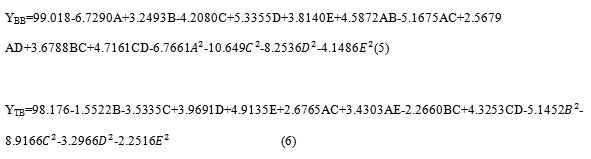
The plot of experimental R% values versus predicted ones indicated a good fit for both BB and TB (Fig.4). From ANOVA for the R% BB and R% TB , the P-values for the lack of fits corresponding to BB and TB were obtained to be 0.11 and 0.30, respectively which prove the applicability of the predictive models. For both models, the and adjusted were close to 1 confirming the goodness of the fit. From Eq. (5), it is seen that the pH and its interaction with both BB and TB concentrations are significant which negatively affect R% BB. Another significant variable that positively affects R%BB is amount of adsorbent. The trend in Eq. (6) corresponding to R%TB is fairly similar to that of BB. However, TB concentration significantly affects the R%TB negatively in linear and quadratic ways. Furthermore, the interaction of the pH with amount of adsorbent played significant role in R% BB and R% TB.
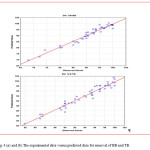 |
Figure 4: (a) and (b) The experimental data versus predicted data for removal of BB and TB. Click here to View figure |
Response surface plots
The 3D RSM surfaces corresponding to R%BB and R%TB were depicted and considered to optimize the significant factors and to give useful information about the possible interaction of variables. As also seen from Eqs.(5) and (6), the effects of significant interaction terms on the curvature of the surfaces are observed as expected (Fig.5 and Fig.6). The maximum adsorption of BB and TB in high sonication time confirms high contribution of ultrasound in mass transfer supporting its requirement for obtaining maximum removal percentage. As seen from the results, the initial adsorption rate of adsorbent is accelerated due to high available surface area and vacant sites. The RSM plots (Fig. 5a–c and Fig.6 a-c) presents the interaction of pH with initial BB concentration, initial TB concentration and adsorbent dosage respectively. The pH has negative correlation with removal percentage and at higher pH led to achievement of lower removal percentage. At low initial pH, protonation of the adsorbent functional groups led to generation of positive charge and appearance of the strong attractive forces between the cationic dye molecule and adsorbent surface (increase in removal percentage). (Fig. 5d) show the interaction of adsorbent dosage with initial dye concentration and their relation with removal percentage. It was seen that the removal percentage of each dye decreases at higher initial dye concentration. (Fig.5e) that the removal percentage changes versus the adsorbent dosage. The positive increase in the dye removal percentage with increase in adsorbent mass is seen. Significant diminish in removal percentage at lower amount of Mn-Fe2O4 -NPs-AC is attribute to higher ratio of dye molecules to the vacant sites of the adsorbent. Fig. (6d) sonication time it can be concluded that maximum adsorption of TB could be achieved when the sonication time was increased.
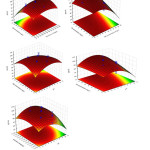 |
Figure 5: Response surfaces for the dyes removal: (a) initial BB concentration–adsorbent dosage (b) initial TB concentration– initial BB concentration; (c) ) initial BB concentration– pH ,(d ) initial TB concentration– pH, (e) pH- adsorbent dosage Click here to View figure |
Optimization of CCD by DF for extraction procedure
The profile for desirable option with predicted values in the STATISTICA 10.0 software was used for the optimization of the process (Fig.7). The desirability in the range of 0.0 (undesirable) to 1.0 (very desirable) was used to obtain a global function (D) that is the base of optimization. The CCD design matrix results were obtained as maximum (100 % and 100%) and minimum (67.99% and 67.99%) for BB and TB, respectively. According to these values, DF settings for either of dependent variables of removal percentages were depicted on the right hand side of Fig.7. Desirability of 1.0 was assigned for maximum removal (100% and 100%), 0.0 for minimum (67.99% and 67.99%) and 0.5 for middle (83.995 and 83.995 %) for BB and TB, respectively. The individual desirability scores are illustrated on the left hand side of Fig.7 (bottom). The overall response obtained from these plots was depicted at the top (left) of Fig.7. Based on these calculations and desirability score of 1.0, maximum recoveries (100 % and 100%) for BB and TB, respectively were obtained at optimum conditions as: 5 min for sonication time, 0.03g for adsorbent mass, 12 mg/L for BB and 12 mg/L for TB at pH 6. Five solutions with different amounts of ideal conditions were used to predict the optimum conditions for BB and TB dyes adsorption on to Mn-Fe2O4– NPs-AC. The validity of the predicated responses at the optimized conditions was checked by performing duplicate experiments at similar conditions with RSD lower than 2% and removal percentage more than 98.5% in good agreement with the predicted value. This strong agreement proves that the predictive model found based on RSM is well applicable for describing the removal percentages of dyes studied against the variables involved.
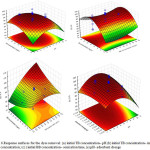 |
Figure 6: Response surfaces for the dyes removal: (a) initial TB concentration– pH (b) initial TB concentration– initial BB concentration; (c) ) initial BB concentration– sonication time, (e) pH- adsorbent dosage Click here to View figure |
Adsorption equilibrium study
Adsorption equilibrium isotherm is designed based on mathematical relation of the amount of adsorbed target per gram of adsorbent ( (mg/g)) to the equilibrium non-adsorbed amount of dye in solution (Ce (mg/L) at fixed temperature [30, 31]. Isotherm studies are divided to well-known models such as Langmuir, Freundlich, Temkin and Dubinin–Radushkevich based on well-known conditions. The Langmuir model is the most frequently employed model given by following equation [32]: 
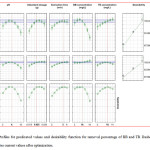 |
Figure 7: Profiles for predicated values and desirability function for removal percentage of BB and TB. Dashed line indicates current values after optimization. Click here to View figure |
Where Ce, Qm and KL are the concentration of adsorbate at equilibrium (mg/L), maximum monolayer adsorption capacity(mg/g) and Langmuir constant(L/mg), respectively Ce/qe. was plotted against Ce where parameters such as Qm, KL, and R2 were calculated based on the slope and intercept of such lines and displayed in Table4. The values of Ka (the Langmuir adsorption constant (L/mg)) and Qm (theoretical maximum adsorption capacity (mg/g)) were obtained from the intercept and slope of the plot of versus Ce, respectively. The applicability of Langmuir model for the interpretation of the experimental data over the whole concentration range is proven from high correlation coefficient at all adsorbent masses. The increase in the amount of adsorbent leads to significant enhancement in the actual amount of adsorbed dye. The parameters of Freundlich isotherm model such as KF and the capacity of the adsorption were calculated from the intercept and slope of the linear plot Ce/qe of ln versus Ce ln , respectively. The heat of the adsorption and the adsorbent–adsorbate interaction were evaluated by using Temkin isotherm model. In this model, B is the Temkin constan t related to heat of the adsorption (J/mol), T is the absolute temperature(K), R is the universal gas constant(8.314J/mol. K) and K is the equilibrium binding constant(L/mg). D–R model was applied to estimate the porosity apparent free energy and the characteristic of adsorption [33,34]. In this model B(mol2/k ) is a constant related to the adsorption energy, Qs(mg/g) is the theoretical saturation capacity and E is the Polanyi potential. The slope of the plot of ln versus ɛ2 gives B and its intercept yields the value. The linear fit between the plot of Ce/qe versus and calculated correlation coefficient (R2) for Langmuir isotherm model shows that the dye removal isotherm can be better represented by Langmuir model (Table4). This confirms that the adsorption of dyes takes place at specific homogeneous sites as a monolayer on to the Mn-Fe2O4– NPs-AC surface.
Table 4: Various isotherm constants and their correlation coefficients calculated for the adsorption of BB and TB on to Mn-Fe2O4-NPs-AC.
|
Isotherm |
Equation | parameters | Value of parametersfor BB |
Value of parameters for TB |
| Langmuir | = bCe/(1+bCe) | Qm(mg g-1) | 70.3 | 48.48 |
| Ka (L mg-1) | 10.49 | 1.344 | ||
| R2 | 0.99 | 0.97 | ||
| Freundlich | ln = ln KF + (1/n) lnCe | 1/n | 3.81 | 3.96 |
| KF (L mg-1) | 9.44 | 4.67 | ||
| R2 | 96 | 0.93 | ||
| Tempkin | qe = B1ln KT + B1lnCe | B1 | 15.55 | 10.63 |
| KT (L mg-1) | 106.75 | 9.3 | ||
| R2 | 0.98 | 0.94 | ||
| Dubinin-Radushkevich (DR) | lnqe = ln Qs –Bε2 | Qs (mg g-1) | 60.35 | 29.135 |
| B | 6E-07 | 5E-07 | ||
| E (kj mol-1) | 8535.53 | 3354.1 | ||
| R2 | 0.97 | 0.93 |
Kinetic study
Adsorption of a solute by a solid in aqueous solution through complex stages [35] is strongly influenced by several parameters related to the state of the solid (generally with very heterogeneous reactive surface) and to physico- chemical conditions under which the adsorption occurred. The rate of dyes adsorption onto adsorbent was fitted to traditional models like, pseudo-first, second-order, intraparticle and Elovich models. The Lagergren pseudo-first order modeled scribed the adsorption kinetic data [36]. The Lagergren is commonly expressed as follows:
![]()
Where qe an dqt (mg/g) are the adsorption capacities at equilibrium and at time t, respectively. k1 is the rate constant of the pseudo-first-order adsorption(L/min). The log(qe−qt) versus t was plotted and the values of and were determined by using the slope and intercept of the line, respectively. ![]()
The fact that the intercept is not equal to qe imply that there action is unlikely to follow the first-order [37]. The relationship between initial solute concentration and rate of adsorption is linear when pore diffusion limits the adsorption process. Therefore, it is necessary to fit experimental data to another model (Table5) such as pseudo-second order model [38], based on the following equation:
![]()
![]()
Eq.(18) is integrated over the interval 0 to t for t and 0 to for qt to give As mentioned above, the plot of log( qe−qt ) versus t does not show good results for entire sorption period, while the plot of versus t shows a straight line. The values of k2 and equilibrium adsorption capacity (qe ) were calculated from the intercept and slope of the plot of t/q versus t (Table5). The calculated qe values at different working conditions like various initial dyes concentrations and/or adsorbent masses were close to the experimental data and higher R2 values corresponding to this model confirm its more suitability for the explanation of experimental data. This indicates that the pseudo-second-order kinetic model applies better for the adsorption of BB and TB system for the entire sorption
![]()
period the intraparticle diffusion equation is given as [39]: Where kdif is the intraparticle diffusion rate constant (mg/(g. min1/2)) and C shows the boundary layer thickness. The linear form of Elovich model is generally expressed as [40]:
![]()
The kinetic data from pseudo-first and pseudo-second-order adsorption kinetic models as well as the intraparticle diffusion and Elovich model are given in Table5. The linear plots of t/qt versus t indicated a good agreement between the experimental and calculated qe values for different initial dyes concentrations. Furthermore, the correlation coefficients of the pseudo-second-order kinetic model ( R2= 0.99, R2= 0.99 ) were greater than that of the pseudo-first-order model( R2= 0.950, R2=0.950). As a result, the adsorption fits to the pseudo-second-order better than the pseudo-first-order kinetic model.
Thermodynamic studies
The thermodynamic parameters, the values of enthalpy (ΔH0), and entropy (ΔS0), and Gibbs free energy (ΔG0), of the sorption are useful in defining whether the sorption reaction is endothermic or exothermic, and spontaneity of the adsorption process [40]. The adsorption standard free energy changes (ΔG0) can be calculated according to:
![]()
where R (8.314 Jmol−1 K−1) is the ideal gas constant, and T (K) is the temperature. The negative ΔG0 values at different temperatures were due to the fact that the adsorption process is spontaneous. The value of ΔG0 decreased with an increase in temperature, indicated that the spontaneous nature of the adsorption of BB and TB dyes is inversely proportional to the temperature. The values of other parameters such as enthalpy change and entropy change may be determined from Van’t Hoff equation:
![]()
The Thermodynamic parameters are listed in table 6. A positive standard enthalpy change suggests that the interaction of BB and TB by Mn-Fe2O4– NPs-AC is endothothermic,which supported by the incresing feasibility adsotption BB and TB with the increase in temperature towards Mn-Fe2O4– NPs-AC.
Table 5: Various Kinetic constants and their correlation coefficients calculated for the adsorption of BB and TB onto Mn-Fe2O4-NPs-AC.
| Model | parameters | Value of parametersfor BB | Value of parametersfor TB |
| pseudo-First-orderkinetic | k1(min-1) | 1.43 | 0.987 |
| (calc) (mg g-1) | 10.155 | 17.92 | |
| R2 | 0.95 | 0.95 | |
| pseudo-Second-order kinetic | k2 (min-1) | 0.507 | 0.154 |
| qe(calc) (mg g-1) | 53.46 | 56.15 | |
| R2 | 0.999 | 0.999 | |
| Intraparticlediffusion | Kdiff (mg g-1 min-1/2) | 4.59 | 8.05 |
| C (mg g-1) | 40.71 | 33.77 | |
| R2 | 0.94 | 0.97 | |
| Elovich | β (g mg-1) | 1.379 | 0.609 |
| α (mg g-1 min-1) | 22596 | 17074 | |
| R2 | 0.94 | 0.98 | |
| (exp) (mg g-1) | 51.45 | 52 |
Table 6: Thermodynamic parameters for the adsorption of BB and TB onto Mn-Fe2O4 -NPs-AC
| Parameter | Temperature (K) | BB | TB | |||||||||||||||||||||||
| 288.15 | 308.15 | 318.15 | 328.15 | 338.15 | 288.15 | 308.15 | 318.15 | 328.15 | 338.15 | |||||||||||||||||
| ∆Gº | -9257.46 | -10376 | -12082.3 | -13577.7 | -15940.5 | -11697.6 | -13085.1 | -14274.7 | -15833.7 | -20213 | ||||||||||||||||
| Kc | 47.66 | 57.4 | 96.33 | 145 | 291 | 132 | 165.25 | 220.66 | 331.5 | 1329 | ||||||||||||||||
| ∆Hº kj mol-1 | 29.238 | 32.488 | ||||||||||||||||||||||||
| ∆Sº j mol-1 k-1 | 131.4859 | 150.55 | ||||||||||||||||||||||||
Comparison of various adsorbent
The performance of the proposed method has been compared with other adsorbents (Table7). The adsorption capacity and contact time for our work are superior to other adsorbents to remove BB[41-44]. The results indicated that the ultrasound-assisted removal method has are mark able ability to improve the efficiency of dyes removal. The ultrasonic-assisted enhancement of dye removal could be attributed to the high-pressure shock wave sand high speed microjets during the violent collapse of cavitation bubbles [45,46].
Table 7: Comparison for the removal of BB by different methods and adsorbents.
| Adsorbent | Contact time(min) | Sorption capacity (mg g-1) | References |
| Magnetically modified spent coffee grounds | 90 | 69.2 | [42] |
| Magnetic fluid modified peanut husks | 90 | 95.3 | [43] |
| Modified Form Iron OxideNanosphere | 1440 | 54.9 | [44] |
| Iron OxideNanosphere | 1440 | 33.8 | [44] |
| Mn-Fe2O4– NPs-AC | 5 | 70.3 | This work |
Conclusion It is observed from the present study that the manganese ferrite nanoparticles loaded on activated carbon under the sonication is an efficient, fast and sensitive adsorption method for the removal of BB and TB. The influences of experimental parameters on the dyes removal percentages were investigated by experimental design methodology (RSM). The adsorption characteristic was examined with the variations of pH, sonication time, Mn-Fe2O4– NPs-AC dosage, initial BB concentration and initial TB concentration. The removal of BB and TB from aqueous solutions in short time (5 min) is feasible with high removal percentage at optimum pH(6) which is neutral and is an advantage for the adsorption process. The equilibrium data were best described by the Langmuir model. The process kinetics can be success fully fitted with pseudo-second order model Thermodynamic constants were evaluated using equilibrium constants changing with temperature. The negative values of ΔG0 indicate the spontaneity and positive values of ΔH0 showed the endothermic nature of BB and TB sorption. The data and methodology presented in this paper might be useful for designing the adsorbent for the treatment of actual effluent. Furthermore, the results of this study encourage the researches and industries to use ultrasound devices for more efficient dye adsorption. The optimized method was successfully applied to real wastewater samples.
Acknowledgement
The author expresses their appreciation to the Science and Research Branch Islamic Azad University, Tehran, Iran for financial support of this work.
Reference
- Robinson, T., McMullan, G., Marchant, R., and Nigam, P. (2001) Bioresour. Technol., 77: 247–255.
CrossRef - Slokar, Y.M. and Le Marechal, A.M. (1998) Dyes Pigment, 37: 335–356.
CrossRef - Hao, J.O., Kim, H., and Chiang, P.C. (2000) Crit. Rev. Environ. Sci Technol., 30: 449–505.
CrossRef - Purkait, M.K., Das Gupta, S., and De, S. (2006) J. Hazard. Mater., 136: 972–977.
CrossRef - Purkait, M.K., Das Gupta, S., and De, S. (2004) Sep. Purif. Technol., 37: 81–92.
CrossRef - Hejazifar, M. andAzizian, S. (2012) J. Dispersion Sci. Technol., 33: 846–853.
CrossRef - Azizian, S., Haerifar, M., and Bashiri, H. (2009) Chem. Eng. J., 146: 36–41.
CrossRef - Yahyaei, B. and Azizian, S. (2012) Chem. Eng. J., 209: 589–596.
CrossRef - R.D.Lillie Ed.Conns Biological Stains 9th ed., Baltimore, MD, (1977), 145
- F. HUSSEIN, A. ALKHATEEB, and J. K. ISMAIL, CODEN ECJHAO E-Journal of Chemistry, Vol. 5, No. 2, pp ,(2008), 243-250
- S. Chikazumi, S. Taketomi, M. Ukita, M. Mizukami, H. Miyajima, M. Setogawa, Y. Kurihara, J. Magn. Magn. Mater. 65 (1987) 245.
CrossRef - A. H. Lu, W. Schmidt, N. Matoussevitch, H. Bpnnermann, B. Spliethoff, B. Tesche, E. Bill, W. Kiefer, F. SchVth, Angew. Chem. 116 (2004) 4403.
CrossRef - S. C. Tsang, V. Caps, I. Paraskevas, D. Chadwick, D. Thompsett. Angew. Chem. 116 (2004) 5763.
CrossRef - A. K. Gupta, M. Gupta, Biomaterials 26 (2005) 3995.
CrossRef - S. Mornet, S. Vasseur, F. Grasset, P. Verveka, G. Goglio, A. Demourgues, J. Portier, E. Pollert, E. Duguet, Prog. Solid State Chem. 34 (2006) 237.
CrossRef - Z. Li, L. Wei, M. Y. Gao, H. Lei, Adv. Mater. 17 (2005) 1001.
CrossRef - T. Hyeon, Chem. Commun. (2003) 927.
CrossRef - D. W. Elliott, W. X. Zhang, Environ. Sci. Technol. 35 (2001) 4922.
CrossRef - M. Takafuji, S. Ide, H. Ihara, Z. Xu, Chem. Mater. 16 (2004) 1977.
CrossRef - S. Shahrokhian, S. Rastgar, M. K. Amini, M. Adeli, Biochem, 86 (2012) 78.
- Elibol M. Process Biochem 2002;38:667–73.
CrossRef - Pavlovic MD, BunticAV, MihajlovskiKR,Siler- J Taiwan Inst Chem Eng 2014;45:1691–9.
- HajatiS,GhaediM,YaghoubiS.Local,cheepandnontoxicactivatedcarbonasefficientadsorbentforthesimultaneousremovalofcadmiumionsandmalachitegreen:Optimization by surface response methodology. J Ind Eng Chem 2015;21:760–7.
CrossRef - HameedB, TanI,AhmadA. Optimization of basic dye removal by oil palm fibre-based activated carbon using response surface methodology.JHazard Mater 2008;158:324–32.
CrossRef - SahuJ,AcharyaJ,MeikapB. Response surface modeling and optimization of chromium(VI)removal from aqueous solution using Tamar ind wood activated carbon in batch process. J Hazard Mater 2009;172:818–25.
CrossRef - Myers RH,Montgomery DC,Anderson CookCM.Response surface methodology: process and product optimization using designed experiments. John Wiley & Sons;2009.
- Malenovi´cA,DotsikasY,Maškovi´cM,Janˇci´c-Stojanovi´cB,Ivanovi´cD,MedenicaM.Desirability-based optimization and its sensitivity analysis for the perindopril and its impurities analysis in a micro emulsion L C system. Microchem J2011;99:454–60.
CrossRef - Roosta M, Ghaedi M, Daneshfar A, Darafarin S, Sahraei R, Purkait M. Simulta-neousultrasound-assisted removal of sunset yellow anderythrosine by ZnS:Ninanoparticles loaded on activated carbon: optimization by central composite de-sign.Ultrason Sono chem 2014;21:1441–50.
CrossRef - R. D. Waldron, Phys. Rev. 99 (1955) 1727.
CrossRef - AsfaramA,GhaediM, Agarwal S, TyagiI, Kumar GuptaV. Removal of basic dye Auramine-ObyZnS: Cu nanoparticles loaded on activated carbon: optimization of parameters using response surface methodology with central composite design. RSCAdv2015;5:18438–50.
- HoY-S,Mc Kay G.Thekinetics of sorption of divalent metal ions on to sphagnum moss peat. Water Res2000;34:735–42.
CrossRef - LangmuirI.The constitution and fundamental properties of solids and liquids. PartI. Solids.JAmChemSoc1916;38:2221–95.
CrossRef - RadushkevichL.Potential theory of sorption and structure of carbons.JPhysChem1949;23:1410–20.
- CulzoniMJ,SchenoneAV,LlamasNE,GarridoM,DiNezioMS,FernándezBandBS,etal.Fast chroma to graphic method for the determination of dyes in beverages by using high performance liquid chromatography—diodearray detection data and second order algorithms. JChromatogr A2009;1216:7063–70.
CrossRef - HoY-S.Second-order kinetic model for the sorption of cadmium on to tree fern: a comparison of linear and non-linear methods.Water Res2006;40:119–25.
CrossRef - JuangR,WuF,TsengR.The ability of activated clay for the adsorption of dyes from aqueous solutions. Environ Technol 1997;18:525–31.
CrossRef - RobinsonT, McMullanG, MarchantR, NigamP. Remediation of dyes intextile effluent: acritical review on current treatment technologies with a proposed alternative. Bioresour Technol2001;77:247–55.
CrossRef - WoodGO. Review and comparisons of D/Rmodels of equilibrium adsorption of binary mixtures of organic vaporson activated carbons.Carbon2002;40:231–9.
CrossRef - WeberW,MorrisJ. Kinetics of adsorptionon carbon from solution.J Sanit Eng Div Am Soc Civ Eng1963;89:31–60.
- HoY-S,McKayG.Pseudo-second order model for sorption processes.Process Biochem 1999;34:451–65.
CrossRef - C. Namasivayam, R.T. Yamuna, Adsorption of chromium by a low-cost adsorbent: biogas residual slurry, Chemosphere 30 (1995) 561–578.
CrossRef - Ivo Safarik, Katerina Horska, Barbora Svobodova, Mirka Safarikova. (2012). Magnetically modified spent coffee grounds for dyes removal. Eur Food Res Technol., 234, 345-350.
CrossRef - Ivo Safarik, Mirka Safarikova. (2010). Magnetic fluid modified peanut husks as an adsorbent for organic dyes removal. Physics Procedia., 9, 274-278.
CrossRef - Maryam Khosravi, Bahareh Yahyaei, and Saeid Azizian, Adsorption of Bismarck Brown by Iron OxideNanosphere and Its Modified Form, Journal of Dispersion Science and Technology, 35(2014):1135–1142,
CrossRef - ShirsathS, PinjariD, GogateP, SonawaneS, PanditA. Ultrasound assisted syn-thesis of doped TiO2nano-particles: characterization and comparison of effectiveness for photocatalytic oxidation of dyesuffeffluent. Ultra son Sono chem2013;20:277–86.
CrossRef - GogatePR,SutkarVS,PanditAB.Sono chemical reactors: important design and scale upconsiderations with a special emphasis on heterogeneous systems.ChemEngJ2011;166:1066–82.

This work is licensed under a Creative Commons Attribution 4.0 International License.
![]()
A New Edition of Web of Science
Journal Impact Factor
2022: 0.5
Five Year: 0.8
Journal is Indexed in

Cabells Whitelist
![]()


