A critical comparative study of indoor air pollution from household cooking fuels and its effect on health
Basant Shubhankar*, and Balram Ambade
Department of Chemistry, National Institute of Technology, Jamshedpur Jharkhand- 831014, India. Mobile no 8409000048. Corresponding author email: 2013rsch001@nitjsr.ac.in
DOI : http://dx.doi.org/10.13005/ojc/320154
Article Received on :
Article Accepted on :
Article Published : 20 Feb 2016
This paper throws light on household cooking related exposures and level of indoor air pollutants (particulate matter and gaseous pollutants CO, CO2, SO2, NO, NO2) in different exposure area from the different types of cooking fuels used. Still the prevalence of biomass fuels exists in Indian households, combustion of which releases higher levels of solid and gaseous pollutants during the cooking hours. The indoor air pollutants (SPM, CO, CO2, SO2, NO, NO2) were measured with handy samplers with different types of cooking fuels (biomass and LPG). For this purpose 50 randomly selected sampled of the indoor air quality were monitored. The results suggests that average concentration of PM10 (394.07 μg/m3) and gaseous pollutants (CO-3.15 ppm, CO2- 492.63 ppm, SO2-0.56 ppm, NO-0.58 ppm, NO2-0.52 ppm) were highest during cooking hours with biofuels cooking places. Thus, not only the women who are involved in cooking suffer from the various ill effects, but also other family members who are inside the house during cooking hours also face exposures. The recorded SPM (114.73 μg/m3 for PM10) and gaseous pollutants (CO-1.34 ppm, CO2-379.83 ppm, SO2-0.52 ppm, NO-0.54 ppm, NO2-0.52 ppm) in LPG using households were lower as compared to biomass fuel using households. Due to the LPG efficiency the time involved in cooking is also low leading to less exposure to the pollutants released.
KEYWORDS:PM10. SPM. Biomass. LPG. Gaseous pollutant. Household cooking fuel Health
Download this article as:| Copy the following to cite this article: Shubhankar B, Ambade B. A critical comparative study of indoor air pollution from household cooking fuels and its effect on health. Orient J Chem 2016;32(1). |
| Copy the following to cite this URL: Shubhankar B, Ambade B. A critical comparative study of indoor air pollution from household cooking fuels and its effect on health. Orient J Chem 2016;32(1). Available from: http://www.orientjchem.org/?p=14090 |
Introduction
Atmospheric pollution is related with contagion of air or imbalance in the composition of air, while ‘indoor air pollution can be demarcated as the sum of attributes of indoor atmosphere that affects a person’s health and well-being’. In most of the developed country the important pollutants are volatile organic compounds, radon, heavy metals, asbestos, mites, pesticides, animal dander, moulds and tobacco smoke. However, as we focus on the developing countries, we will be finding that the most important indoor pollutants are the burning products of unrefined solid biomass fuelswhich is being regularly being used by the poor urban and rural folk people for heating and cooking. One of the major causes of the indoor air pollution is burning of cooking fuel (such as LPG, animal dung, wood, kerosene, agricultural residues, coal, etc.) [1]. Even today one half of the world’s population, 95 percent in poor countries and more than 90 percent households of India are still using the tradional way of fuel and as well as conventional fuels though including biomass fuels [2]. Biomass fuel, refers to a vegetation or animal based material deliberately burned by humans and wood is the most common biofuel, but use of dung and harvest residues is also used frequently [3].
It has been estimated that 50 times more noxious pollutants is released by unprocessed solid fuels than gas [4]. The efficiency Traditional fuels are characterized by low combustion efficiency that lead to huge emission of suspended particles and poisonous gases. The stoves or chulhas (u shaped open stoves made of bricks and mud) used for cooking purpose are not energy efficient in which the fuels are not completely burned. The incomplete combustion of fuels releases many a dozon of complex toxic pollutants hazardous to health. Among these health damaging pollutants, toxic and irritant gases, the most important include PM, CO, NO2, SO2, HCHO and carcinogens for example benzo (0) pyrene and benzene [5]. The exposure to indoor smoke is particularly high among women and children because women spend responsible for family cooking and children below the age of five there most of the time with their mothers while they are engaged in cooking [6]. Women generally begin regular cooking or start assisting in cooking around the age of 12 to 15 which leads to longer period of exposure to pollutants. Women spend between 3 to 7 hours per day near the stove for cooking food [7]. Due to customary involvement in the cooking women’s exposure is very much higher than men’s and many times the young ones are carried on mother’s backs or on laps while cooking and thus they spend many hours breathing toxic pollutants.
Indoor Air Quality (IAQ) is one of the complex issues than any of the other environmental issues. Researchers indicate the presence of more than 900 contaminants in indoor air depending on different operational activities. The most important identified indoor air pollutants are polycyclic aromatic hydrocarbons (PAH), sulphur dioxide (SO2), carbon monoxide (CO), carbon dioxide (CO2), oxides of nitrogen (NO, NO2), particulate matter etc [8]. The sources of these pollutants are innumerable, such as, building materials used, carpets, furniture, smoking indoors, cooking fuels used, heating, cleaning etc., but the most important identified source by WHO is cooking with solid fuels.
Despite adverse health effects of indoor air pollution, this complex problem is not highlighted and discussed. Most sources of air pollutants normally monitored outdoors as according to the National Air Quality standard and very little is known about air pollution indoors [9]. Moreover, from combustion of traditional fuels the toxic pollutants released has been implicated and are risk for most respiratory diseases (such as tuberculosis, asthma, acute respiratory infections, chronic obstructive pulmonary diseases, etc.), cancers, adverse pregnancy outcomes, eye problems, accidental problems, etc., particularly among women who are usually regarded as responsible for household work management and cooking in Indian cultural values.
Objectives
- Monitoring of indoor air pollutants (PM10 ) and gaseous (CO, CO2, SO2, NO, NO2)
- Identifying risk factors associated with indoor air pollution
- Identifying vulnerable women/households and the vulnerable areas of Jamshedpur City for future planning.
- Type of household energy used
Experimental
Study area
Tata Nagar is 86º04′ to 86º54′ east Longitude and 22º12′ to 23º01′ North latitude. It has an average elevation of 40 meters (131 feet). The city is situated 1400 km from New Delhi and a little less than 300 km north-west of Kolkata on the (NH-33) and Eastern Railway. The chief rivers are the swarnrekha and Kharkai. Tata Nagar is located in the south east region of Jharkhand. The city is located in the Chhota Nagpur plateau and covers an area of 3533 km2. Sampling site is close to state highway Jamshedpur Kandra road, Godowns of Food Corporation of India, hotels, bakeries and Adityapur railway station also exist in the vicinity of the sampling area. Tata Nagar one of the major industrial centres also known as steel gaint producer of Eastern India. It houses companies like Tata Steel, TCE, Lafarge, Tata Motors, BOC Gases, Tata Power, Cement, Telcon, Praxair, TCS, Timken, TRF, Tinplate and many more. It homes to one of the largest industrial zones of India known as Adityapur which houses more than 1,200 small and medium scale industries and has an SEZ named AIDA in the Adityapur. The details of sampling sites for the collection of PM10 are shown in fig 1
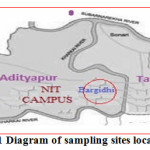 |
Figure 1: Diagram of sampling sites location |
For indoor PM10
Monitoring was carried out chulla at open space, with different usages of cooking fuel to diagnose the indoor air quality (IAQ) and to find out the concentration of suspended PM10. This monitoring was carried out with the help of the handy sampler in the month of May, 2015. For the purpose of sampling, households kitchen using biomass fuels and LPG in chulhas were selected in open space. The pollutant monitoring of SPM was performed 1/2 hour before cooking and two and half hour during cooking. The concentration of suspended particulate matter was averaged over and was recorded at 5 minute intervals. For the purpose of monitoring of released and suspended PM10, a portable sampler “GRIMM Dust Monitor Series 1.109” (Grimm Aerosol technic; Doff strabe 9; 83404 Airing Germany) was used. The operational characteristics of GRIMM is shown in table 1
Table 1: Operational characteristics of portable GRIMM dust monitor
|
Measuring principle |
900 light scattering |
|
Reproducibility |
±2% over the whole measuring range |
|
Self-test |
Automatically after every start |
|
Sample flow rate |
1.2 l/min ±5% constant with controller |
|
Sample air filter |
47 mm PTFE- round filter |
|
Dimension |
24x12x6 (cm) |
|
Mass |
Mass concentration with 31 size channels from 0.25->32 μm in μg/m2 |
|
Particle |
Particle concentration in 31 measuring channels applied to the volume of one litre sample air |
For gaseous pollutants
Monitoring was carried out to measure the concentration of indoor gaseous pollutants with special emphasis on the measurement of emissions from the energy used for cooking. The levels of concentration of CO2, CO, SO2, oxides of NO & NO2 were monitored. This monitoring was carried out with the help of the handy sampler in summer May, 2015. The levels of pollutants released through the combustion of different fuels were assessed from 6.30 am to 6.30 pm for the houses using biomass fuels/chulla & LPG/gas stoves. For the monitoring of indoor gaseous pollutants (CO2, CO, SO2, NO, NO2), handy samplers were used having separate sensors for sensing the concentration of each type of pollutant. The indoor gaseous pollutants like CO, SO2, NO, NO2 were measured by portable YES-205 multigas monitor (Young Environmental System 205 Inc. Vantage way, Delta, Canada). The concentration of CO2 was measured by a portable YES-206 Falcon Indoor Air Quality monitor (Young Environmental System 206 Inc. Douglas St. Richmon, V6X1V2, Canada). The self-test time for data was set in the interval of 5 minutes each but averaged hourly; data were calculated for whole day working hour in kitchen with different fuel use. The detail of the operational characteristics of YES-205 and YES-206 is given in table 2 and 3.
Table 2: YES – 205 analyzer operational characteristics
|
Sensors |
CO |
NO |
NO2 |
SO2 |
|
Sensor type used |
Electrochemical |
Electrochemical |
Electrochemical |
Electrochemical |
|
Range |
0-50 ppm |
0-50 ppm |
0-50 ppm |
0-50 ppm |
|
Resolution |
0.3 ppm |
0.1 ppm |
0.05 ppm |
0.1 ppm |
|
Response |
5min operational |
5min operational |
5min operational |
5min operational |
|
Recommended Caliberation interval |
6 months for getting best accuracy |
6 months for getting best accuracy |
6 months for getting best accuracy |
6 months for getting best accuracy |
Table 3: YES – 206 analyzer operational characteristics
|
Sensor type |
NDIR |
|
Range |
0 – 9,999 |
|
Sensitivity |
+/- 1 ppm |
|
Accuracy |
+/- 50 ppm or +/- 5% of reading |
|
Response time |
< 60 seconds for 90% of step change |
|
Warm up time |
< 60 seconds at 22ºC |
|
Operating conditions |
0 – 50ºC |
|
Calibration interval |
12 months |
Results and discussion
The United States Environmental Protection Agency 2006,[10] (EPA) standard for an acceptable annual 24-hour average of PM10 is 150 μg/m3, and they state that this level of pollutants should not be exceeded more than once per year.
PM10 pollutant
Biomass as cooking fuel
Fig 2 shows the average daily PM10 concentration of 248.97 g/m3 of which the peak value recorded was 384.30 μg/m3 while the minimum was 123.30 μg/m3 around cooking, place in the open just before cooking hour. The outdoor cooking with biomass cooking fuel exhibited much higher concentration of PM10 and the average daily concentration was found to be 430.37 μg/m3 of which the highest value recorded was 685.30 μg/m3 while the minimum concentration recorded was 264.10. μg/m3. The level of concentration of PM was found much higher in open space, it was attributed to outdoor atmospheric effect and as the exposed area is large, the PM gets diffused in the atmosphere and cause health hazard.
LPG as cooking fuel
Fig 2 shows the average daily concentration of 93.70 μg/m3 in open space, of which the maximum recorded concentration was 112.10 μg/m3 while the minimum recorded concentration was 79.50 μg/m3 just before the cooking hours. The cooking hour average concentration of PM10 recorded was 119.99 μg/m3 of which the maximum recorded value was 248.10 μg/m3 while the minimum recorded value was 64.80 μg/m3. It was observed that the concentration of PM10 was much higher during cooking hours compared to the concentration level before cooking hour.
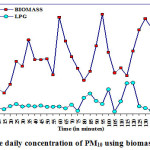 |
Figure 2: Average daily concentration of PM10 using biomass and LPG fuel |
Gaseous pollutants
Biomass as cooking fuel
Fig. 3(a, b, c, d & e) is showing the concentration of gaseous pollutants (CO, CO2, SO2, NO, NO2) around cooking place during the working hours (including cooking hours) in the month of May (summer days). The average daily concentrations of CO, CO2, SO2, NO, NO2 were recorded to be 3.15 ppm, 492.63 ppm, 0.56 ppm, 0.58 ppm, 0.52 ppm respectively of these recorded values of the whole day working hours, the maximum recorded values were, 7.80 ppm, 676.50 ppm, 0.65 ppm, 0.66 ppm, 0.56 ppm respectively and the minimum recorded values were, 0.71 ppm, 289.50 ppm, 0.51 ppm, 0.51 ppm, 0.51 ppm of CO, CO2, SO2, NO, NO2 respectively. The higher values of gaseous pollutants during the whole day recorded concentration were observed in morning, day time and in the evening i.e. all the highest values were recorded during the cooking hours while in non-cooking hours the lower concentration of gaseous pollutants were recorded. The highest concentrations were observed at the time of ignition of fire in chulhas when the fire in chulhas was blown with mouth or blow pipe for more heat. At this time the concentration of gaseous pollutants was higher due to emitted smoke and when the smoke dissipated the concentration of all these pollutants declined.
LPG as cooking fuel
Fig 3(a, b, c, d & e) is showing the concentration of common gaseous pollutants (CO, CO2, SO2, NO, NO2) in the kitchen during the working hours (including cooking hours) inside the house. The average daily concentrations of CO, CO2, SO2, NO, NO2 were recorded to be 1.34 ppm, 379.83 ppm, 0.52 ppm, 0.54 ppm and 0.52 ppm respectively. During the monitoring hours, the maximum recorded concentrations of gaseous pollutants were, 1.70 ppm, 556.00 ppm, 0.06 ppm, 0.07 ppm, 0.04 ppm and the minimum recorded values were, 0.20 ppm, 234.00 ppm, 0.00 ppm, 0.01 ppm, 0.00 ppm of CO, CO2, SO2, NO, NO2 respectively. The highest concentrations were during the whole day monitoring were observed in morning, day time and in the evening i.e., during the cooking hours while in non-cooking hours the lower concentration of pollutant were recorded.
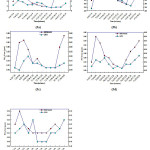 |
Figure 3: (a, b, c, d & e) Average daily concentration of CO, CO2, SO2, NO & NO2 using BIOMASS & LPG fuel respectively. Click here to View figure |
Linkages of respiratory disease symptoms with fuel use
The linkages between self-reported respiratory disease symptoms includes cough, phlegm, breathlessness, wheezing, blood in sputum and any other symptoms like fever, sore throat, running nose etc. On the basis of self-reported symptoms the occurrence of respiratory diseases was examined in the households using different type of fuels (BIOMASS & LPG) is in Table 4.
Table 4: Linkages of respiratory disease symptoms and fuel use, (in percentages) in the sampled households
|
Biomass and LPG fuel |
||||||||
|
Type of fuel used |
No. of households |
Cough |
Phlegm |
Breathlessness |
Wheezing
|
Blood in sputum |
Eye irritation |
Any respirstory symptoms |
|
Biomass |
50 |
14.59 |
9.45 |
11.60 |
12.25 |
5.52 |
5.04 |
18.15 |
|
LPG |
50 |
4.23 |
3.32 |
4.00 |
4.34 |
1.67 |
3.88 |
9.69 |
Table 5: Air quality guidelines for Particulate pollution by WHO guideline (2005)
| Air QualityIndex (μg/m3) |
Air Quality |
Health Advisory |
|
0-50 |
Good |
None. |
|
51-100 |
Moderate |
More affected to sensitive people and should consider reducing prolonged or heavy exertion. |
|
101-150 |
Unhealthy for Sensitive Groups |
People suffering with heart or lung disease, older adults as well as young children should reduce prolonged or heavy exertion. |
|
151-200 |
Unhealthy |
People affected with the problem of heart or lung disease, older adults, women should avoid by prolonged or heavy exertion. Anyone in the house else should reduce prolonged or heavy exertion. |
|
201-300 |
Very Unhealthy |
People affected with the problem of heart or lung disease, older adults, women and young children should avoid prolonged or heavy exertion. Anyone in the house else should reduce prolonged or heavy exertion. |
Conclusion
The results suggest that the average concentration of indoor air pollutants was highest during cooking hours with biofuels. The study reveals that the concentration of indoor pollutants, especially PM, CO2, CO, SO2, NO, NO2 is maximum when cooking is done using biomass in chulhas. The exposure to chief cook is very high in when cooking is done using biomass. Another important finding is that the household members who are inside the house during the cooking hours also face the effects of high exposures. This is because most of the households using biomass burn them in open fires/ chulhas that release most of the smoke into the house. The resulting indoor air pollution is a major threat to health, particularly for women and young children who may spend many hours close to the fire. Much higher levels of pollutants are released during cooking hours. As per EPA (environmental protection agencies), the particulate of 10 μm or less than that in size easily passes through the nose, throat and enter the lungs posing health risks. The increase in mortality rate on a global scale from 4.0% to 8.0% of premature deaths are due to exposure to high levels particulate matter in the ambient and indoor environment [11] which is tabled in table 5.
Acknowledgements
The authors express their sincere gratitude to Prof. R. B. Kodali, Director, NIT, Jamshedpur, and Dr S K Prasad, Department of chemistry, NIT Jamshedpur, for constant encouragement and help during the course of the work.
References
- World Bank.; India: Household Energy, Indoor Air Pollution, and Health, 2002, 148-160.
- Census of India, Ministry of Home Affairs, Government of India, New Delhi, 2011.
- De Koning, H.W.; Smith, K.R.; Last, J.M. Biomass Fuel Combustion and Health. Bull. WHO., 1985, 63 (1), 11-26.
- Smith, K.R. Indoor Air Quality and the Population Transition in: Indoor Air Quality, Kasuga, H., (ed.), Springer Verlag, Berlin., 1990, 448.
CrossRef - Ezzati, M.; Saleh, H.; Kammen, D.M. The Contribution of Emission and Spatial Microenvironments to Exposure to Indoor Air Pollution from Biomass Combustion in Kenya. Environ. Health Perspectives., 2000, 108, 833-839.
CrossRef - Smith, K.R.; Mehta, S.; Feuz, M. Indoor air pollution from household use of solid fuels , In: Ezzati M., Lopez A., Roders A. et al. Comparative quantification of health risks, global and regional burden of disease attributable to selected major risk factors. Geneva, World Health Organization, 2004, 1435-1494.
- Singh, A.L.; Parveen, U. Fuel choice, Indoor Air Pollution and Women’s Health: A household level Perspective, in A.L.Singh (ed). Environment and Health, B.R. Publishers, New Delhi., 2010, 1-34.
- Sharma, S.K.; Sethi, B.P.S.; Chopra, S. Thermal performance of the “Rohini”—An improved wood cookstove’, 1990, Original Research Article, 409-419.
- Taneja, A. Indoor Air Quality of Houses Located in the Urban Environment of Agra, India. New York Academy of Sciences., 2008, 228-245.
- US Environmental Protection Agency.; (EPA), Particulate matter standards. Retrieved from http://www.epa.gov./oar/particlepollution/standars.html. 2006.
- World Health organization .; Guidelines for Air Quality, Geneva, WHO., 2000.

This work is licensed under a Creative Commons Attribution 4.0 International License.
![]()
A New Edition of Web of Science
Journal Impact Factor
2022: 0.5
Five Year: 0.8
Journal is Indexed in

Cabells Whitelist
![]()


