A novel method for determination of topramezone residues in maize
Karri. Apparao*1, M. S. Surendra Babu2, Tentu. Nageswara Rao1 and M. V. Basaveswara Rao1
1Department of Chemistry, Krishna University, Machilipatnam, Andhra Pradesh, India.
2Department of Chemistry, GITAM University, Hyderabad, Telangana, India.
Corresponding Author Email: - appu.karri75@gmail.com
DOI : http://dx.doi.org/10.13005/ojc/31.Special-Issue1.26
Article Received on :
Article Accepted on :
Article Published : 09 Sep 2015
A simple and inexpensive method was developed using solid-phase extraction, together with high performance liquid chromatographic method with UV detection for determination of topramezone residues in maize. The evaluated parameters include the extracts by phenyl solid phase extraction cartridge using methanol, distilled water and tetrahydrofuran solvents. The method was validated using maize samples spiked with topramezone at different fortification levels (0.01 and 0.1 µg/g). Average recoveries (using each concentration six replicates) ranged 85-95%, with relative standard deviations less than 2%, calibration solutions concentration in the range 0.01-10.0 µg/mL and limit of detection (LOD) and limit of quantification (LOQ) were 0.003µg/g and 0.01µg/g respectively. Finally the maize and soil residue samples were re analyzed by HPLC.
KEYWORDS:HPLC; LOD; LOQ; topramezone; maize and soil
Download this article as:| Copy the following to cite this article: Apparao K, Babu M. S. S, Rao T. N, Rao M. V. B. A novel method for determination of topramezone residues in maize. Orient J Chem 2015;31(Special Issue1). |
| Copy the following to cite this URL: Apparao K, Babu M. S. S, Rao T. N, Rao M. V. B. A novel method for determination of topramezone residues in maize. Orient J Chem 2015;31(Special Issue1). Available from: http://www.orientjchem.org/?p=10667 |
Introduction
Topramezone is the first herbicide belonging to a new chemical class called pyrazolones1. In sensitive plant species topramezone inhibits the enzyme 4-hydroxy-phenyl-pyruvat-dioxygenase. As a result, the biosynthesis of plastochinones and indirectly of carotinoides discontinues, leading to a discruption of the synthesis and function of chloroplasts. Consequently, chlorophyll is destroyed by oxidation. This process is expressed in pronounced bleaching symptoms of the growing shoot tissue and subsequent necrosis of the aboveground plant matter.The pronounced selectivity in maize consists of a lower sensitivity of enzymatic target and a faster metabolic decomposition in maize compared to sensitive species. Topramezone is taken up by the shoot and the roots, the distribution within the plants is both akro and basipetally. Uptake by and distribution within the shoot is significantly increased with asuitable adjuvant. Topramezone has favorable toxicological and ecotoxicological properties. Water solubility and persistency in the soil are in a medium range, which results in weed control also through soil uptake. However, due to the strongly pronounced foliar activity of this compound even against advanced weed growth stages and the very good crop safety, topramezone is intended to be used postemergence of the crop in a range from 1to 8 leaf stage of maize.
Various methods have been described for the determination of these residues, using solid-phase micro extraction (SPME)Supercritical fluid extraction (SFE)and liquid – liquid extraction3,4. However, none of the published researches to date have reported the residue analysis of tolfenpyrad in mango fruit.
Experimental
Standards, Reagents and Samples
The analytical standard of (99.9%) was obtained from Sigma Aldrich. HPLC grade acetonitrile, methanol and water were purchased from rankem, analytical grade solvent i.e., tetrahydrofuran was supplied from Merck Limited and maize was collected from local cultivation maize field.
Standard Stock Solutions
The topramezone stock solutions was individually prepared in acetonitrile at a concentration level 1000 µg/g and stored in a freezer at -18°C2. The stock standard solutions were used for up to 3 months. Suitable concentrations of working standards were prepared from the stock solutions by dilution using acetonitrile, immediately prior to sample preparation.
Sample Preparation
Representative 50.0 gram portions of maize fortified with 0.1 mL of working standard stock solution. The sample was allowed to stand at room temperature for one hour, before it was kept at refrigerator condition, until analysis.
Extraction and Clean up
The representative homogenized sample (maize 50g) was taken in a 500 ml stoppered conical flask and extracted with 100 ml of water and methanol (1:1) using an end-over-end mechanical shaker for about 30 minutes and filtered. Extraction was repeated twice with 50 ml of same solvent. Combined filtrate was passed through celite filter and concentrated to 5 ml using vacuum rotary evaporator.
Solid Phase Extraction
A phenyl solid phase extraction10 cartridge was conditioned with 10 ml of methanol and water (1:1). Concentrated extract was percolated through the cartridge and eluate was discarded. Attached the phenyl SPE cartridge column to a conditioned Envicarb Cartridge column with an adapter. Eluted the residues from upper to lower cartridge with 10 ml of water/methanol (1:1). Then phenyl cartridge column was removed and residues were eluted from Envicarb Cartridge with 10 ml of water/tetrahydrofuran (9:1). Evaporated the residues to near dryness and and then re-dissoved in 20 mL of acetonitrile. The sample was filtered through 0.45 µm filter and analysed by HPLC-UV.
Instrumentation
HPLC-UV separation parameters
The HPLC-UV system used, consisted shimadzu high performance liquid chromatography with LC- 20 AT pump and SPD-20A interfaced with LC solution software, equipped with a reversed phase C18 analytical column of 250 mm x 4.6 mm and particle size 5 µm (Phenomenex Luna-C18) Column temperature was maintained at 30°C. The injected sample volume was 20µL. Mobile Phases A and B was acetonitrile and 0.1 % ortho phosphoric acid in HPLC grade water (65:35 (v/v)). The flow- rate used was kept at 0.9 mL/min. A detector wavelength was 225 nm.
Method Validation
Method validation ensures analysis credibility. In this study, the parameters accuracy, precision, linearity and limits of detection (LOD) and quantification (LOQ) were considered5,6. The accuracy of the method was determined by recovery tests, using samples spiked at concentration levels of 0.01 and 0.1 µg/g. Linearity was determined by different known concentrations (0.01, 0.1, 0.5, 1.0, 2.0 and 10.0 µg/mL) were prepared by diluting the stock solution. The limit of detection (LOD µg/g) was determined as the lowest concentration giving a response of 3 times the baseline noise defined from the analysis of control (untreated) sample. The limit of quantification (LOQ µg/g) was determined as the lowest concentration of a given herbicide giving a response of 10 times the baseline noise.
Results and Discussion
Specificity
Aliquots of topramezone, control sample solution, extracted solvents and mobile phase solvents were assayed to check the specificity. There were no matrix peaks in the chromatograms to interfere with the analysis of residues shown in (Figure 1 and 2). Furthermore, the retention time of topramezone was 5.3 min (Approximately).
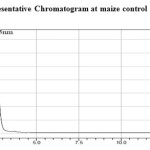 |
Figure 1: Representative Chromatogram at maize control Click here to View figure |
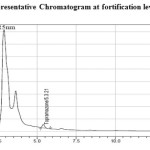 |
Figure 2: Representative Chromatogram at fortification level of 0.01 µg/g Click here to View figure |
Linearity
30.03 mg of topramezone reference standard was taken into 10 mL volumetric flask and dissolved in acetonitrile, sonicated and made upto the mark with the same solvent. The concentration of the stock solution was 3000 µg/mL. From this stock solution prepared by different known concentrations of standard solutions (0.01, 0.1, 0.5, 1.0, 5.0 and 10.0 µg/mL) were prepared into a different 10 mL volumetric flasks and made upto the mark with acetonitrile. The serial dilution details were presented in Table 1. These standard solutions were directly injected into a HPLC. A calibration curve has been plotted of concentration of the standards injected versus area observed and the linearity of method was evaluated by analyzing six solutions. The peak areas obtained from different concentrations of standards were used to calculate linear regression equation. This was Y=17184.03X + 36.38 with correlation coefficient of 1.0000 respectively. A calibration curve showed in (Figure 3).
Table 1: Serial dilutions of linearity standard solutions
|
Stock solution concentration (µg/mL) |
Volume taken from stock solution (mL) |
Final make up volume (mL) |
Obtained concentration (µg/mL) |
|
3000 |
0.333 |
10 |
100 |
|
100 |
1.000 |
10 |
10 |
|
100 |
0.500 |
10 |
5 |
|
100 |
0.100 |
10 |
1 |
|
10 |
0.5 |
10 |
0.5 |
|
10 |
0.1 |
10 |
0.1 |
|
1 |
0.1 |
10 |
0.01 |
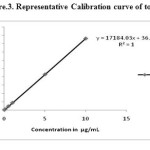 |
Figure 3: Representative Calibration curve of topramezone Click here to View figure |
Accuracy and Precision
Recovery studies were carried out at 0.01 and 0.1 µg/g fortification levels for topramezone in maize. The recovery data and relative standard deviation values obtained by this method are summarized in Table 2.
Table 2: Recoveries of the topramezone from fortified maize control sample (n=6)
|
Fortification Concentration in µg/g |
Replication |
Recovery (%) |
|
|
R1 |
85 |
||
|
R2 |
84 |
||
|
R3 |
85 |
||
|
0.01 |
R4 |
84 |
|
|
R5 |
86 |
||
|
R6 |
86 |
||
|
Mean |
85.17 |
||
|
STDEV |
0.75 |
||
|
RSD in % |
0.88 |
||
|
R1 |
93 |
||
|
R2 |
94 |
||
|
R3 |
94 |
||
|
0.1 |
R4 |
96 |
|
|
R5 |
96 |
||
|
R6 |
95 |
||
|
Mean |
94.67 |
||
|
STDEV |
1.21 |
||
|
RSD in % |
1.28 |
These numbers were calculated from four (6) replicate analyses of given sample (topramezone) made by a single analyst on one day. The repeatability of method satisfactory (RSDs<2 %)7,8.
Detection and Quantification Limits
The limit of quantification was determined to be 0.01 µg/g. The quantitation limit was defined as the lowest fortification level evaluated at which acceptable average recoveries (85-95%, RSD<2%) were achieved. This quantitation limit also reflects the fortification level at which an analyte peak is consistently generated at approximately 10 times the baseline noise in the chromatogram. The limit of detection was determined to be 0.01 µg/g at a level of approximately three times the back ground of control injection around the retention time of the peak of interest.
Storage Stability
A storage stability study was conducted at refrigerator condition ( 5 ± 3°C ) and Ambient temperature (25 ± 5°C) of 0.1 µg/g level fortified fruit samples were stored for a period of 30 days at this temperature. Analysed for the content of topramezone before storing and at the end of storage period. The percentage dissipation observed for the above storage period was only less than 3% for topramezone showing no significant loss of residues on storage9. The results are presented in Table 3 and 4.
Table 3: Storage stability Details at refrigerator condition ( 5 ± 3°C )
|
Fortification Concentration in µg/g |
Storage Period in Days |
Recovery in % |
|
|
95 |
|||
|
94 |
|||
|
95 |
|||
|
93 |
|||
|
0 |
93 |
||
|
95 |
|||
|
Average |
94.2 |
||
|
STDEV |
0.98 |
||
|
RSD in % |
1.04 |
||
|
0.1 |
92 |
||
|
92 |
|||
|
89 |
|||
|
30 |
91 |
||
|
90 |
|||
|
90 |
|||
|
Average |
90.7 |
||
|
STDEV |
1.21 |
||
|
RSD in % |
1.34 |
Table 4: Storage stability Details at ambient Temperature (25 ± 2°C)
|
Fortification Concentration in µg/g |
Storage Period in Days |
Recovery in % |
|
|
94 |
|||
|
93 |
|||
|
92 |
|||
|
93 |
|||
|
0 |
94 |
||
|
94 |
|||
|
Average |
93.3 |
||
|
STDEV |
0.82 |
||
|
RSD in % |
0.87 |
||
|
0.1 |
89 |
||
|
90 |
|||
|
89 |
|||
|
30 |
91 |
||
|
90 |
|||
|
90 |
|||
|
Average |
89.8 |
||
|
STDEV |
0.75 |
||
|
RSD in % |
0.84 |
Calculations
The concentration of topramezone in the samples analyzed by HPLC was determined directly from the standard curve.
Y = mx + c
Where,
Y = peak area of standard (mAU*sec)
m = the slope of the line from the calibration curve
x = concentration of injected sample (mg/L)
c = ‘y’ intercept of the calibration curve
The recovered concentration or Dose concentration was calculated by using the formula:
Recovered concentration or Dose concentration
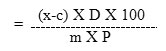
Where,
m = the slope of the line from the calibration curve
x = sample area of injected sample (mAU*sec)
c = ‘y’ intercept of the calibration curve
D = Dilution Factor
P = Purity of Test item
Conclusions
This paper describes a fast, simple sensitive analytical method based on HPLC-UV to determine the topramezone residues in mazie. The SPE extraction procedure is very simple and inexpensive method for determination of topramezone residues in maize. The mobile phase Acetonitrile and 0.1% ortho phosphoric acid in HPLC grade water showed good separation and resolution and the analysis time required for the chromatographic determination of the maize is very short (around 15 min for a chromatographic run).
Satisfactory validation parameters such as linearity, recovery, precision and LOQ were established by following South African National Civic Organization (SANCO) guidelines11. Therefore, the proposed analytical procedure could be useful for regular monitoring, residue labs and research scholars to determine the topramezone residues in different commodities (cereals, seed, oil, fruit, water and soil samples).
Acknowledgement
The authors are thankful to the Dr. Gowtham Prasad, S.V.V University, Hyderabad for his keen interest and help.
References
- Schonhammer, A.; Freitag, J.; Koch, H. Journal of plant deseases and protection. 2006, 1, 1023-1031.
- Raghubabu, K.; Nageswara Rao, T.; Patrudu, T.B,; Sreenivasulu, D. Int.J.Cur.Tr.Res. 2012, 1(2), 59-64.
- Steven, J.; Lehotay, A. Journal of AOAC International. 2000, 83 (3), 5.
- Demoliner, Adrina.; Sergiane S, Caldas.; Fabiane P, Costa.; Fabio F, Goncalves,; Rosilene M, Clementin. J. Braz. Chem. Soc. 2010, 21(8), 1424-1433.
- Nageswara Rao, Tentu.; Sreenivasulu, D.; Patrudu, T.B.; and Sreenivasula Reddy, E.G. Scholars Academic Journal of Bioscience. 2013, 1(3),80-84.
- DiMuccio, A.; Fidente, P,; Barbini, D.A.; Dommarco, R.; Seccia, S.; Morrica, P. Journal of Chromatography A. 2006, 1108, 1-6.
- Steven, J.; Lehotay, J. Journal of AOAC International. 2000, 83 (3).
- Sannino, A.; Bolzoni, L.; Bandini, M. Journal of Chromatography A. 2004, 1036,161-169.
- Nageswara Rao, Tentu.; Srinivasa Rao, T.; and Silpa, G. World journal of pharmaceutical research. 2012, 1(5), 1281-1290.
- Wong, Y.C.; Arifin, N.A.M.; Atiqah, N.A. Oriental Journal of Chemistry. 2013, 29(4), 1585-1588.
- SANCO Guidelines. Document No. SANCO/10684/2009.

This work is licensed under a Creative Commons Attribution 4.0 International License.
![]()
A New Edition of Web of Science
Journal Impact Factor
2022: 0.5
Five Year: 0.8
Journal is Indexed in

Cabells Whitelist
![]()


