Stability Indicating Method Development and Validation for the Estimation of Rotigotine by Rp-Hplc in Bulk and Pharmaceutical Dosage form
2Department of chemistry, Mallareddy engineering college, 14, India
Corresponding author Email: babuiict@gmail.com
DOI : http://dx.doi.org/10.13005/ojc/310486
Download this article as:
![]()
The purpose of the investigation was to develop a new RP-HPLC Method for estimation of Rotigotine in pharmaceutical dosage forms. Chromatography was carried out on an BDS C-8 column (4.6 x 150mm, 5μ particle size) with a isocratic mobile phase composed of 0.01N Potassium dihyrogen Ortho phosphate (adjusted to pH 4.8 with OPA solution), Acetonitrile (45:55v/v) at a flow rate of 1 mL/min. The column temperature was maintained at 30°C and the detection was carried out using a PDA detector at 224 nm. Validation parameters such as system suitability, linearity, precision, accuracy, specificity, limit of detection (LOD), limit of quantification (LOQ), Stability of sample and standard stock solutions and robustness were studied as reported in the International Conference on Harmonization guidelines. The retention time for Rotigotine was 2.691 min. The percentage recoverie of Rotigotine was 100.33%. The relative standard deviation for assay of patch was found to be less than 2%. The Method was fast, accurate, precise and sensitive hence it can be employed for routine quality control of patchs containing both drugs in quality control laboratories and pharmaceutical industries.
KEYWORDS:Rotigotine; ICH guidelines
Introduction
Rotigotine(ROTIGOTINE) is chemically named as 6-{propyl[2-(thiophen-2-yl)ethyl]amino}-5,6,7,8-tetrahydronaphthalen-1-ol. Rotigotine (Neupro) is a non-ergoline dopamine agonist indicated for the treatment of Parkinson’s disease (PD) and restless legs syndrome (RLS) in Europe and the United States. It is formulated as a once-daily transdermal patch which provides a slow and constant supply of the drug over the course of 24 hours1.
Rotigotine behaves as a partial or full agonist (depending on the assay) at all dopamine receptors listed, as an antagonist at the α2B-adrenergic receptor, and as a partial agonist at the 5-HT1Areceptor2. Rotigotine is an agonist at all 5 dopamine receptor subtypes (D1-D5) but binds to the D3 receptor with the highest affinity. It is also an antagonist at α-2-adrenergic receptors and an agonist at the 5HT1A receptors. Rotigotine also inhibits dopamine uptake and prolactin secretion. There is no indication of a QT/QTc prolonging effect of Neupro in doses up to 24 mg/24 hours3.
Various UPLC & HPLC assay Methods are also reported in the literature for the estimation of Rotigotine4-5. According to literature survey there is official Method for the estimation of Rotigotine by RP-HPLC in patch dosage forms. Hence, an attempt has been made to develop better Method for estimation and validation of Rotigotine in formulation in accordance with the ICH guidelines6-10.
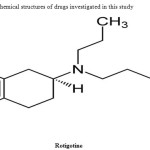 |
Figure 1: Chemical structures of drugs investigated in this study Click here to View figure |
Experimental
Instrumentation
Chromatography was performed with Alliance waters 2695 HPLC provided with high speed auto sampler, column oven, degasser and & 2996 PDA detector to provide a compact and with class Empower-2 software.
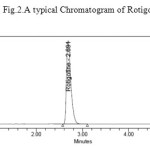 |
Figure 2: A typical Chromatogram of Rotigotine Click here to View figure |
Reagents and Chemicals
The reference sample of Rotigotine was provided as gift samples from Spectrum pharma research solutions, Hyderabad. HPLC grade acetonitrile, HPLC grade Methanol and all other chemicals were obtained from Merck chemical division, Mumbai. HPLC grade water obtained from Milli-Q water purification system was used throughout the study. Commercial formulation (Neupro ; Dosage: Rotigotine-4mg patch) were purchased from the local pharmacy.
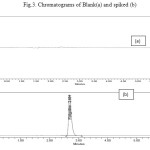 |
Figure 3: Chromatograms of Blank(a) and spiked (b) Click here to View figure |
Chromatographic condition
The chromatographic separation was carried out under the isocratic conditions. Chromatographic separation was achieved by injecting a volume of 10μl of standard into BDS (150 x 4.6 mm, 5m) column. The mobile phase composed of 0.01N Potassium dihyrogen Ortho phosphate (adjusted to pH 4.8 with triethylamine solution), Acetonitrile (45:55v/v) was allowed to flow through the column at a flow rate of 1 ml per minute for a period of 7 min at 300C column temperature. Detection of the component was carried out at a wavelength of 224 nm. The retention time of the component was found to be 2.691 min for Rotigotine.
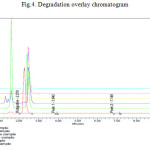 |
Figure 4: Degradation overlay chromatogram Click here to View figure |
Preparation of diluent solution
Diluent solution was prepared by mixing 500 ml of HPLC grade water with 500ml of cetonitrile, in a 1000ml beaker and sonicated for 15min.
Preparation of standard stock solution
Accurately Weighed and transferred 4mg of Rotigotine working Standards into 10ml clean dry volumetric flasks, add 3/4th vol of diluent, sonicated for 30 minutes and make up to the final volume with diluents.From the above stock solution, 1 ml was pipeted out in to a 10ml Volumetric flask and then make up to the final volume with diluent.
Preparation of Working Standard Solutions
Aliquot of 0.25, 0.50, 0.75, 1, 1.25 & 1.5 mL were pipette out from stock solution into 10 mL voluMetric flask separately for both ROTIGOTINE and volume was made up to 10 mL with diluent. This gives the solutions of 10, 20, 30, 40, 50and 60µg/mL for Rotigotine.
Sample preparation
5 patchs were weighed and calculate the average weight of each patch then the weight equivalent to 1 patch was transferred into a 10mL volumetric flask, 7mL of diluent added and sonicated for 25 min, further the volume made up with diluent and filtered. From the filtered solution 1ml was pipette out into a 10 ml volumetric flask and made upto 10ml with diluent.
Method validation
System suitability tests
To ensure the resolution and reproducibility of the HPLC system was adequate for the analysis, a system suitability test was established. Data from six injections of 10 µL of the working standard solutions of Rotigotine was used for the evaluation of the system suitability parameters like tailing factor, the number of theoretical plates, retention time.
Linearity
By appropriate aliquots of the standard Rotigotine solution with the mobile phase, six working solutions ranging between 10-60 μg/mL was prepared. Each experiment linearity point was performed in triplicate according to optimized chromatographic conditions. The peak areas of the chromatograms were plotted against the concentration of Rotigotine to obtain the calibration curve.
Accuracy
Recovery studies by the standard addition Method were performed with a view to justify the accuracy of the proposed Method. Previously analyzed samples of Rotigotine to which known amounts of standard Rotigotine corresponding to 50%, 100% and 150% of target concentration were added. The accuracy was expressed as the percentage of analyte recovered by the proposed Method.
Precision
Precision was determined as repeatability and intermediate precision (ruggedness), in accordance with ICH guidelines. The intra-day and inter-day precision were determined by analyzing the samples of Rotigotine. Determinations were performed on the same day as well as well as on consequent days.
Limit of detection and the limit of quantification
Limit of detection (LOD) and limit of quantification (LOQ) of Rotigotine was determined by calibration curve Method. Solutions of both Rotigotine was prepared in linearity range and injected in triplicate. Average peak area of three analyses was plotted against concentration. LOD and LOQ were calculated by using following equations. LOD = (3.3 ×Syx)/b, LOQ= (10.0×Syx)/b
Where Syx is residual variance due to regression; b is slope.
Robustness
The robustness of Rotigotine was performed by deliberately changing the chromatographic conditions. The organic strength was varied by ±5%, column temperature was varied by ±50c and the flow rate was varied by ±0.1 mL.
Stability
The sample and standard solutions injected at 0 hr (comparison sample) and after 24 hr (stability sample) by keeping at ambient room temperature. Stability was determined by determining %RSD for sample and standard solutions.
Degradation studies
Oxidation
To 1 ml of stock solution of Rotigotine, 1 ml of 20% hydrogen peroxide (H2O2) was added separately. The solutions were kept for 30 min at 600c. For HPLC study, the resultant solution was diluted to obtain 40µg/ml solution and 10 µl were injected into the system and the chromatograms were recorded to assess the stability of sample.
Acid Degradation Studies
To 1 ml of stock s solution Rotigotine, 1ml of 2N Hydrochloric acid was added and refluxed for 30mins at 600c .The resultant solution was diluted to obtain 40µg/ml l solution and 10 µl solutions were injected into the system and the chromatograms were recorded to assess the stability of sample.
Alkali Degradation Studies
To 1 ml of stock solution Rotigotine, 1 ml of 2N sodium hydroxide was added and refluxed for 30mins at 600c. The resultant solution was diluted to obtain 40µg/ml solution and 10 µl were injected into the system and the chromatograms were recorded to assess the stability of sample.
Dry Heat Degradation Studies
The standard drug solution was placed in oven at 1050c for 6 h to study dry heat degradation. For HPLC study, the resultant solution was diluted to 40µg/ml solution and10µl were injected into the system and the chromatograms were recorded to assess the stability of the sample.
Photo Stability studies
The photochemical stability of the drug was also studied by exposing the 40µg/ml solution to UV Light by keeping the beaker in UV Chamber for 7days or 200 Watt hours/m2 in photo stability chamber. For HPLC study, the resultant solution was diluted to obtain 40µg/ml solutions and 10 µl were injected into the system and the chromatograms were recorded to assess the stability of sample.
Neutral Degradation Studies
Stress testing under neutral conditions was studied by refluxing the drug in water for 6hrs at a temperature of 60º. For HPLC study, the resultant solution was diluted to 40µg/ml solution and 10 µl were injected into the system and the chromatograms were recorded to assess the stability of the sample.
Statistical Analysis
Wherever applicable, results were expressed as the Mean±SD, %RSD and data were analyzed statistically by using t- test with aid of Microsoft excel-2007 software and data were considered not significantly different at 5% significance level of probability P ≤0.05.
Results and Discussion
Rotigotine method development
Initially reverse phase liquid chromatography separation was tried to develop using various ratios of Methanol and Water, Acetonitrile and Water as mobile phases, in which drugs did not responded properly, and the resolution was also poor. The organic content of mobile phase was also investigated to optimize the separation of both drugs. To improve the tailing factor, the pH of mobile phase becomes important factor. Thereafter, 0.01N Potassium dihyrogen Ortho phosphate buffer (adjusted to pH 4.8 with dil. Orthophosphoric acid solution): acetonitrile were taken in isocratic ratio: 45:55 and with flow rate of 1.0 mL/min was employed. BDS column (4.6 x150mm, 5μ particle size) was selected as the stationary phase to improve resolution and the tailing of both peaks were reduced considerably and brought close to 1. To analyze drug detection were tried at wavelengths 224nm. Rotigotine showed maximum absorption at 224nm of wavelength and 224 nm was selected as the detection wavelength for PDA detector. The retention times were found to about 2.691 min for Rotigotine. The chromatogram obtained was shown in the Fig. 2.
Rotigotineand met method Validation
System suitability and Specificity
System suitability parameters such as number of theoretical plates, peak tailing, and retention time was determined. The total run time required for the method is only 6 minutes for eluting Rotigotine. The results obtained were shown in Table No.1. The chromatogram obtained for blank and spiked was shown in the Fig. 3.
Linearity
Rotigotine showed a linearity of response between 10-60 μg/mL. These were represented by a linear regression equation as follows: y (Rotigotine) = 62185x + 290.46 (r2=0.999), (r2=0.999) and regression line was established by least sqsuares method and correlation coefficient (r2 ) for Rotigotine is found to be greater than 0.98. Hence the curves established were linear.
Table 1: System suitability of Rotigotine
| System Suitability Parameters | Rotigotine |
| No of theoretical plates | 3999 |
| Tailing Factor | 1.58 |
| RT | 2.6 min |
| Mean Area | 3072763 |
| %RSD | 0.5 |
Accuracy
To pre analyzed sample solution, a definite concentration of standard drug (50%, 100% & 150 % level) was added and recovery was studied. The % Mean recovery for Rotigotine are 100.48% and these results are within acceptable limit of 98-102. The % RSD for Rotigotine was 1.08 and %RSD for Rotigotine is within limit of ≤2, hence the proposed method is accurate and the results were summarized in Table No.2.
Table 2: Results of accuracy of Rotigotine
|
Sample |
Amount Taken (µg/ml) |
Amount Recovered (µg/ml) |
Recovery (%) |
% RSD |
|
Rotigotine |
20 |
19.9 |
99.96 |
0.67 |
|
40 |
40.34 |
100.87 |
1.79 |
|
|
60 |
60.36 |
100.61 |
0.58 |
Precision: Repeatability
Six replicates injections in same concentration (40μg/ml of Rotigotine) were analyzed in the same day for repeatability and the % RSD for Rotigotine found to be 0.59 and % RSD for Rotigotine found to be within acceptable limit of ≤2 and hence method is reproducible and the results are shown in Table No. 3.
Table 3: Results of Precision for Rotigotine
|
Repeatability data |
Inter day precision |
||
|
S. No. |
Rotigotine |
Sr. No. |
Rotigotine |
| 1 |
3077904 |
1 |
3053027 |
| 2 |
3096311 |
2 |
3050091 |
| 3 |
3116531 |
3 |
3077065 |
| 4 |
3111634 |
4 |
3073134 |
| 5 |
3098633 |
5 |
3084300 |
| 6 |
3070659 |
6 |
3090325 |
| Mean |
3095279 |
Mean |
3071324 |
| Std. Dev. |
18107.9 |
Std. Dev. |
16439.4 |
| %RSD |
0.59 |
%RSD |
0.54 |
Intermediate Precision
Six replicates injections in same concentration were analyzed on two different days with different analyst and column for verifying the variation in the precision and the % RSD for Rotigotine is found to be 0.54 and it is within acceptable limit of ≤2. Hence the Method is reproducible on different days with different analyst and column. This indicates that the method is precise and the results are as shown in Table No. 3.
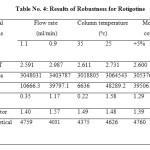 |
Table 4: Results of Robustness for Rotigotine Click here to View table |
Robustness
The robustness was established by changing the flow rate, column temperature and composition of the mobile phase within allowable limits from actual chromatographic conditions. It was observed that there were no marked change in mean Rt and RSD is within limit of ≤2 .The tailing factor, resolution factor and no. of theoretical plates are found to be acceptable limits for Rotigotine. Hence the Method is reliable with variations in the analytical conditions and the results of Rotigotine was shown in Table No.5.
Table 5: Results of stock solution stability for Rotigotine
|
Drug |
%Assay at 0 hr |
%Assay at 24 hr |
%Devaition |
|
ROTIGOTINE |
100.33 |
99.07 |
1.26 |
Stability of sample solution
The sample solution injected after 24 hr by keeping at ambient room temperature 30OC did not show any appreciable change. The % Deviation in the assay is not more than 2 and the results are shown in table-6.
Table 6: Results of HPLC Analysis of patcht for Rotigotine
| Label amount (mg) | Amount found(mg) n=6 | %Assay (Mean±SD) | RSD | ||||
| 4 | 4.013 | 100.33±1.098 | 0.59 | ||||
LOD and LOQ
LOD and LOQ for Rotigotine were 0.05 and 0.15 μg/mL respectively. The lowest values of LOD and LOQ as obtained by the proposed Method indicate that the Method is sensitive.
Patch Analysis
The Content of Rotigotine in the patchs was found by the proposed method. RSD values for both Rotigotine was within limit of ≤2 and the results were shown in Table No. 7.
Table 7: Results of HPLC Degradation of Rotigotine
| Degradation parameter | Purity angle | Purity treshould | %Drug degradated | ||
| Acid degradationalkali degradationoxidative degradation
Thermal degradation Photolytic degradation Neutral degradation |
0.1280.0890.190
0.091 0.109 0.090 |
0.273 0.263 0.267 0.268 0.267 0.273 |
3.87 1.99 5.91 0.83 0.97 0.72 |
||
Degradation studies
The degradation studies for Rotigotine was performed by various conditions like Acid, Alkali, Oxidation, Thermal, Photolytic and Neutral Degradation Studies and their limits like purity angle and purity threshold values like purity angle< purity threshold and the results shown in table no.8.
Conclusion
A new precise accurate and simple HPLC Method was developed and validated for estimation of Rotigotine pharmaceutical dosage form. This Method is fast, accurate, precise and sensitive hence it can be employed for routine quality control of patch containing drug in QC laboratories and industries.
References
- Chen, J, J.; Swope, D, M.; Dashtipour, K.; Lyons, K, E. Pharmacother. 2009, 29 (12),1452–67.
- Scheller, D.; Ullmer, C.; Berkels, R.; Gwarek, M.; Lübbert, H. Naunyn Schmiedebergs Arch Pharmacol. 2009, 379 (1),73–86.
- Loschmann, P. Eur. J. Pharmacol. 1989,166, 373.
- Murali, K, P.; Thirupathi, R, B.; Kishore, K, R; Venkateswarlu, P. Rese Jour Pub Bio Chem Scie.2010,1(4),848-857.
- Avinash, S.; Shakil, S.; Girish, D.; Prakash, K, A.; Veeravenkata, S, K. Der Pharma Chem. 2015;7(5):26-34.
- ICH (2000) Stability testing of new drug substances and products (Q1AR). International conference on harmonization, IFPMA, Stability Testing of New Drug Substances and Products: Geneva.
- ICH, Q1A (R2) Stability Testing of New Drug Substances and Products, International Conference on Harmonization, Geneva, (2003).
- ICH, Q1B Stability Testing: Photo stability Testing of New Drug Substances and Products, International Conference on Harmonization, Geneva, (1996).
- Maheshwaran, R., FDA Perspectives: Scientific Considerations of Forced Degradation Studies in ANDA Submissions, Pharmaceutical Technology, 2012: 36, 73-80.
- Snyder, L.R., Kirkland, J.J., Glajch, J.L., Practical HPLC Method Development, 2nd ed., Wiley, New York, (1997).


![]()


