Smart spectrophotometric methods for the simultaneous determination of vitamin B1 and B2 concentrations in complex mixtures
Nora Hamad Al-Shaalan
Chemistry department, Faculty of science, Princess Nourah Bint Abdulrahman University, Riyadh, Saudi Arabia. Corresponding Author Email: nora_shaalan@yahoo.com
DOI : http://dx.doi.org/10.13005/ojc/310463
Article Received on :
Article Accepted on :
Article Published : 03 Dec 2015
Simple, selective and reproducible spectrophotometric methods have been developed for the determination of thiamin and riboflavin concentrations in bulk and their pharmaceutical dosage forms using pure formulations and pharmaceutical formulations of chromazurol S (CAS). This method is based on the ion-association between the drugs and the acid dye (CAS) in weak base media in the presence of Triton X-100 as a solubilizing agent. The absorption factor was calculated to estimate thiamin and riboflavin concentrations in mixtures without previous separation by applying the absorption factor method and absorbance subtraction method.
KEYWORDS:Simple; Smart spectrophotometric; Smart spectrophotometric
Download this article as:| Copy the following to cite this article: Al-Shaalan N. H. Smart spectrophotometric methods for the simultaneous determination of vitamin B1 and B2 concentrations in complex mixtures. Orient J Chem 2015;31(4). |
| Copy the following to cite this URL: Al-Shaalan N. H. Smart spectrophotometric methods for the simultaneous determination of vitamin B1 and B2 concentrations in complex mixtures. Orient J Chem 2015;31(4). Available from: http://www.orientjchem.org/?p=12856 |
Introduction
Despite constituting only a very small fraction of the daily food intake, vitamins play a very important role in our health. [1] Water-soluble vitamins are considered to be a relatively complete formulation and are among the pharmaceutical preparations that are most widely used as vitamins and mineral supplements.
Thiamin (vitamin B1) contains two ring structures, 2-methyl-4-amino-5-hydroxymethylpyrimidine (hydroxymethylpyrimidine, HMP) and 4-methyl-5-β-hydroxyethylthiazole (hydroxyethylthiazole, HET). [2] Thiamin has several known functions in the body that have the potential to affect brain activity and behavior. In its thiamin diphosphate (ThDP) form, thiamine serves as a cofactor for enzymes involved in energy metabolism and formation of essential body constituents [3] as well as in the degradation of 3-methyl branched chain fatty acids and 2-hydroxy straight chain fatty acids [4,5].
Riboflavin (vitamin B2) is a necessary nutrient. It is a precursor of flavin mononucleotide and flavin adenine dinucleotide (FAD), which serve as coenzymes for numerous oxidases and dehydrogenases in eukaryotic cells[6]. Riboflavin is an essential vitamin that generally acts as a co-factor (flavin adenine mononucleotide and flavin adenine dinucleotide) in numerous enzymatic reactions in all forms of life. Additionally, it exhibits excellent photosensitizing properties, which have been used in photodynamic therapy for the treatment of various diseases. Various contemporary investigations strongly suggest that this vitamin has a tremendous potential for improving the chemotherapeutic potential of major anticancer drugs [7], [8] and [9,10]. Many analytical techniques, such as chromatographic[11-13], spectrophotometric[14-17], capillary electrophoresis [18] and voltammetry[19, 20] methods, have been developed and used for the quantitative determination of these vitamins in different samples.
Theory
a-Absorption factor method (AF)
The absorption factor method can be applied to analyze a mixture of two drugs, X and Y, with overlapping spectra. Y has interference at λmax of X (λx), but X does not show any absorption at another wavelength.
We can calculate the X absorption at λmax of x in a mixture (X+Y) using:
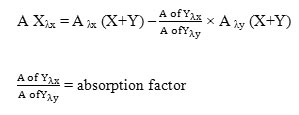
The X concentrations can be estimated by using the corresponding regression equation and plotting the absorbance values of the zero order curves against the concentrations [21].
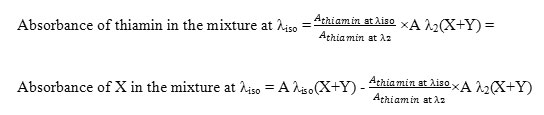
b- Absorbance subtraction method (AS)
This method is based on the same principle as the absorption factor method. It was developed to analyze a mixture of two drugs, X and Y, with overlapping spectra intersecting at the isoabsorptive point; while Y extends over X, X does not show any contribution at another wavelength (λ2). In this method, the isoabsorptive point λiso can be used for separate quantitative estimations of each X and Y in the mixture (X+Y). This determination can be performed by using the mathematically calculated factor of one of these components with a simple manipulation step, obtaining the absorbance values corresponding to X and Y separately. The concentrations of each component can then be obtained via the isoabsorptive point regression equation without any need for a complementary method.
The absorbance of Y in the mixture at λiso = abs1/abs2 x abs λ2(X+Y)
The absorbance of X in the mixture at λiso = abs λiso(X+Y) – abs1/abs2 ×abs λ2(X+Y)
Where abs λiso and abs λ2 are the absorbance values for Y at λiso and λ2, respectively;
abs1/abs2 is the absorbance factor; and abs λiso(X+Y) and abs λ2(X+Y) are the absorbance values of the mixture at these wavelengths, respectively [22].
In this work, sensitive, selective and low-cost methods for the determination of thiamin and riboflavin present in many multivitamin formulations are developed. These methods can be applied simply in any pharmaceutical manufacturing process or drug quality control laboratory to determine the concentrations of each vitamin in the mixture without previous separation.
Experimental
The scanned spectra of riboflavin and thiamin, with concentrations of 2.94 to 15 µg/ml and 4-20 µg/ml, respectively, were obtained in the 400-700 nm range. The thiamin and riboflavin absorbance values were measured at 450 nm and 410.5 nm, respectively. The absorption factor was the ratio of the absorbance at 428 nm and 495 nm. This was measured to determine the absorbance of thiamin and riboflavin in their mixtures without separation. The absorbance subtraction method was used to calculate the concentrations of each X and Y by using the isoabsorptive point unified regression equation obtained by plotting the absorbance values of the zero order spectra of either X or Y at the isoabsorptive point (λiso) against the corresponding concentrations X or Y, respectively [28].
Materials and Methods
All of the absorption spectra were obtained using a Shimadzu UV-1601(UV- visible) spectrophotometer, with a scanning rate of 200 nm/min and a bandwidth of 2.0 nm, equipped with 10-mm matched quartz cells.
Thiamin and riboflavin were obtained from BDH. The stock solution of vitamins was prepared in double distilled water and stored in a suitable dark bottle covered with aluminum foil. The solutions were stored in a cool environment and were replaced every week. Working solutions of the vitamins were prepared daily by diluting the stock solution in double distilled water and were then stored in dark conditions. Methavet- Dinurine from Mobedco (vitamin B1 8 mg, vitamin B2 9 mg) and B complex from Cenovis (15 mg vitamin B1 and vitamin B2) were used as the pharmaceutical preparations.
Ammonium and ammonium chloride buffer (7.6-7.8).
One percent nonionic surfactants in double distilled water (Triton X -100 and Tween 80) were obtained from BDH.
Chromazurol S (CAS), 1×10⁻³, was obtained from Fluka and prepared by dissolving an accurately weighed amount of the pure solid in double distilled water.
General Procedure
A- Spectrophotometric method
Transfer an appropriate amount of thiamin and riboflavin in a 10-ml calibrated flask, add 1 ml of buffer solution (pH 7.6-7.8), then add 1.0 ml of Triton X-100 and 1.5 ml of CAS. Dilute to the mark with water. After 10 minutes, measure the absorbance at 450 nm for thiamin and at 410.5 nm for riboflavin.
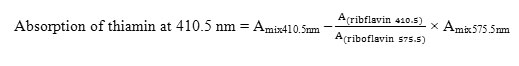
The absorbance values were measured at 410.5 and 575.5 nm for use in the absorption factor method. The absorbance of riboflavin at 410.5 nm, after the subtraction of thiamin interference, was calculated by applying the absorption factor equation. For use with the absorbance subtraction method, the absorbance was measured at λiso=505 nm and λ2=584 nm.
B- For pharmaceutical preparations
Twenty tablets of each product (Cenovis B Complex and Methavet – Dinurine) were powdered. An amount of the powder was weighed and dissolved in water. The volume was placed into a 10-ml measuring flask.
Results and Discussion
The zero order absorbance spectra of riboflavin and thiamin complexes (Fig1) show a severe overlap. The main task of this work is to establish novel, simple, sensitive and accurate analytical methods for the simultaneous determination of the riboflavin and thiamin concentrations in their bulk powders and in the pharmaceutical dosage form with satisfactory precision and accuracy.
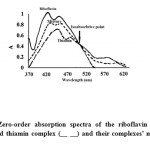 |
Figure 1: Zero-order absorption spectra of the riboflavin complex (__) and thiamin complex (__ __) and their complexes’ mixture (- -). |
Absorption Spectra
Several parameters, such as acidity, effect of temperature, effect of time and type of surfactants, were optimized to achieve high sensitivity and stability as well as reproducible results.
Reaction Conditions
Effect of the sequence of addition
For both thiamin and riboflavin, it was found that the addition sequence of the drug, buffer solution, surfactant and dye was optimal for giving high and stable absorbance.
Effect of Temperature
The effect of temperature was studied by measuring the absorbance values at different temperatures. The optimal reaction temperature was found to be 23-25 ˚C.
Effect of Time
The optimal reaction time was greater than 10 minutes. We found that high and stable absorbance was obtained after 10 minutes of reaction.
Effect of pH
It is well known that riboflavin and thiamin are not stable in alkaline conditions[23], but their complexes with CAS are more stable in weak base media. It was noticed that the maximum color intensity and highest absorbance values were observed in the buffer of 7.6 to 7.8 for thiamin and riboflavin.
Effect of Surfactants
In the absence of the solubilization agent, the ion-association complex would gradually separate out as a precipitate because of its hydrophobicity, which would affect the spectrophotometric measurement [17]. The effects of the type and amount of surfactants on the formation and stability of the associated ions were studied by adding different types of surfactants (ionic, nonionic and cationic). It was found that 1% of nonionic surfactant (Triton X-100) gave a stable and clear color.
Stoichiometric Relationship
Job’s method of continuous variation was employed. The molar ratio of (dye:drug) in the complexes was 1:1.
The zero order absorbance spectra of thiamin and riboflavin (Fig. 1) shows an overlap that would lead to difficulties for the determination of the thiamin and riboflavin concentrations by the direct method.
The aim of this work is to develop a simple and sensitive method for the simultaneous determination of the thiamin and riboflavin concentrations at their pharmaceutical dosage.
Validation of the Proposed Method
Standard calibration curves with a reagent were obtained under the optimal conditions using the relationship between the absorbance and the concentrations. The calibration graphs were described by the regression equation. The statistical parameters, correlation coefficient, intercept and slope are listed in Table 1.
Table 1: Analytical parameters for the determination of pure thiamin and riboflavin concentrations using CAS dye.
|
Parameters |
Vitamin B |
|
| Thiamin | Riboflavin | |
| λmax | 445 nm | 428 nm |
| Beer’s law (µg/ml) | 4-20 | 2.94- 15.9 |
| Molar absorptivity (Lmol-1cm-1) | 1.24 × 10⁴ | 1.602 × 10⁴ |
| Sandell sensitivity (µgml-1) | 2.39 × 10⁻² | 1.66 × 10⁻² |
| Limit of detection (LOD) (µgml-1) | 1.3 | 1.32 |
| Limit of quantification (LOQ) (µgml-1) | 4.0 | 4.01 |
| Slope (a) (mlµg-1ml-1) | 0.0053 | 0.0048 |
| Intercept (b) | 0.0001 | -0.07 |
| Correlation coefficient (r) | 0.9998 | 0.9999 |
| RSD% | 0.21 | 0.02 |
| RE% | 0.0014 | -0.002 |
Sensitivity
The molar absorptivity and the relative standard deviation values were calculated and are presented in Table 1. The limit of detection (LOD) and the limit of quantification (LOQ) were calculated using the formulas [24, 25]:
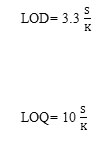
where is the standard deviation for the data obtained in five trials and K is the slope of the calibration curve.
Accuracy and Precision
To evaluate the precision of the suggested methods, the percentage relative deviation (RSD%) was calculated, and the percentage relative error (RE%) was estimated to evaluate the accuracy of the proposed method.
The precision was evaluated by preparing solutions of three different concentrations of thiamin and riboflavin and analyzing them in six different trials.
The percentage relative error was calculated by using the following equation:
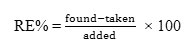
The obtained RSD% and RE% values indicate that the recommended method is highly accurate and reproducible.
The precision and accuracy values were determined within the same day to evaluate repeatability (Intra-day) and over five days to evaluate intermediate precision (Inter-day) and are presented in Table 2.
Table 2: Determination of the thiamin and riboflavin concentrations in laboratory prepared mixtures and in tablets by the absorption factor method.
|
Drugs |
Thiamin |
Riboflavin |
| Laboratory prepared method (n=5)* | ||
| Linearity | 3.5-19.5 | 2.5-15 |
| % Recovery ± RSD% | 100 ± 0.31 | 100.02 ± 0.4 |
| Inter-day** | ||
| % Recovery ± RSD% | 100.19 ± 1.24 | 100.37 ± 1.01 |
| Intra-day** | ||
| % Recovery ± RSD% | 99.47 ± 1.17 | 100.23 ± 0.99 |
| Methavet-Dinurine (8mg B1 and 9mg B2/tablet) | 100.28 ± 0.34 | 99.36 ± 0.29 |
| B complex (15mg/tablet), Cenovis | 100.45 ± 0.829 | 100.9 ± 0.66 |
*5 sets each of 3 replicates.
**Average value of four determinations.
The percentage recovery values for each drug were calculated and are listed in Table 2. The experimental results are presented in Tables 1 and 2. The obtained recoveries were good. The recovery values are close to 100%, which means that the suggested methods are highly accurate.
CAS has the following structure:
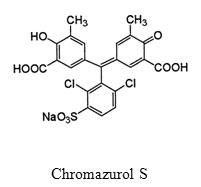
Riboflavin and thiamin form ion-association complexes with this dye. The composition of this complex was established by Job’s method. The results showed that drug:CAS ratio was 1:1 for both riboflavin and thiamin.
The main species of CAS was L2- in weak base media.
CAS has the following balance:
HL = L2- + H+
Therefore, the combination of riboflavin and thiamin with L2- formed ion-association complexes between CAS and the vitamins with λmax at 410.5 nm for VB1 and at 450 nm for VB2 [17][27].
VB1 or VB2 + L2- = [VB1 or VB2] [L2-]
The maximum negative charge density of L2- is found at the dissociated phenolic hydroxyl, while the charge density of –SO3– is lower; therefore, riboflavin and thiamin should react with the dye at the phenolic hydroxyl rather than at the –SO3– group. The ion-association complexes were formed due to weak bonding forces, such as electrostatic attraction and hydrophobic interactions[17].
AF Method
The λmax values for riboflavin and thiamin complexes were 410.5 nm and 450 nm, respectively. Because their λmax differs by more than 20 nm, the absorption factor method was applied for the estimation of their concentrations in the formulation. Quantitative determination of the thiamin concentrations was carried out by subtracting the interference of riboflavin using the experimentally calculated absorption factor.
The value of the absorption factor was found to be 3.24.
AS method
For the determination of the concentration of riboflavin and thiamin in their mixtures, we measured the absorbance values corresponding to VB1 or VB2 separately at an isoabsorptive point of 505 nm; the absorbance values for thiamin and riboflavin can then be calculated using the absorbance factor.
Table 3: Statistical analysis of the proposed method and the reported method [25].
| Parameters | Thiamin | Riboflavin | ||
| Proposed method | Reported method [25] | Proposed method | Reported method [25] | |
| Mean ± SD* | 99.87 ± 1.11 | 99.75 ± 0.66 | 100.08 ± 0.81 | 99.99 ± 0.76 |
| n | 5 | 5 | 5 | 5 |
| Variance | 1.232 | 0.444 | 0.658 | 0.542 |
| t-Value** | 1.89 | 0.464 | ||
| F-Value** | 2.775 | 1.214 | ||
*Mean of six independent analysis.
**The theoretical values of t and F are 2.306 and 6.39, respectively, for four degree of freedom and 95% confidence limit.
Analysis of Pharmaceutical Formulations
The proposed method was applied to determine the thiamin and riboflavin concentrations in their combined pharmaceutical formulations, and the results were compared with those obtained using a previously reported method [25]. The obtained results are presented in Table 3 and show that our methods are suitable for the routine determination of the thiamin and riboflavin concentrations in their combined formulation.
Conclusion
In this work, smart, novel and simple spectrophotometric methods were applied for the simultaneous determination of the concentrations of two components in their mixture. The application of these techniques without any preliminary separation step to two commercial pharmaceutical preparations of vitamin B1 and B2 (tablets) was highly successful.
References
- Olaniyi, A.A.; (2000). Essential Medicinal Chemistry, 2 nd Edition, Shaneson, Ibadan, p. 324.
- Hayashi , M. ; Kobayashi , K. ; Esaki , H. ; Konno , H. ; Akaji , K. ; Tazuya, K. ; Yamada , K. ; Nakabayashi , T. ; Nosaka , K. , Biochimica et Biophysica Acta (BBA) – Proteins and Proteomics 2014 , 1844, 803–809.
- McCormick, D.B. ; Niacin, riboflavin, and thiamin M.H. Stipanuk (Ed.), Biochemical and physiological aspects of human nutrition, W.B. Saunders Company, Philadelphia (2000), 458–482
- Casteels, M.1.; Sniekers, M.; Fraccascia, P.; Mannaerts, GP.; Van Veldhoven, P.P., Biochem Soc Trans, 2007, 35, 876–880.
- Hills, J. I.; Golub, M. S.; Bettendorff, L.; Keen, C. L., Neurotoxicology and Teratology, 2012, 34, 242–252.
- Du, L.; Li, G.; Jin, Y.; Wang, L.; Xu, Q.; Dong, J., Int. J. Pharm.2013, 450, 338–344
- Naseem, I.; Hassan, I.; Alhazza, I. M.; Chibber, S., J. Trace Elements Med. Bio. 2015, 29, 303–314.
- Baier, J. ; Maisch, T. ; Maier, M.; Engel, E.; Landthaler, M.; Bäumler, W., Biophys J. 2006, 91 ,1452–1459.
- Khan, Y.A.; Kashiwabuchi, R.T. ; Martins, S.A.; Castro-Combs, J.M.; Kalyani, S.; Stanley, P.; Flikier, D.; Behrens, A., Ophthalmology, 2011, 118 , 324–331.
- Muñoz, M.A.; Pacheco, A.; Becker, M.I.; Silva, E.; Ebensperger, R.; Garcia, A.M.; De Ioannes, A.E.; Edwards, A.M.,. J. Photochem Photobiol B 2011, 103 , 57–67.
- Anyakora, C.; Afolami, I.; Ehianeta, T.; Onwumere, F., Afr. J. Pharm. Pharma. 2008, 2, 029-036.
- Petteys, B. J.; Frank, E. L., Clinica Chimica Acta 2011, 412, 38–43.
- Gatti, R.; Gioia, M.G., Analytica Chimica Acta, 2005, 538, 135–141.
- Ghasemi, J.; Vosough, M., Spectr. Lett. 2002 , 35, 153-169.
- Amrutkar, R.D., Rakibe, V.D. ; Prakruti M. A., Int. J. Res. Pharm. Biomed. Sci. 2013, 4 , 1229- 1232.
- Jin, P.; Xia, L.; Li, Z.; Che, N.; Zou, D.; Hu, X., J. Pharm. Biomed. Anal. 2012, 70, 151–157.
- Liu, S.; Zhang, Z.; Liu, Q.; Luo, H.; Zheng, W., J. Pharm. Biomed. Anal. 2002, 30, 685–694.
- Chen, J. ; Sun, J. ; Liu, S. , Anal. Lett. 2013, 46, 887-899.
- Sá, É. S.; da Silva, P. S.; Jost, C. L.; Spinelli, A., Sens. Act.B: Chem. 2015, 209, 423–430.
- Tyszczuk-Rotko, K. , Food Chem. 2012, 134, 1239–1243.
- Lotfy, H. M.; Hegazy, M. A., Spectrochimica Acta Part A: Mole. Bio. Spectr. 2013, 113, 107–114.
- Kelani, K.M.; Shalaby, A.A.; Elmaamly, M.Y.; Halim, M.K., pharm. Anal. acta, 2015, 6, 1-11.
- Braz. J. , J. Braz. Chem. Soc. 2006, 17 ,1678-4790.
- International Conference on Harmonisation of Technical Requirements for Registration of Pharmaceuticals for Human Use. ICH Harmonised Tripartite Guideline, Validation of Analytical Procedures: Text and Methodology Q2(R 1), Complementary Guideline on Methodology, London, November 2005.
- Miller, J.N.; Miller, J.C., “Statistics and chemometrics for analytical chemistry” 5th ed., Prentice Hall, England, 2005.
- Chatzimichalakis, P.F.; Samanidou, V.F.; Verpoorte, R.; Papadoyannis, I.N., J . Sep. Sci. 2004 ,27, 1181-1188.
- Choragudi, S.F.; Santoshi, K.; Santhi, G.; Keerthanam, V.; Ravali, V.; Swetha Parvathi, S., Asian J. Chem. 2010 , 22, 5789-5791.
- Lotfy, H.M.; Hegazy, M.A.; Mowaka, S.; Mohamed, E.H., Spectrochim Acta A Mol Biomol Spectrosc. 2015, 140, 495-508.

This work is licensed under a Creative Commons Attribution 4.0 International License.
![]()
A New Edition of Web of Science
Journal Impact Factor
2022: 0.5
Five Year: 0.8
Journal is Indexed in

Cabells Whitelist
![]()


