Optimization of Sardine Oil Neutralization Process from Fish Meal Industry By-product
Sugeng Heri Suseno*, Nadia Fitriana, Agoes M. Jacoeb and Saraswati
Technology of Aquatic Products Department Fisheries and Marine Sciences Faculty, Bogor Agricultural University Jl. Agatis, Kampus IPB Dramaga, Bogor 16680, West Java – Indonesia.
Corresponding Author email : sug_thp@yahoo.com
SaraswatiDOI : http://dx.doi.org/10.13005/ojc/310487
Article Received on :
Article Accepted on :
Article Published : 03 Nov 2015
This study aimed to optimize the neutralization process of sardine oil. Central composite design of RSM was used as experimental design with two variables, NaOH concentration and neutralization temperature. The result showed that quadratic regression model for yield and PV as response and linear regression model for FFA as response were suitable to explain the interaction between variables and responses. The optimum operation condition was reached by a treatment of NaOH 18 °Be at 40 ℃. Its desirability value was 0.534. The validation of optimum point resulted 85.90% of oil yield, 90.77% FFA reduction, and 36.92% PV reduction.
KEYWORDS:NaOH concentration; neutralization; optimization; sardine oil; temperature
Download this article as:| Copy the following to cite this article: Suseno S. H, Fitriana N, Jacoeb A. M, Saraswati. Optimization of Sardine Oil Neutralization Process from Fish Meal Industry By-product. Orient J Chem 2015;31(4). |
| Copy the following to cite this URL: Suseno S. H, Fitriana N, Jacoeb A. M, Saraswati. Optimization of Sardine Oil Neutralization Process from Fish Meal Industry By-product. Orient J Chem 2015;31(4). Available from: http://www.orientjchem.org/?p=12151 |
Introduction
Indonesia has a high potency as a producer of fish oil because of its high aquatic resources. One source of fish oil was derived from by-products of sardine meal industry. Indonesia Ministry of Fisheries and Marine Affairs10 data showed that production of sardines in Bali – Indonesia reached 5,573 tons in 2012. Sardine was mostly utilized as raw material for canning and fish meal industry. Fish meal processing industry will produce fish oil as by-product which still contain high -3 fatty acids8. Omega-3 fatty acids are very important for the growth and development of the brain11.
The high temperatures used in the fish meal processing industry may result the high degree of hydrolysis in fish oil. Heat exposure in the presence of moisture can lead to high free fatty acid concentrations as well as oxidative degradation. Elevated free fatty acid concentrations is undesirable because it cause high losses during further processing of the oil15. as well as oxidative degradation. Elevated free fatty acid concentrations is undesirable because it cause high losses during further processing of the oil15.
Removal of the free fatty acid can be accomplished by physical or chemical way15. Chemical neutralization usually using alkaline solution (NaOH). Neutralization with NaOH is mostly used in oil refining industry because it works more efficient, readily available, low cost, and more effective in reducing high levels of free fatty acids14.
The purpose of this research was to optimize the operational conditions of the neutralization process for sardine oil using Respond Surface Method (RSM). This method does not require large quantities of experimental data and does not require a long time so this method can automatically save the research costs13. In this research, the influence of NaOH concentration and neutralization temperature on oil yield and key oxidation (free fatty acids and peroxide) parameters were evaluated.
Materials and Methods
Materials and Equipments
Crude sardine oil as by-product of fish meal processing industry was used in this work. It was taken from fish meal industry in Bali, Indonesia and kept in cold storage. Sodium hydroxide was used in the neutralization procedure. Other supporting materials were KOH 0.1 N, sodium thiosulfate (Na2S2O3) 0.01 N, acetic acid, chloroform, potassium iodide (KI), phenolphthalein indicator, starch solution, ethanol 96%, and distilled water. Some equipments used were digital scales, burette, glass tools, aluminium foil, water bath, and mohr pipettes.
Preliminary Research
Preliminary research conducted to obtain optimum alleged point and will be the central point in the main study. This preliminary neutralization process carried out by mixing an alkaline solution (NaOH) with crude sardine oil. The concentration of alkaline solution for neutralization is expressed by Baume degrees (oBe). The amount of NaOH is calculated by the following formula:
Table 1: NaOH concentration in Baume degree12
| Baume degree ( Be) | NaOH solution (%) |
| 14 | 9.50 |
| 16 | 11.06 |
| 18 | 12.68 |
| 20 | 14.36 |
| 22 | 16.09 |
| 24 | 17.87 |
Oil which has free fatty acid content less than 1% is normally uses softer alkaline solution (8-12 Be), while for oil having higher free fatty acid content uses 20 Be alkaline solution. Solution which is more dense than 20 Be is only used if the acidity of the oil is very high (more than 6%)5.
In this research, the best NaOH concentration and neutralization temperature were determined, fish oil sample was heated at a temperature of 60 ℃ and then mixed with NaOH solution (16, 18, and 20 °Be) which has been preheated to 60 ℃. The mixture was stirred using magnetic strirrer for 10 minutes at 800 rpm, then mixed with hot water 5% and decanted for 15-30 minutes. After decantation process, sample was then separated from the soapstock and produced semi-refined oil. Neutralization temperature was determined after obtaining the best NaOH concentration, the temperature treatment were 40, 60, 80, and
100 ℃. The neutralization process was carried out as same as determining the NaOH concentration.
Main Research
The Central Composite Design, one alternative of Response Surface Method, used to determine the optimum operation condition of fish oil neutralization. Design Expert 7.0.0. was used as data processing software. The central point obtained from preliminary was 18 Be as NaOH concentration and 60 C as neutralization temperature. Its central point was used to conduct a main research.
The expansion of treatment was done by combining each point before (-1) and after (+1) the maximum condition. NaOH concentration in (-1) point and (+1) point were 16 Be and 20 Be, respectively. Neutralization temperature in (-1) point and (+1) point were 40 C and 80 C, respectively.To avoid refractive, the treatment was expanded again by combining maximum condition to the point and , where was the expansion of the matrix component and formulated as = 2k/4 (k = variables tested). The factors design can be seen in the following table.
Table 2: Neutralization variables factors design
| Factor |
Code |
Level |
||||
|
1,414 |
1 |
0 |
1 |
1,414 |
||
| NaOH concentration ( Be) |
X1 |
14 |
16 |
18 |
20 |
22 |
| Temperature ( ) |
X2 |
30 |
40 |
60 |
80 |
90 |
Determination of Oxidation Parameters
Free Fatty Acids (FFA)
Free fatty acids (FFA) content of the oil samples was determined according to the standard method AOCS 1998 Ca 5a-40 based on a % free oleic acid in the sample2. A total of 2g of oil was dissolved in 25 ml of 96% neutral alcohol in 250 mL erlenmeyer, heated for 10 minutes, then mixed by 2 mL phenolphthalein indicator. The mixture was shaken and titrated with 0.1 N KOH until the pink color appearance was not lost in 10 seconds. The percentage of FFA was calculated by the following equation:
V = Number of KOH titration (ml)
N = KOH normality
G = Sample weight (g)
282.5 = Molecular weight of oleic acid
Peroxide Value (PV)
The peroxide value (PV) of the oil was determined according to the AOAC 2005 Official Method1. About 2 g of sample in 250 mL erlenmeyer was mixed with 30 ml mixture solution of acetic acid and chloroform (3:2), then it was added by 0.5 ml saturated potassium iodide (KI) solution with stirring, after that 30 ml of distilled water was then added. The mixture was titrated by 0.01 N sodium thiosulfate (Na2S2O3) until the solution color changed to yellow. About 0.5 mL of 1% starch indicator solution was added to the mixture solution, the mixture color would change to blue, then titration was continued until the blue color of the solution disappeared. The peroxide value was calculated by the following equation:
S = Number of Na2S2O3titration (ml)
N = Na2S2O3normality
G = Sample weight (g)
Result and Discussion
This study optimized two factors of process conditions, NaOH concentration and neutralization temperature. Those factors were used to determine the optimum yield and reduction of free fatty acids content and peroxide value. The RSM experimental design can be seen in the following table.
Table 3: Experimental design and measured value for the response variables
|
STD |
NaOH ( Be) |
Temp.( ) |
Yield (%) |
FFA (%) |
PV (meq/kg) |
|
1 |
16 |
40 |
82.17 |
0.45 |
25.62 |
|
2 |
20 |
40 |
75.93 |
0.49 |
22.71 |
|
3 |
16 |
80 |
73.97 |
0.55 |
26.17 |
|
4 |
20 |
80 |
80.64 |
0.52 |
20.07 |
|
5 |
14 |
60 |
85.91 |
0.45 |
24.84 |
|
6 |
22 |
60 |
87.7 |
0.49 |
26.93 |
|
7 |
18 |
30 |
59.6 |
0.28 |
21.51 |
|
8 |
18 |
90 |
82 |
0.49 |
19.36 |
|
9 |
18 |
60 |
86.2 |
0.49 |
24.69 |
|
10 |
18 |
60 |
85.58 |
0.48 |
24.54 |
|
11 |
18 |
60 |
89.03 |
0.45 |
24.33 |
|
12 |
18 |
60 |
87.9 |
0.52 |
21.93 |
|
13 |
18 |
60 |
88 |
0.45 |
24.31 |
Each response variable will generate one model which is suggested by the program. The feasibility of the polynomial model is shown by coefficients determination R2 and the significance of F-value of each variable factor4. Initially, the determination of the polynomial model was conducted by referring to the suggested criteria by Sequential Model of Squares (SMSS), lack of fit, R2 value, and adjusted-R2. Then analysis of variance (ANOVA) is proceed, a good model has significant value to the response, and not significant value to the lack of fit, R2 value, and adjusted-R2. In addition, the analysis of variance can also show the influence of combination to the factors by evaluating its F-value. The greater of the F-value, the more significant effect. The significant effect of variable factors to responses are characterized by p-value “Prob> F” which is less than 0.05. In the diagnostics chapter, we can see the spread of data points to the normality line through residual normality plot. The solution of optimum point obtained by evaluating the regression equation and analyzing response surface of the contour graph6.
Analysis of Factor Combination with Oil Yield as Response
The range of oil yield obtained was 59.6% -89.03% with the yield average value was 81.89%. Based on the analysis Sequential Model Sum of Squares (SMSS), lack of fit, R2, and adjusted-R2 (Table 4), appropriate models resulted optimum yield was quadratic polynomial models.
Table 4: Value of optimization parameter for yield as response
|
Parameter |
SMSS Prob>F |
Lack of fit Prob>F |
R2 |
Adjusted R2 |
Annotation |
|
Linear |
0.5129 |
0.0008 |
0.1250 |
0.0500 |
|
|
2FI |
0.4706 |
0.0006 |
0.1769 |
0.0975 |
|
|
Quadratic |
0.0076 |
0.0044 |
0.7959 |
0.6501 |
Suggested |
Table 4 shows that the quadratic model has significant SMSS value with the “Prob> F” is less than 0.05 (0.0076). “Prob> F” of Lack of fit values is less than 0.05 (0.0044) which means there is lack of fit (significant). Significant lack of fit value shows that there may incompatible yield response data to the model. R2 value on quadratic model is 0.7959. R2 value means that the influence of variables X1 and X2 to the variable responses change is 79.59% while the rest 20.41% influenced by another unknown variable.
Analysis of variance (ANOVA) shows the effect of each factor on yield response. Based on the effect of both factors, the temperature gives significant effect to the yield value (p-value<0.05). The following model is actual form of polynomial equations for oil yield as response:
Yield response (Y) = 50.332233 – 0.83341 X1 1.25198 X2 0.080688 X1X2 0.10619 X12– 0.021068 X22
X1 = NaOH concentration ( Be)
X2 = Temperature (°C)
Contour and 3D surface yield values can be seen in this following chart
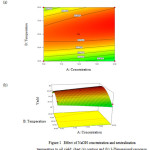 |
Figure 1: Effect of NaOH concentration and neutralization temperature to oil yield: chart (a) contour and (b) 3-Dimensional response. Click here to View figure |
Based on Figure 1(a) contour lines are circular with a red dot in the innermost circle. This innermost circular contour line shows the best response value area. Five red dots on the contour are the central point of the design. At yield response, the most wanted value is fish oil with a maximum yield. Red area shows the maximum yield value. Five central points on the contour is right at the center point of the circle. This condition shows that the best response value will be obtained by conditioning factors at a central point.
Figure 1(b) is a 3D oil yield response surface that indicates the optimum yield at the center point of the design. In alkali refining, a solution of caustic soda (sodium hydroxide) is mixed with the oil to form soaps. These soaps are dispersed in the aqueous phase together with phospholipids, some pigments, and other compounds. Refining losses may occur during the process because of saponification of the oil or emulsification of some neutral oil in the aqueous phase, particularly if the free fatty acid content of oil is high, a high soap concentration will be produced15. The alkali significantly helped to hydrate the phospholipids. In addition, the soap formation may act as a good adsorbent for the phospholipids and other undesired oil components17.
Analysis of Factor Combination with FFA as Response
The range of FFA obtained was 0.28% 0.55% with the FFA average value was 0.47%. Based on the analysis Sequential Model Sum of Squares (SMSS), lack of fit, R2, and adjusted-R2 (Table 5), appropriate models resulted optimum reduction of FFA was linear polynomial models.
Table 5: Value of optimization parameter for FFA as response
|
Parameter |
SMSS Prob>F |
Lack of fit Prob>F |
R2 |
Adjusted R2 |
Annotation |
|
Linear |
0.0461 |
0.0809 |
0.4595 |
0.3514 |
Suggested |
|
2FI |
0.5330 |
0.0670 |
0.4836 |
0.3115 |
|
|
Quadratic |
0.2938 |
0.0621 |
0.6361 |
0.3762 |
|
Table 5 shows that the linear model has significant SMSS value with the “Prob> F” is less than 0.05 (0.0461). “Prob> F” of Lack of fit values is more than 0.05 (0.0809), it means that there is no lack of fit. Not significant lack of fit value shows that there is compatibility of FFA response data to the model. R2 value on quadratic model is 0.4595. R2 value means that the effect of variables X1 and X2 to the variable responses change is 45.95% while the rest 54.05% is affected by another unknown variable.
Analysis of variance (ANOVA) showed the effect of each factor on FFA response. Based on the effect of both factors, the temperature factor was the most significant factor which affected the FFA. This factor gives significant effect to FFA response with p-value “Prob> F” was less than 0.05 (0.0164). The following model is actual form of polynomial equations with FFA as response.
FFA response (Y) = 0.23499 4.16053E-003 X1 2.66866E-003 X2
X1 = NaOH concentration ( Be)
X2 = Temperature (°C)
The above equation model shows that the FFA will decrease with NaOH concentration decreasing and temperature decreasing. Contour and 3D surface FFA values can be seen in this following chart
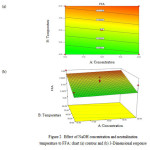 |
Figure 2: Effect of NaOH concentration and neutralization temperature to FFA: chart (a) contour and (b) 3-Dimensional response Click here to View figure |
Based on Figure 2(a) there are horizontal contour lines with a red dot on the third line from the bottom. Bottom horizontal contour lines show the best response value in which less FFA content. Five red dots on the contour is the central point of design. For FFA as response, the most wanted value is fish oil with a minimum FFA. Green area shows the minimum FFA value. Five central point on the contour are not exactly at the center point of the circle. This condition shows that the best response value will be obtained by conditioning factors not at the center, but shifted down towards to the green area. Optimum FFA response will be obtained when temperature is decreased.
Figure 2(b) shows that temperature has a significant effect on the levels of FFA fish oil. The purification process succeeded in reducing the levels of free fatty acids, as free fatty acids bind to the Na+ ion and become soap7. Saponification reaction which occurs also binds the pigment component, so the resulted semi refined oil color is brighter9.
Analysis of Factor Combination with PV as Response
The range of peroxide value (PV) obtained was 19.36 26.93 meq/kg with an average PV was 23.62 meq/kg. Based on the analysis Sequential Model Sum of Squares (SMSS), lack of fit, R2, and adjusted-R2 (Table 6), appropriate models resulted optimum reduction of PV was quadratic polynomial models.
Table 6: Value of optimization parameter for PV as response
|
Parameter |
SMSS Prob>F |
Lack of fit Prob>F |
R2 |
Adjusted R2 |
Annotation |
|
Linear |
0.5233 |
0.0450 |
0.1215 |
0.0542 |
|
|
2FI |
0.5327 |
0.0369 |
0.1607 |
0.1190 |
|
|
Quadratic |
0,0548 |
0.0847 |
0.6339 |
0.3724 |
Suggested |
Table 6 shows that the quadratic model has significant SMSS value with the “Prob> F” is as same as 0.05 (0.0548).”Prob> F” of Lack of fit values is more than 0.05 (0.0847), it means that there is no lack of fit. Not significant lack of fit value shows that FFA response data is compatible to the model. R2 value on quadratic model is 0.6339. R2 value means that the effect of variables X1 and X2 to the variable responses change is 63.39% while the rest 36.61% is affected by another unknown variable.
Analysis of variance (ANOVA) shows the effect of each factor on PV as response. Based on the effect of both factors, the temperature factor gives significant effect to the PV. This factor significantly affected response with p-value “Prob> F” is as same as 0.05 (0.0509). The following model is actual form of polynomial equations with PV as response:
PV Response (Y) = 84.11879 – 8.93027 X1 0.81937 X2 – 0.019938 X1X2 0.27078 X12 – 4.10469E-003 X22
X1 = NaOH concentration ( Be)
X2 = Temperature (°C)
Contour and 3D surface chart with PV as response can be seen in this following chart
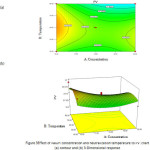 |
Figure 3: Effect of NaOH concentration and neutralization temperature to PV: chart (a) contour and (b) 3-Dimensional response Click here to View figure |
Based on Figure 3(a) circular contour lines with a red dot is outside the third circle from above. Outer circular contour lines show the best response value in which less peroxide value. Five red dots on the contour is the central point of design. For the PV as response, the most wanted value is fish oil with a minimum PV. Blue area shows the minimum peroxide value. Five central points on the contour are not exactly at the center point of the circle. This condition shows that the best response value will be obtained by conditioning factors not at the center, but shifted towards the upper right toward the blue area. Peroxide value will reach the optimum response if NaOH concentration and neutralization temperature increases.
Figure 3(b) is a peroxide value 3D response surface that indicates the neutralization temperature has significant effect on peroxide value. Peroxide value decreased in neutralization process due to the binding of peroxide fraction to free fatty acids, and it was removed by saponification process3.
Validation of Optimum Condition
Based on the analysis of the factor effect to the response and the determination of the adjusted range, Design Expert 7.0.0 program recommended that the optimum operation condition could be reached at a treatment of NaOH
18 °Be and neutralization temperature at 40 °C with the desirability value of its process was 0.534. Models will be considered as good and adequate if the obtained predictive response value is close to verified value in actual
conditions 16.
At this stage, the actual response value will be compared to predictive response value given by program. Program provides predictive response value, followed by 95% prediction interval. Prediction Interval (PI) is divided into two: 95% PI low and 95% PI high. PI low is the lowest value of the predicted interval while high PI is the highest value of the predicted interval. Definition of 95% in the PI shows that the confidence value of individual observations is 95%. The actual value is obtained from the results of laboratory observation while predictive value and 95% PI obtained from the Design Expert 7.0.0 process design. Comparison of predictive response value as optimization solutions with actual value results can be seen in Table 7.
Tabel 7: Comparison of response predictive value optimization solutions to the actual value
|
Response |
Control |
Actual |
Prediction |
95% PI |
|
|
Low |
High |
||||
| Yield |
– |
85.90 1.46 |
79.0742 |
66.29 |
91.86 |
| FFA |
5.74 |
0.53 0.07 |
0.421 |
0.29 |
0.55 |
| PV |
37.78 |
23.83 0.96 |
23.5201 |
18.66 |
28.38 |
After validation, semi refined fish oil had yield at 85.90%, free fatty acid content at 0.53%, and peroxide value at 23.83 meq/g. These actual values compared with the predicted response value provided by the program, all the obtained response values are still in the predictive interval value of the response. Based on these result, it can be concluded that the optimization solution recommended by the program is good.
Conclusion
Based on the result of the study, the optimum operation condition could be reached at a treatment of NaOH 18 °Be and neutralization temperature at 40 °C with the desirability value of its process was 0.534. The validation of optimum condition resulted semi refined oil which had yield at 85.90%, FFA reduction value at 90.77% , and PV reduction value at 36.92%.
References
- [AOAC] Association of official Analytical Chemist. Official Method of Analysis of the Association of Official Analytical of Chemist. The Association of Analytical Chemist, Inc., Arlington,Virginia (US), (2005).
- [AOCS] American Oil Chemists’ Society. Free Fatty Acids In: Official Methods and Recommended Practices of the American Oil Chemists Society. Vol 5a. 5thed. AOCS Press, Champaign (US), (1998).
- Aisha, S; Yulianti, E.; Fasya, A.G. Alchemy, 2010, 1, 93-103.
- Aktas, N; Boyaci, H.I.; Mutlu, M.; Tanyolac, A. Bioresource Technology, 2006, 97, 2252-2259.
- Bernardini, E. Vegetable Oils and Fats Processing. Interstamps House, Italy (1983).
- Chowdhury, S.; Saha, P.D. Journal Desalination and Water Treatment, 2011, 37, 331-336.
- Estiasih, T.; Ahmadi, K. 2012. Indonesian Journal of Agricultural Technology, 2012, 5(3), 116 – 128.
- Estiasih, T.; Nisa, F.C.; Ahmadi, K. Agritek, 2006, 14(3), 580-593.
- Feryana, I.W.K.; Suseno, S.H.; Nurjanah. Journal of Fishery Product Processing Indonesia, 2014, 17(3), 207-214.
- Hashimoto, M.; Tanabe, Y.; Fujii, Y.; Kikuta, T.; Shibata, H.; Shido, O. The Journal of Nutrition, 2005, 549-554.
- Hodgum, A.S. Refining and bleaching. In: Hui, Y.H. (Eds). Bailey’s Industrial Oil and Fat Products. Edible Oil and Fat Products: Processing Technology. John Wiley & Sons Inc, New York, (1995).
- Iriawan, N.; Astuti, S.P. Mengolah Data Statistik dengan Mudah Menggunakan Minitab 14. ANDI Yogyakarta Pr., Yogyakarta (ID), (2006).
- Ketaren , S. Pengantar Teknologi Minyak dan Lemak Pangan. UI Press, Jakarta, (2008).
- Kirk, K.E.; Othmer, V.F. Encyclopedia of Chemical Technology. John Willey and Sons Inc, New York (2005).
- Madamba, P.S. Lebensm, Wiss. u-Technology, 2005, 38, 157-165.
- [KKP] Indonesia Ministry of Fisheries Affairs and Marine. 2013. Statistik Perikanan Tangkap Perairan Laut (Indonesian statistic of marine capture fisheries). http://statistik.kkp.go.id.( 3rd August 2015).
- Wang, T.; Johnson, L.A. Journal of Oil and Fat Industries, 2001, 78, 71-76.

This work is licensed under a Creative Commons Attribution 4.0 International License.
![]()
A New Edition of Web of Science
Journal Impact Factor
2022: 0.5
Five Year: 0.8
Journal is Indexed in

Cabells Whitelist
![]()


