Determination of doxazosinmesylate by ion-pair complex formation with bismuth (III) tetraiodide using spectrophotometric and atomic absorption spectroscopic
Reda A. Ammar
Department of Chemistry, College of Science, Al Azhar University, Cario Egypt.
Corresponding Author Email: raammar@pnu.edu.sa
DOI : http://dx.doi.org/10.13005/ojc/310485
Article Received on :
Article Accepted on :
Article Published : 12 Dec 2015
Two simple, sensitive spectroscopic and atomic absorption spectrometric (AAS) methods have been suggested for the determination of doxazosinmesylate in pure form and tablet formulations. The methods are based on the formation of ion-pair associate between the drug and the inorganic complex, bismuth(III) tetraiodide. The reaction occurs in nitric acid medium forming orange-reda ion-pair associate which is instantaneously precipitated. The formed precipitate is filtered off and the residual unreacted metal complex in the filtrate is determined either spectrophotometrically at 453 nm or by AAS at 223.1 nm. Also, the precipitatemay be dissolved in acetone and quantified spectrophotometically at 470nm or decomposed by hydrochloric acid, and the bismuth content is determined by AAS at 223.1 nm. The two methods permit the determination of doxoazosinmesylate in the range of 5-80µg L-1. The proposed methods were successfully applied to determine doxazosinmesylate in its tablet formulations without any evidence for interference from pharmaceutical additives. The results were in good agreement with those obtained the reference method. The proposed methods, especially if automated, can be confidently applied for quality control and routine analysis of doxazosinmesylate.
KEYWORDS:Spectrophotometry; Atomic absorption spectroscopy; Doxazosinmesylate; Ion-pair; Pharmaceutical analysis
Download this article as:| Copy the following to cite this article: Ammar R. A. Determination of doxazosinmesylate by ion-pair complex formation with bismuth (III) tetraiodide using spectrophotometric and atomic absorption spectroscopic. Orient J Chem 2015;31(4). |
| Copy the following to cite this URL: Ammar R. A. Determination of doxazosinmesylate by ion-pair complex formation with bismuth (III) tetraiodide using spectrophotometric and atomic absorption spectroscopic. Orient J Chem 2015;31(4). Available from: http://www.orientjchem.org/?p=13272 |
Introduction
Background
Doxazosinmesyalate[I] is a quinazoline compound that is selective inhibitor of the alpha 1 subtype of alpha adrenergic receptor A. Benign Prostatic Hyperplasia (BPH) and used in treatment of hypertension. Doxazosinmesylate may be used in all BPH patients whether hypertensive or normotensive (1).
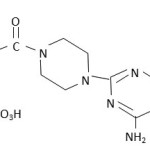 |
Scheme 1 Click here to View scheme |
Doxazosin Mesylate
Various methods have been published for the determination of doxazosinmesylate either by itself or in pharmaceutical preparations and biological fluids. The most methods included liquid chromatography (2-6), high performance thin layer chromatography (7), flow injection with UV detection (8) and polarography (9). The only reported spectrophotometric methods were that either measuring its UV absorbance at 248 nm in methanol (10), first derivative in presence of its degraded product (11) or reacting with bromocresol green and bromothymol blue and measuring the colour after extraction the complex in chloroform (12). Also, another spectrophotometric method was used for determination of doxazosinmesylate which depended on reaction with dichlorodicyano-p-benzoquinane (DDQ) or tetracyanoquinodimethane (TCNQ) which formed charge-transfer complexes in acetonitrile (12).
Still, there is a need for new methods to compete with new advancement and automation. Methods based on spectral measurements are the most advanced for automation point of view due to high simplicity. Also, atomic absorption spectroscopy is a rapid technique, suitable for routine analysis, easily automated and achieving a high degree of selectivity and its detection limits has not been reached by many other methods. However, to the best of our knowledge, it has not yet been applied to the analysis of doxazosinmesylate drug.
Therefore, the present study aims to use spectrophotometric and atomic absorption spectroscopic techniques for the determination of doxazosinmesylate in pure form and in its tablets dosage form. The suggested methods are based on the precipitation of the ion-pair of the drug with an excess [BiI4]– and quantifying it via the formed precipitate or the equilibrium concentration of the metal ion present in the supernatant solution using both techniques. The methods are simple, rapid, easily automated and not expensive, without loss of accuracy and hence more suitable for application in quality control laboratories in developing countries.
Experimental
Instruments
- The spectrophotometric measurements were performed using Ultrospec 2000, UV/Vis Spectrophotometer, Biochrom Ltd, Cambridge UK, equipped with 1 cm matched quartz cells.
- Atomic Absorption Spectrometer, Spectra AA 22OFS (Varian Australia) using Bismuth Lamp at 223. 1 nm, slit width 0.2 nm, relative noise 0.1,lamp current 20 mA and nitrogen time 3 sec. The flame used was an acetylene-air mixture.
Material and Reagents
All materials used were of analytical reagent grade. Doxazosinmesylate was kindly provided by Pfizer Co., Egypt (Cairo). It was used as received; its purity was 99.96%, according to the company.A stock solution of doxazosinmesylate was prepared as 100 mg % in double distilled water. Standard bismuth (III) solution, 0.01 M, was prepared by dissolving 0.4851g of Bi(NO3)3. 5H2O ( Merck) in 2 mL of HNO3, brought up to 100 mL with double distilled water, then mixed well and standardized complexometrically[13]. Potassium iodide (BDH), 0.5M and HNO3 (Riedel-dehaen) 2% solutions were prepared in double distilled water. Also 1×10⁻³M solution of bismuth (III) nitrate and equimolar solution of doxazosinmesylate were prepared. Solutions of lower concentration were obtained by accurate dilution with double distilled water.
Pharmaceutical Tablets
Doxazosinmesylate tablets were purchased from commercial markets, they included:- 1- Cardura, 4mg tablets, containing 4mg doxazosin (as base) per tablet, manufactured by Pfizer Egypt SAE Cairo ARE under Authority of Pfizer INC., USA.Batch No. 1202.
2-Dosin, 4mg tablets, containing 4mg doxazosin, as mesylate, per tablet, manufactured by EgyptianINT. Pharmaceutical Industries Co. (E.I.P.I.Co), 10th of Ramadan City, Egypt. Batch No.2250.
General Recommended Procedure
To a series of 10 mL volumetric flasks, 0.8 mL of 0.01M bismuth (III) nitrate solution was added followed by 0.8 mL of 0.5 M potassium iodide solution with continuous mixing. Accurately measured aliquots of the drug in the concentration range 5-80 µg mL-1 were then added followed by 1.0 mL of 2% HNO3. The solutions were shaken to coagulate the precipitate then completed to the mark with double distilled water, mixed well and filtered. Quantitation would then proceed via the surplus metal concentration in the filtrate or directly through the filtered precipitate.
Quantitation via the equilibrium metal concentration (in the filtrate)
The first few milliliters of the filtrate were rejected and another 2.0 mL of the filtrate were transferred to a 10 mL volumetric flask followed by 1.0 mL of 0.5 M potassium iodide solution. The solution was then mixed and diluted to volume with double distilled water. The absorbance was measured either spectrophotometrically at 453nm or using atomic absorption spectroscopy (AAS) at 223.1 nm against an appropriate blank prepared simultaneously. The equilibrium metal ion concentration was determined from a calibration graph of standard Bi(NO3)3 solution or using the regression equations. The concentration of the drug was calculated where, each 1mL of 0.01 M Bi(NO3)3 equals 5.4758 mg of doxazosinmesylate.
Quantitation via the formed precipitates
The precipitates obtained above were washed with the least amount of 0.2% HNO3 then undertaken the following procedures:
Spectrophotometric Procedure
The precipitates were completely dried in a vacuum desiccator or cautiously on a hot surface then dissolved quantitatively in acetone and the volume was made up to 10 mL in calibrated flasks, with the same solvent. The absorbance was measured at 470nm against an appropriate blank prepared simultaneously.
Atomic Absorption Procedure
The precipitates were quantitatively decomposed into 10 mL volumetric flasks using 1:4 HCl (v/v). The mixture was completed to volume with the same solvent and aspirated directly in the atomic absorption spectrometer for the absorbance to be measured at 223.1 nm against an appropriate blank prepared simultaneously. The concentration of the consumed bismuth was calculated from a calibration graph of standard Bi(NO3)3 solution or using the regression equations.
Procedure for dosage forms
An accurately weighed quantity of the pulverized tablets equivalent to 40 mg of doxazosinmesylate were transferred to 50 mL volumetric flask, 30 mL of double distilled water were added and sonicated to about 30 min. The volume was completed with water and filtered. Aliquots of this solution were transferred into a series of 10 mL volumetric flasks and the analysis was completed as previously mentioned, using the spectrophotometric or the AAS method. The nominal content of the tablets was calculated either from a previously plotted calibration graph or using the regression equations.
![Figure (1): Absorption spectra of [BiI4]-, 10-3M (a) and doxazosinmesylate (10µg/mL) ternary complex (b).](http://www.orientjchem.org/wp-content/uploads/2015/12/Vol31_No4_Dete_Red_Fig1-150x150.jpg) |
Figure 1: Absorption spectra of [BiI4]–, 10-3M (a) and doxazosinmesylate (10µg/mL) ternary complex (b). Click here to View figure |
Results and Discussion
The formation of ion-pairs between the amino group of many drugs and metal inorganic complexes has found wide application in the field of drug analysis applying colorimetric and AAS methods as well as in ion-selective electrodes [14-17].
Reaction of Bismuth (III) tetraiodide and doxazosinmesylate
In this work, doxazosinmesylate was found to react with bismuth(III) tetraiodide to form a stable ion-pair complex. This interaction and subsequent formation of the ion-pair occurs in acidic medium via the protonated nitrogen atom of the drug [14]. Being insoluble in aqueous solution, this ion-pair complex might be possibly isolated by direct filtration or extraction into organic solvents and assayed accurately without interference from excess unreacted metal complex.
Bismuth(III) tetraiodide inorganic complex has been used as a reagent for the determination of some nitrogenous drugs [18 and 19]. On mixing aqueous solutions of bismuth(III) tetraiodide complex and doxazosinmesylate in an acidic medium, a reddish orange precipitate instantaneously appeared that is attributed to the ion-pair formed in the reaction. This precipitate was filtered off and the residual unreacted bismuth (III) tetraiodide complex in the filtrate was analyzed at its peak absorption maximum either spectrophotometrically at 453 nm (Fig. 1) or using AAS at 223.1 nm. Iodide should be included during dilution of the filtrate to stabilize the residual [BiI4]– and prevent its precipitation upon dilution. On the other hand, the filtered precipitate could be reconstituted into acetone and analyzed spectrophotometrically at its peak absorption maximum 470 nm (Fig. 2) or into HCl for AAS estimation at 223.1 nm. Extraction of the formed ion-pair with different solvents was also studied. Low-Polarity solvents, such as chloroform and dichloromethane were inefficient due to insolubility of the ion-pair in such solvents and solvents with increased polarity such as n-butanol, acetone and isobutyl methyl ketone lacked selectivity and didn’t differentiate between the ion-pair and the residual unreacted [BiI4]– in the aqueous phase. Therefore, filtration was necessary to separate the formed ion-pair complex.
![Figure (2): Absorption spectrum of doxazosinmesylate (20µg/mL)-[BiI4]-, precipitate in acetone.](http://www.orientjchem.org/wp-content/uploads/2015/12/Vol31_No4_Dete_Red_Fig2-150x150.jpg) |
Figure 2: Absorption spectrum of doxazosinmesylate (20µg/mL)-[BiI4]–, precipitate in acetone. Click here to View figure |
Determination of the residual non-consumed bismuth (III) tetraiodide complex in the filtrate had the advantages of being rapid, simpler and more accurate and precise than the direct dissolution of the isolated precipitate, owing to possible errors during isolation and reconstitution steps.Fortunately, automation of the methods could not only eliminate this drawback but would enhance the overall analytical progress of the proposed methods, making them more suitable for routine quality control analysis of doxazosin. The collective data concerning the two suggested procedures are shown in Table 1.
Table 1: Collective Performance data for the analysis of doxazosinmesylate
| Analytical Procedure | Technique | Spectrophotometry | Atomic absorption spectroscopy |
| 1-Through the residualof unreacted Bi(III)in the filtrate | λmax, nmW.R, µg mL-1εReg. equation
(r) LOD LOQ |
453 8-60 6.6×10³ Δ A =0.0084C+ 0.0021 (0.9999) 0.86 2.62 |
223.1 10-80 — Δ A = 0.0069C+ 0.0042 (0.9995) 0.64 1.94 |
| 2-Via the Bi(III) contentin the precipitate | λmax, nmW.R, µg mL-1εReg. equation
(r)
|
470 5-50 1.5×10⁴ A = 0.0293 C -0.0033 (0.9998) |
223.1 5-50 – A = 0.0168C + 0.0015 (0.9999) |
| LOD |
0.52 |
0.48 |
|
| LOQ |
1.58 |
1.45 |
W.R. = Working Range
ε = Molar absorptivity (L mol-1 cm-1)
Reg. equation: A = a + b c, where a is the intercept, b is the slope, c is the concentration of the drug in µg mL-1, A is the absorbance, and (r) is the correlation coefficient, Δ A is the difference in absorbance.
LOD = Limit of Detection in µg mL-1
LOQ = Limit of Quantification in µg mL-1
Optimization of the reaction conditions
The different experimental parameters affecting the formation of the ion-pair complex were extensively studied to determine the optimal conditions for the assay procedure.
Effect of acid concentration
The choice of a suitable pH value at which the ion-pair associates exhibit the lowest solubility (at 25oC) is of prime importance in the use of such compounds in quantitative analysis. To determine this pH value, 0.05 M of KOH or 2% HNO3was used to adjust the pH of the solution because the presence of foreign ions in different buffer solutions could interfere with the ion-pair formation. From the obtained results, it was observed that at pH >3, there is a decrease in the precipitation yield with increasing pH, probably because of precipitation of bismuth as a hydroxo-species. The absorbance at λmax remains constant in the pH range 1.5 -1.7 which was achieved with1.0 -1.5 mL of 2% HNO3 (Fig.3). Therefore, the pH of the solution at about 1.5 (using 1 mL of 2 % HNO3) was chosen for carrying out the analytical procedure.
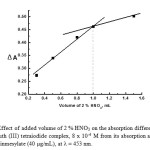 |
Figure 3: Effect of added volume of 2 % HNO3 on the absorption difference (ΔA) of a blank bismuth (III) tetraiodide complex, 8 x 10⁻⁴ M from its absorption after reaction with doxazosinmesylate (40 µg/mL), at λ = 453 nm. Click here to View figure |
Effect of reagent concentration
Figures 4 and 5showthe influence of the iodide and bismuth concentration on the ion-pair formation at a constant concentration of the other. At the bismuth concentration used 1×10⁻³ M, the iodide concentration of 1×10⁻²M was required to obtain the maximum precipitation of the drug as its ion-pair. As can be seen in (Fig 4), 0.8-1.0 mL of iodide was sufficient for complete reaction, at this iodide concentration, a bismuth concentration of 1×10⁻³ (0.8 mL) was found optimum for complete drug precipitation (Fig 5). Generally, the formation of the ion-pair was rapid and the color produced in both quantitation procedures was still stable for more than 24 hr. The more favorable sequence addition is bismuth (III)–KI- drug for the highest and complete ion-pair formation.
![Figure (4):Effect of KI concentration on the development of the ion-associate of (40 µg/mL) doxazosinmesylate as indicated by absorption difference (ΔA) of the residual unreacted bismuth (III) from a blank at λ = 453 nm, [Bi3+] = 8 x 10⁻⁴ M.](http://www.orientjchem.org/wp-content/uploads/2015/12/Vol31_No4_Dete_Red_Fig4-150x150.jpg) |
Figure 4: Effect of KI concentration on the development of the ion-associate of (40 µg/mL) doxazosinmesylate as indicated by absorption difference (ΔA) of the residual unreacted bismuth (III) from a blank at λ = 453 nm, [Bi3+] = 8 x 10⁻⁴ M. Click here to View figure |
![Figure (5): Effect of bismuth(III) nitrate concentration on the development of the ion-associate complex of (40 µg/mL) doxazosinmesylate as indicated by absorption difference (ΔA) of the residual unreacted bismuth from a blank at λ = 453 nm, [KI] = 0.04 M.](http://www.orientjchem.org/wp-content/uploads/2015/12/Vol31_No4_Dete_Red_Fig5-150x150.jpg) |
Figure 5: Effect of bismuth(III) nitrate concentration on the development of the ion-associate complex of (40 µg/mL) doxazosinmesylate as indicated by absorption difference (ΔA) of the residual unreacted bismuth from a blank at λ = 453 nm, [KI] = 0.04 M. Click here to View figure |
Composition of the ion-pair associate
The composition of the ion-pair associate was established by Job’s method of continuous variation [20] and molar ratio method [21] using equimolar solutions (1×10⁻³ M) of the studied drug and reagent Bi(NO3)3. The results obtained are shown in Figures (6 and 7) by plotting the absorbance of the precipitate in acetone versus the mole fraction of the drug(Jobs method) or the absorbance difference (ΔA) of the surplus Bi(III) in the filtrate versus the concentration of the reagent using a fixed concentration of the drug (2 mL of 1×10⁻³ M) by the molar ratio method. As shown in Figures (6 and 7), the composition of the associate was equimolar (1:1). According to this ratio, it was found that: 1 mg bismuth = 4.51475 mg doxazosin base and = 5.4758 mg doxazosinmesylate
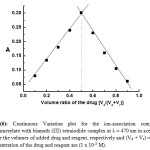 |
Figure 6: Continuous Variation plot for the ion-association complex of doxazosinmesylate with bismuth (III) tetraiodide complex at λ = 470 nm in acetone. Vd and Vr are the volumes of added drug and reagent, respectively and (Vd + Vr) = 1.0 mL. The concentration of the drug and reagent are (1 x 10⁻³ M). Click here to View figure |
This stoichiometric ratio supports that the interaction of doxazosin and the reagent used takes place at only one site which was the more sterically free terminal basic aliphatic amino group [18]. A proposal for the reaction mechanism is presented in Scheme 1.
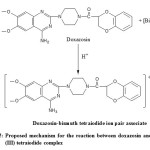 |
Scheme 1: Proposed mechanism for the reaction between doxazosin and bismuth (III) tetraiodide complex Click here to View scheme |
Method Validation
Linearity and range
Under the experimental conditions described above, the calibration graph of doxazosinmesylate was constructed by plotting absorbance or absorbance difference versus concentration (µg mL-1) (Fig. 8-11), conformity with Beer’s Law was evident in the concentration ranges 5- 80 µg mL-1, as cited in Table 1; regression equations, intercepts , slopes and regression coefficients are presented in the Table.
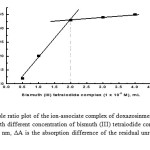 |
Figure 7: Mole ratio plot of the ion-associate complex of doxazosinmesylate (2 mL of 1 x 10⁻³ M) with different concentration of bismuth (III) tetraiodide complex (1 x 10⁻³ M) at λ = 453 nm, ΔA is the absorption difference of the residual unreacted bismuth from a blank. Click here to View figure |
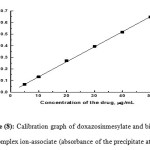 |
Figure 8: Calibration graph of doxazosinmesylate and bismuth tetraiodide complex ion-associate (absorbance of the precipitate at λ = 470 nm). Click here to View figure |
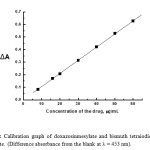 |
Figure 9: Calibration graph of doxazosinmesylate and bismuth tetraiodide complex ion-associate. (Difference absorbance from the blank at λ = 453 nm). Click here to View figure |
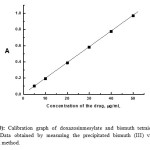 |
Figure 10: Calibration graph of doxazosinmesylate and bismuth tetraiodide ion-associate. Data obtained by measuring the precipitated bismuth (III) via Atomic Absorption method. Click here to View figure |
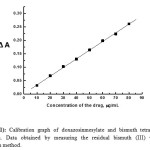 |
Figure 11: Calibration graph of doxazosinmesylate and bismuth tetraiodide ion-association. Data obtained by measuring the residual bismuth (III) via Atomic Absorption method. Click here to View figure |
Accuracy and Precision
To prove the accuracy of the proposed methods, the results of the assay of doxazosinmesylate in pure form were compared with those of the reference method[12].The reference method recommended spectrophotometric determination of doxazosinmesylate by tetracyanoquinodimethane which forms charge-transfer complex with doxazosinmesylate in acetonitrile and measuring the absorbance at 745 nm or 845 nm. The % recoveries of doxazosinmesylate using the proposed and reference methods are illustrated in Tables 2and 3. The validity of the proposed methods was evaluated by statistical analysis between the results obtained and that of the reference method. Regarding the calculated student’s t-test and variance ratio F-test (Tables 2 and 3) there is no significant difference between the proposed and reference methods regarding accuracy and precision, respectively.
The proposed method was applied successfully for the determination of doxazosinmesylate in tablets dosage form. No problem was encountered during extraction of the drug from its tablets with water followed by filtration and no interference was noticed from common excipients, such as talc, starch, magnesium stearate and gelatin. All of these substances are insoluble in water and are removed by filtration. Tables 2 and 3 assessed the validity of the method as regard to accuracy and precision and indicate that the proposed methods could be successfully applied for the determination of doxazosinmesylate in tablets containing it without interference from additives or excipients.
Table 2: Application of the proposed methods for the analysis of doxazosinmesylate in pure form and tablets (through unreacted Bi(III) in the filtrate).
|
Proposed methods |
||||||
| Spectropho. | AAs | Ref. method[12] | ||||
| Amt. taken,µg mL-1 | Found, µg mL-1 | Found,% | Found, µg mL-1 | Found,% | Found,% | |
| 10 | 9.94 | 99.35 | 10.12 | 101.23 | 99.67 | |
| 16 | 16.04 | 100.24 | 16.104 | 100.65 | 100.48 | |
| 20 | 20.30 | 101.51 | 20.28 | 101.04 | 101.24 | |
| 30 | 30.13 | 100.43 | 29.96 | 99.85 | 100.06 | |
| 40 | 39.66 | 99.14 | 39.82 | 99.54 | – | |
| 50 | 50.88 | 101.76 | 50.16 | 100.32 | – | |
± S. D. 100.41 ± 1.08 100.44 ± 0.66 100.36 ± 0.67
F-test 2.58 (9.01) 1.02 (5.41)
t-test 0.08 (2.31) 0.19 (2.31)
|
Proposed methods |
||||||
| Spectropho. | AAs | Ref. method[12] | ||||
| Amt. taken,µg mL-1 | Found, µg mL-1 | Found,% | Found, µg mL-1 | Found,% | Found,% | |
| 10 | 9.96 | 99.56 | 9.88 | 98.82 | 99.24 | |
| 20 | 19.76 | 98.82 | 19.79 | 98.96 | 98.25 | |
| 30 | 29.67 | 98.91 | 29.83 | 99.42 | 98.14 | |
| 40 | 39.80 | 99.51 | 39.57 | 98.93 | 99.45 | |
± S. D. 99.20 ± 0.39 99.03 ± 0.27 98.77 ± 0.67
F-test 2.97 (9.28) 6.38 (9.28)
t-test 1.11 (2.45) 0.72 (2.45)
|
Proposed methods |
||||||
| Spectropho. | AAs | Ref. method[12] | ||||
| Amt. taken,µg mL-1 | Found, µg mL-1 | Found,% | Found, µg mL-1 | Found,% | Found,% | |
| 10 | 9.96 | 99.62 | 9.88 | 98.83 | 98.88 | |
| 20 | 19.91 | 99.53 | 19.74 | 98.68 | 99.80 | |
| 30 | 29.83 | 99.42 | 29.86 | 99.53 | 98.65 | |
| 40 | 39.47 | 98.68 | 39.58 | 98.94 | 98.92 | |
± S. D. 99.31 ± 0.43 99.00 ± 0.37 99.06 ± 0.51
F-test 1.41 (9.28) 1.88 (9.28)
t-test 1.16 (2.45) 0.19 (2.45)
± S. D. = mean ± standard deviation; the values between brackets are the tabulated ones [23].
F-test = Variance ratio
t-test = student’s-t-test
Table 3: Application of the proposed methods for the analysis of doxazosinmesylate in pure form and tablets (through the equivalent Bi(III) in the precipitate).
|
Proposed methods |
||||||
| Spectropho. | AAs | Ref. method[12] | ||||
| Amt. taken,µg mL-1 | Found, µg mL-1 | Found,% | Found, µg mL-1 | Found,% | Found,% | |
| 10 | 9.95 | 99.53 | 9.86 | 98.63 | 99.24 | |
| 20 | 19.74 | 98.69 | 19.78 | 98.88 | 98.25 | |
| 30 | 29.93 | 99.76 | 29.79 | 99.29 | 98.14 | |
| 40 | 39.59 | 98.97 | 39.88 | 99.71 | 99.45 | |
X–± S. D. 99.24 ± 0.49 99.13 ± 0.47 98.77 ± 0.67
F-test 1.85 (9.28) 2.00 (9.28)
t-test 1.13 (2.45) 0.88 (2.45)
|
Proposed methods |
||||||
| Spectropho. | AAs | Ref. method[62] | ||||
| Amt. taken,µg mL-1 | Found, µg mL-1 | Found,% | Found, µg mL-1 | Found, % | Found, % | |
| 10 | 9.87 | 98.68 | 9.89 | 98.86 | 98.88 | |
| 20 | 19.86 | 99.29 | 19.94 | 99.70 | 99.80 | |
| 30 | 29.68 | 98.94 | 29.57 | 98.58 | 98.65 | |
| 40 | 39.49 | 98.72 | 39.77 | 99.42 | 98.92 | |
X–± S. D. 98.91 ± 0.28 99.14 ± 0.51 99.06 ± 0.51
F-test 3.33 (9.28) 1.01 (9.28)
t-test 0.52 (2.45) 0.22 (2.45)
X–± S. D. = mean ± standard deviation; the values between brackets are the tabulated ones [23].
F-test = Variance ratio
t-test = student’s-t-test
Limit of detection (LOD) and limit of quantitation (LOQ)
LOD and LOQ were determined according to ICH Q2B recommendation [22]. The limit of quantitation (LOQ) was determined by establishing the lowest concentration that can be measured below which the calibration graph is non-linear. The limit of detection (LOD) was determined by evaluating the lowest concentration of the analyte that can be readily detected LOQ and LOD were calculated according to the following equations
LOQ= 10 σ/S and
LOD=3.3 σ/S
Whereσ is the standard deviation of the intercept of regression line and S is the slope of the calibration curve.
The LOD and LOQ with the regression equations are given in Table 1.
Conclusions
The proposed methods described in this part are simple and applicable for routine analysis of doxazosinmesylate in raw material and its tablets over a wide concentration range without interference from common excipients. The methods can use both spectrophotometric and AAS techniques for the final measurements step. Moreover, they also have the advantage that no extraction is needed to separate the ion-associate formed, thereby avoiding the hazards of the organic solvents and being simpler and more convenient, at low cost.
Although the present methods are more time-consuming (5-15 min) compared to some other methods such as (10 min for HPLC), they exhibit fair sensitivity and accuracy. Moreover, the simplicity and convenience at low cost as well as the reproducibility, accuracy and sensitivity of the residual bismuth quantitation procedure are superior or complete to those obtained from other methods such as titrimetry. Therefore, the methods, especially if automated, should be useful for routine analytical and quality control assay of the studied drug adding significant advantage to the field.
References
- Conners, K.A. “Remington: The Science and Practice of Pharmacy”, 20th Ed., Lippincott Williams &Wikins, Easton, 2000, 14, 183.
- Kim, Y. J., Lee, Y., Kang, M. J., Huh, J. S., Yoon, M., Lee, J. and Choi, Y. W., Biomed. Chromatogr. 2006, 20,1172-1177.
- Ma, N., Liu, W., Li, H., Chen, B., Zhu, Y., Liu, X., Wang, F., Xiang, D., and Zhang, B., J Pharm. Biomed. Anal. 2007, 43,1049-1056.
- Erceg, M., Cindric, M., Frketic, L. ., Vertzoni, M., Centina-Cizmek, B. and Repas, B., J. Chromatogr. Sci.2010 ,48,114-119.
- Dhanya, B., Suganthi, A., Sen, A. K., Sahoo, U. and Seth, A. K., Indian J. Pharm. Sci. 2011, 73, 120-122.
- Kulsum, S., Sagar, G. V., Padmalath, M., Sudheer, P., and Bavandla, S., Asian J. Pharm. Sci. Clin. Res. 2011 ,1,1 – 5.
- Sane, R. T., Francis, M., Hiijli, P. S., Pawar, S., and Pathak, A. R., J. Plan Chromatogr. 2022,15 34 – 37.
- Alttiokka, G. and Atkosar, Z., J. Pharm. Biomed. Anal. 2002,27 841 – 844.
- Alttiokka, G. and Tuncel, M., J. Pharm. Biomed. Anal. 1998 ,17,169 – 175.
- Latha, H. P. and Sagar, Dr. G. V., J. Pharm. Res. 2011 ,4,1642 – 1643.
- Bebawy, L. I., Moustafa, A. A., and Abo-Talib, N. F., J. Pharm. Biomed. Anal. 2002,27,779 – 793.
- Aydogmus, Z., Aydodmup, A. and Barla, A., J. Assoc. Off. Anal. Chem. Int. 2009,92,131 – 137.
- Vogel, A.I. “A Textbook of Quantitative Inorganic Analysis” 3rd Ed., Longman, London, 1961,442
- El-Ansary, A.L.; el-hawary, W.F.; Issa, Y.A. and Ahmed, A.F. Quim.Anal. (Barcelona) 1998 17 199.
- El-Kousy, N.M. and Bebawy, L.I. J. Pjarm. Biomed.Anal. 1999,20 671.
- Fuijiwara, T.; Mohammadazi, I.U.; Murayama, K. and Kumamaru, T. Anal. Chem. 2000,72 1715.
- Khalil, S. and Kelzieh, A. J. Pharm. Biomed. Anal. 2002, 27,123.
- El-Brashy, A.M.; metwally, M.E.S. and El-Sepai, F.A. J. Chin. Chem. Soc. 2005, 52 253.
- Abdellaziz, L.M. and Hosney, M.M Anal. Chem. Insights 2011 ,6, 67.
- Rose, J. “Advanced Physico-Chemical Experiments”, Pitman, London 1964,54.
- Job, P. “Spectrochemical Methods of Analysis”, Wiley Interscience, New York, 1971 346.
- ICH, Q 2(R1); Validation of Analytical Procedures: Text and Methodology, International Conference on Harmonization, Geneva (2005).
- Miller, J.N. and Miller, J.C. “Statistics and Chemometrics for Analytical Chemistry”, 5th Ed., Pearson Education Limited, Harlow (2005).

This work is licensed under a Creative Commons Attribution 4.0 International License.
![]()
A New Edition of Web of Science
Journal Impact Factor
2022: 0.5
Five Year: 0.8
Journal is Indexed in

Cabells Whitelist
![]()


